

1. Introduction
The World Health Organization (WHO, 2020) defines reproductive health as having complete physical, mental, and social well-being in all matters relating to the reproductive system and its functions and processes, not merely the absence of disease or infirmity. Reproductive health includes the ability to have a satisfying and safe sex life, being capable of reproducing, and having the freedom to decide if, when, and how often to do so. Fertility and childbearing have been cornerstones of all societies and consume a significant share of global spending on health.
This paper provides a perspective on the prospects for, and implications of, fertility trends. Its intended audience includes actuaries and their organisations, decision-makers, researchers, and others who are involved with or interested in the potential effects of demographic trajectories.
The aims of the paper are to:
-
draw attention to the wider implications of future fertility patterns, their proximate determinants, and long-term effects, including the ageing of populations, impacts on the workforce, and processes that societies will experience over the coming decades.
-
enhance understanding of the outcomes of future fertility trajectories for local and global economies and markets, and the sustainability of financial products, safety nets, educational, health, and other population-related systems.
-
provide a deeper understanding of the methodologies and assumptions underlying fertility and population projections for those involved in developing social security and safety net programmes, and managing educational, health, and social developments.
Public and private sector entities, such as governments, financial institutions, insurance companies, and providers of products and services for babies and children, need to assess the social, educational, healthcare, safety nets, economic, financial, and other needs of their “customers,” and determine ways to satisfy these needs.
Policy analysts, actuaries, and decision-makers assess fertility rates, along with other demographic factors such as mortality, morbidity, and migration, to understand population patterns and project future demographic and economic developments. In actuarial studies, fertility can be an important component in the setting of assumptions and in the analysis used to study the sustainability, marketing, and product design of financial and other products and services. These assessments help determine, for example, how many schools, hospitals, and long-term care facilities will be needed; what size workforce will be available; what will be the economic impacts of population ageing; and what will be the costs, sustainability, and appropriate funding methods for alternative social insurance, pension, healthcare, and other social programmes.
A fertility rate is the quantitative measure of the production of live offspring, which depends on proximate biological factors such as age, fecundityFootnote 1 (male and female), genetics, and health, as well as on behavioural, social, economic, and environmental variables such as family and marriage/partnership, sexual behaviour, contraceptive practices, peer attitudes, religion, education, healthcare, labour force participation, economic pressures, costs of raising children, and maternal and community support.
As lifespans lengthened and mortality declined during the 20th century, our planet experienced the largest population increase ever known, from 1.6 billion in 1900 to 6.0 billion in 2000, passing 8.0 billion in 2022. At the same time, as women gained greater access to education and contraceptives, and as the costs and anxieties of raising children continued to increase, more parents delayed pregnancy and ultimately had smaller families. Even in countries long associated with rapid population growth, such as India and Mexico, birth rates are already below their natural population replacement rate.
The following descriptions may enhance the understanding of the topics discussed in this paper:
-
Fertility is measuredFootnote 2 either relative to a period or to a cohort. In period studies, fertility is measured for a given population during a selected period, usually a year, while cohort studies follow fertility patterns of a selected group (cohort) of women born in the same period, usually the same year, over their lifetimes. This distinction may help determine whether a change in the number of births is due to a delay or acceleration in having children (tempo effect), or to an increase or reduction in the ultimate number of children over a mother’s lifetime (quantum effect).
-
The quantum of fertility in a population is usually summarised using the total fertility rate (TFR) metric, the average number of births a hypothetical woman would have over her fertility lifetime (broadly between ages 14 and 49), assuming she lives over this entire period. This can be expressed in terms of period or cohort (CFR) rates.
-
The crudest, but still commonly used measure, of fertility is the crude birth rate which is the number of births in a period divided by the size of a corresponding population, and usually expressed per thousand females per year. This measure can be useful over a short period, but it can give misleading results over a longer period, due to changes in population mix or temporal effects, even if the underlying fertility rates are not changing.
-
The age-specific rate of fertility is the number of births to females of a specific age (or age range), divided by the number of females of that age (or age range). Tempo and quantum effects recognise changes in the distribution of births by the mother’s age.
-
The replacement rate is the level of fertility per woman that, not reflecting migration and assuming no changes in mortality rates, results in a long-term stable level of total population. For most high-income countries, this is at about a TFR of 2.1 although it may be slightly lower for countries with quite low mortality and higher in countries with relatively high mortality.
-
The child dependency ratio is the ratio of dependent children to the number of supporting adults in a specific population (e.g. the ratio of the number of people between the ages of 0 and 19 years to the number of people between ages 20 and 65 years, which in 2020 was 129:100 for sub-Saharan countries, compared to 65:100 for Europe). The old-age dependency ratio is similar, being the ratio of the number of retired (e.g. those older than 65 years) to the number of supporting adults. The age range of 20 and 65 years to denote the length of a working lifetime is arbitrary and is changing over time, particularly in more developed countries.
The balance of the paper is composed of the following five chapters:
-
Chapter 2 – Fertility trends and drivers. This chapter provides an overview of fertility trends and describes some of the major contributing factors to changes in the levels and patterns of fertility.
-
Chapter 3 – Modelling fertility. This chapter describes methodologies used to model fertility and a major United Nations projection of long-term fertility.
-
Chapter 4 – Economic and sociological implications of fertility and ageing. This chapter discusses some of the key consequences of various fertility patterns.
-
Chapter 5 – Responding to fertility changes. This chapter discusses some possible approaches to respond to changes in fertility patterns, and the role of actuaries in the study of fertility.
-
Chapter 6 – Conclusions. This chapter provides a summary of the key issues raised in this paper.
2. Fertility Trends and Drivers
This chapter describes some of the key factors that influence fertility rates. It starts with a brief description of how fertility has varied over time and place and then describes the “demographic transition”, before looking at some of the key influences on fertility rates. The chapter ends with a look at the impact of economic recessions, pandemics, and other crises on fertility.
2.1 Historical Trends of Fertility Rates
According to the United Nations (2022), as shown in Figure 1, fertility rates across the globe have fallen over the past 70 years or so and are expected to continue falling and converging over the 21st century.
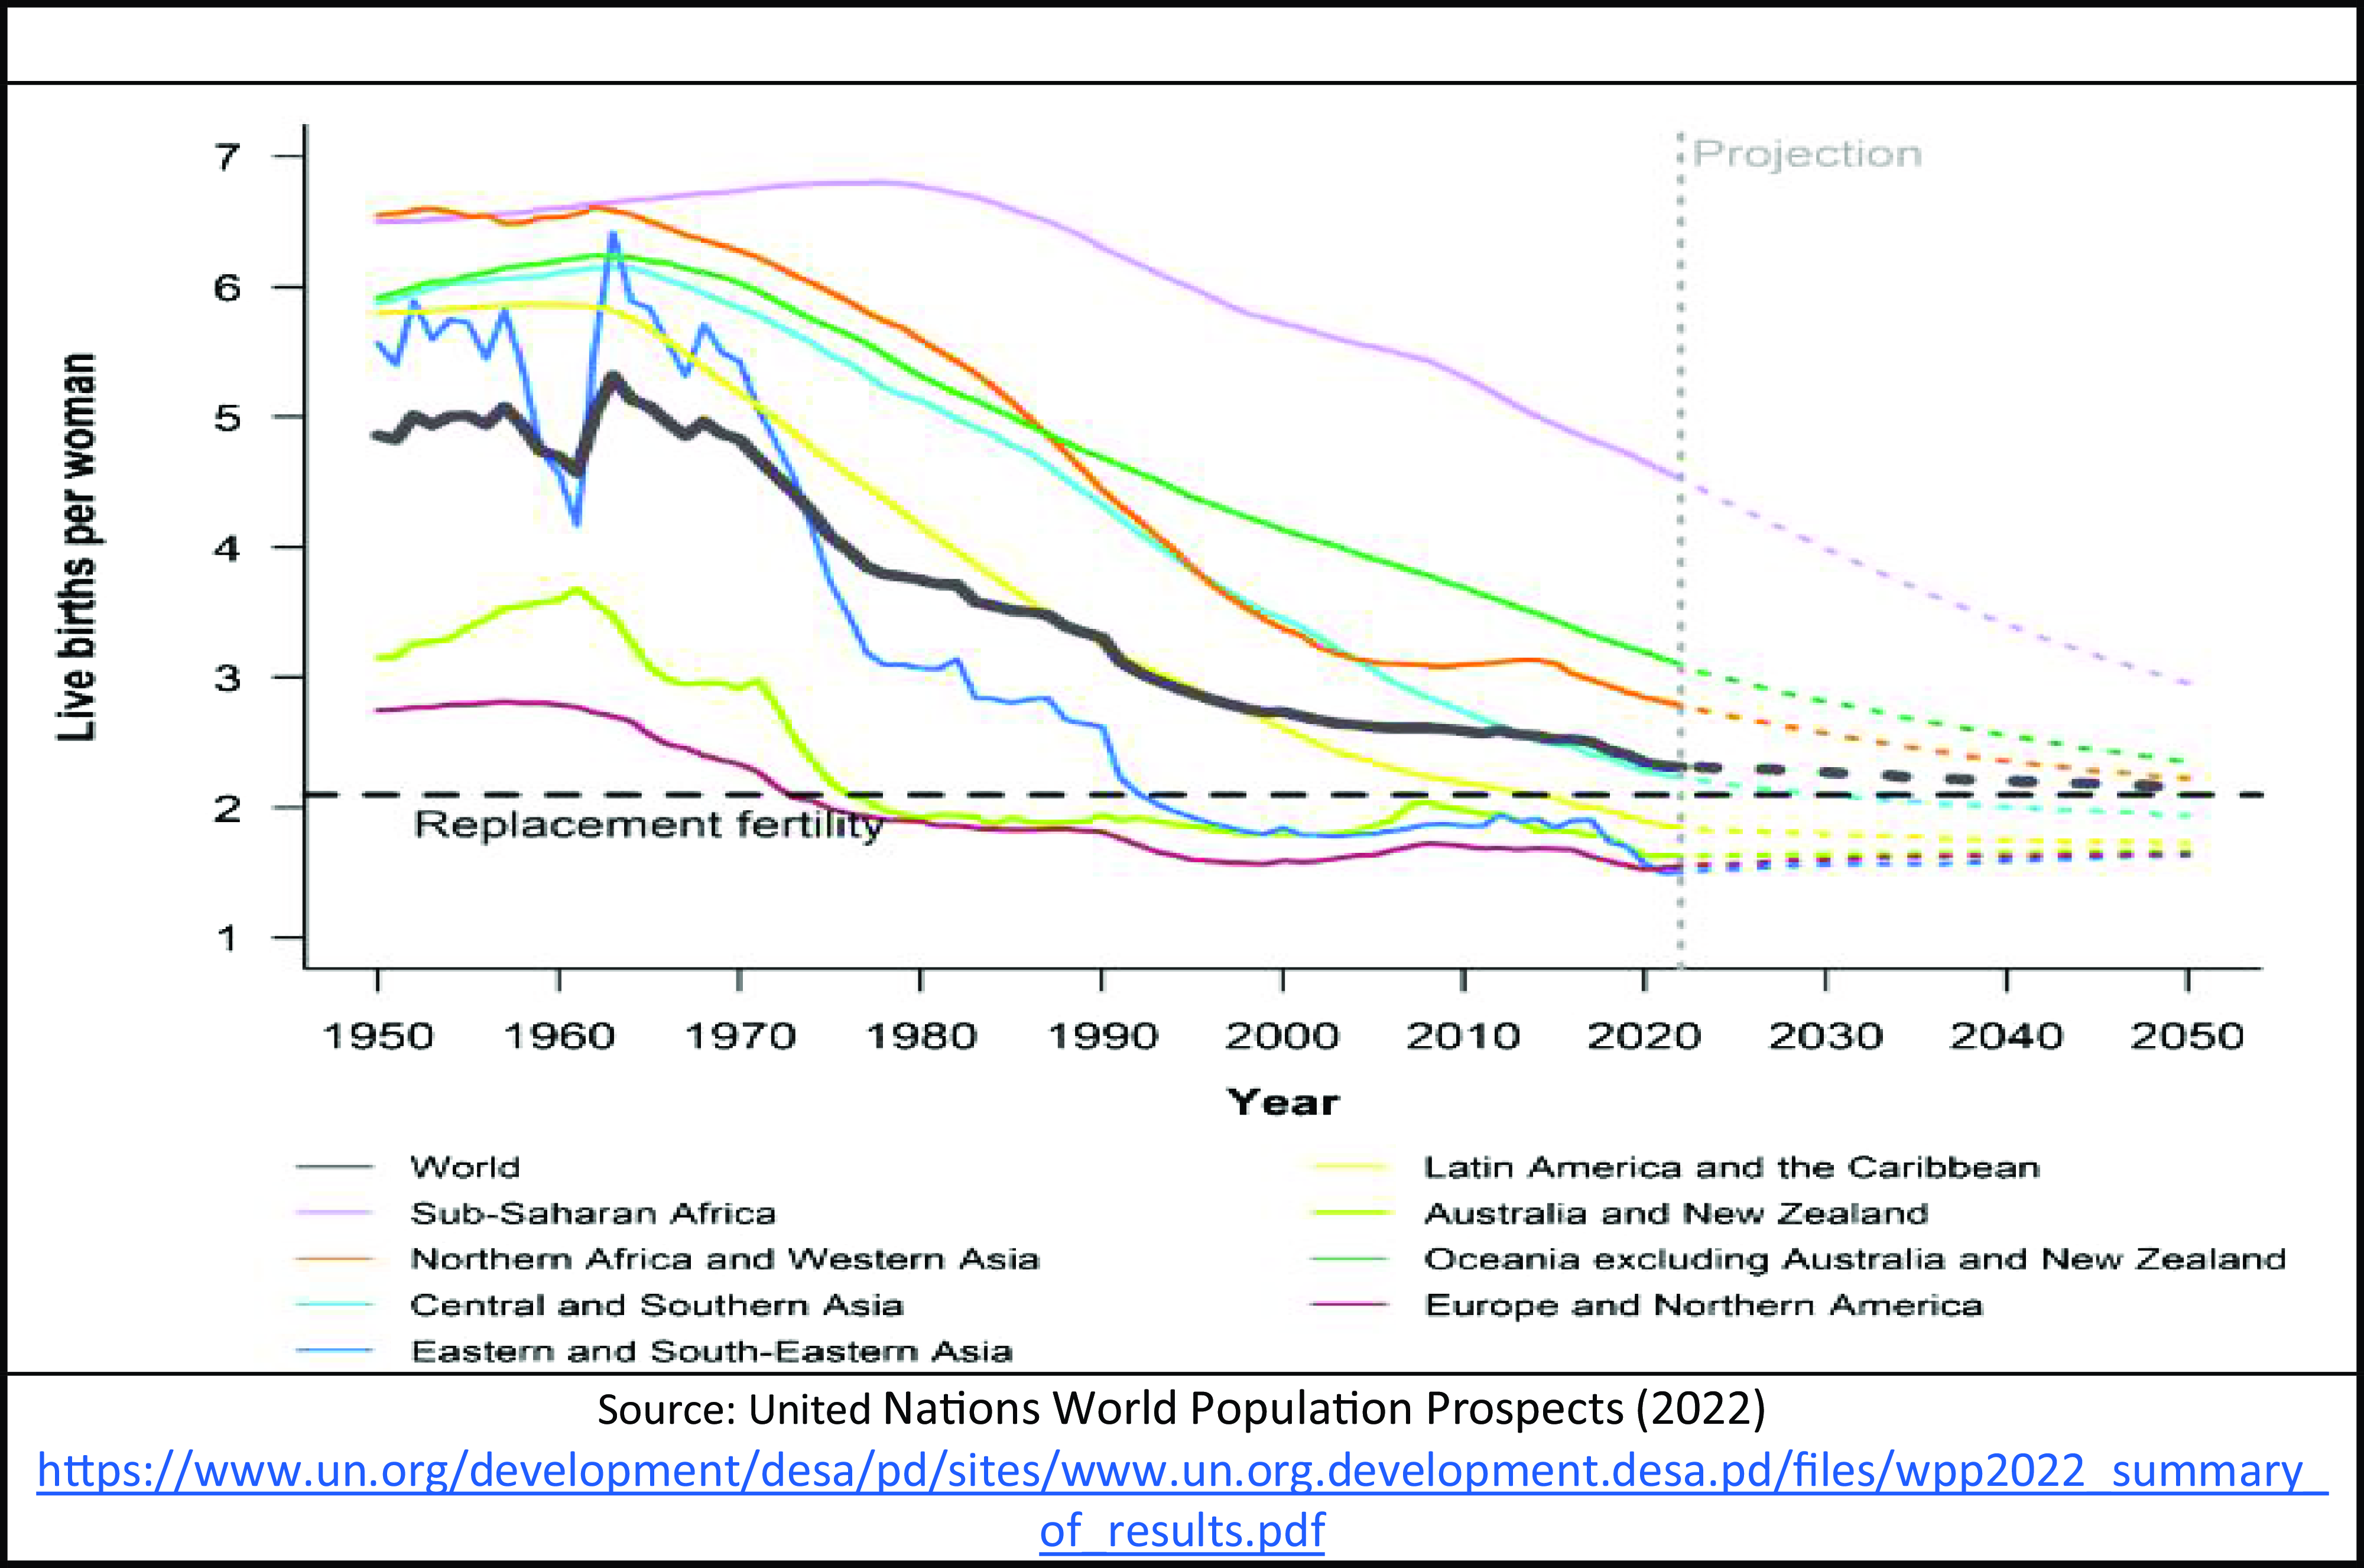
Figure 1. Total fertility rate: estimates 1950–2021, and medium scenario 2022–2050.
However, historical and projected fertility patterns significantly differ by continent and between developed and developing countries, as shown in Figure 2, as well as by individual countries and even within countries. Apart from Africa and Israel, with the highest fertility rates, the aggregate TFRs for all other continents had, by 2020, moved to a level below the replacement rate of 2.1, and is projected by the United Nations to remain below this rate, assuring population decline and ageing.
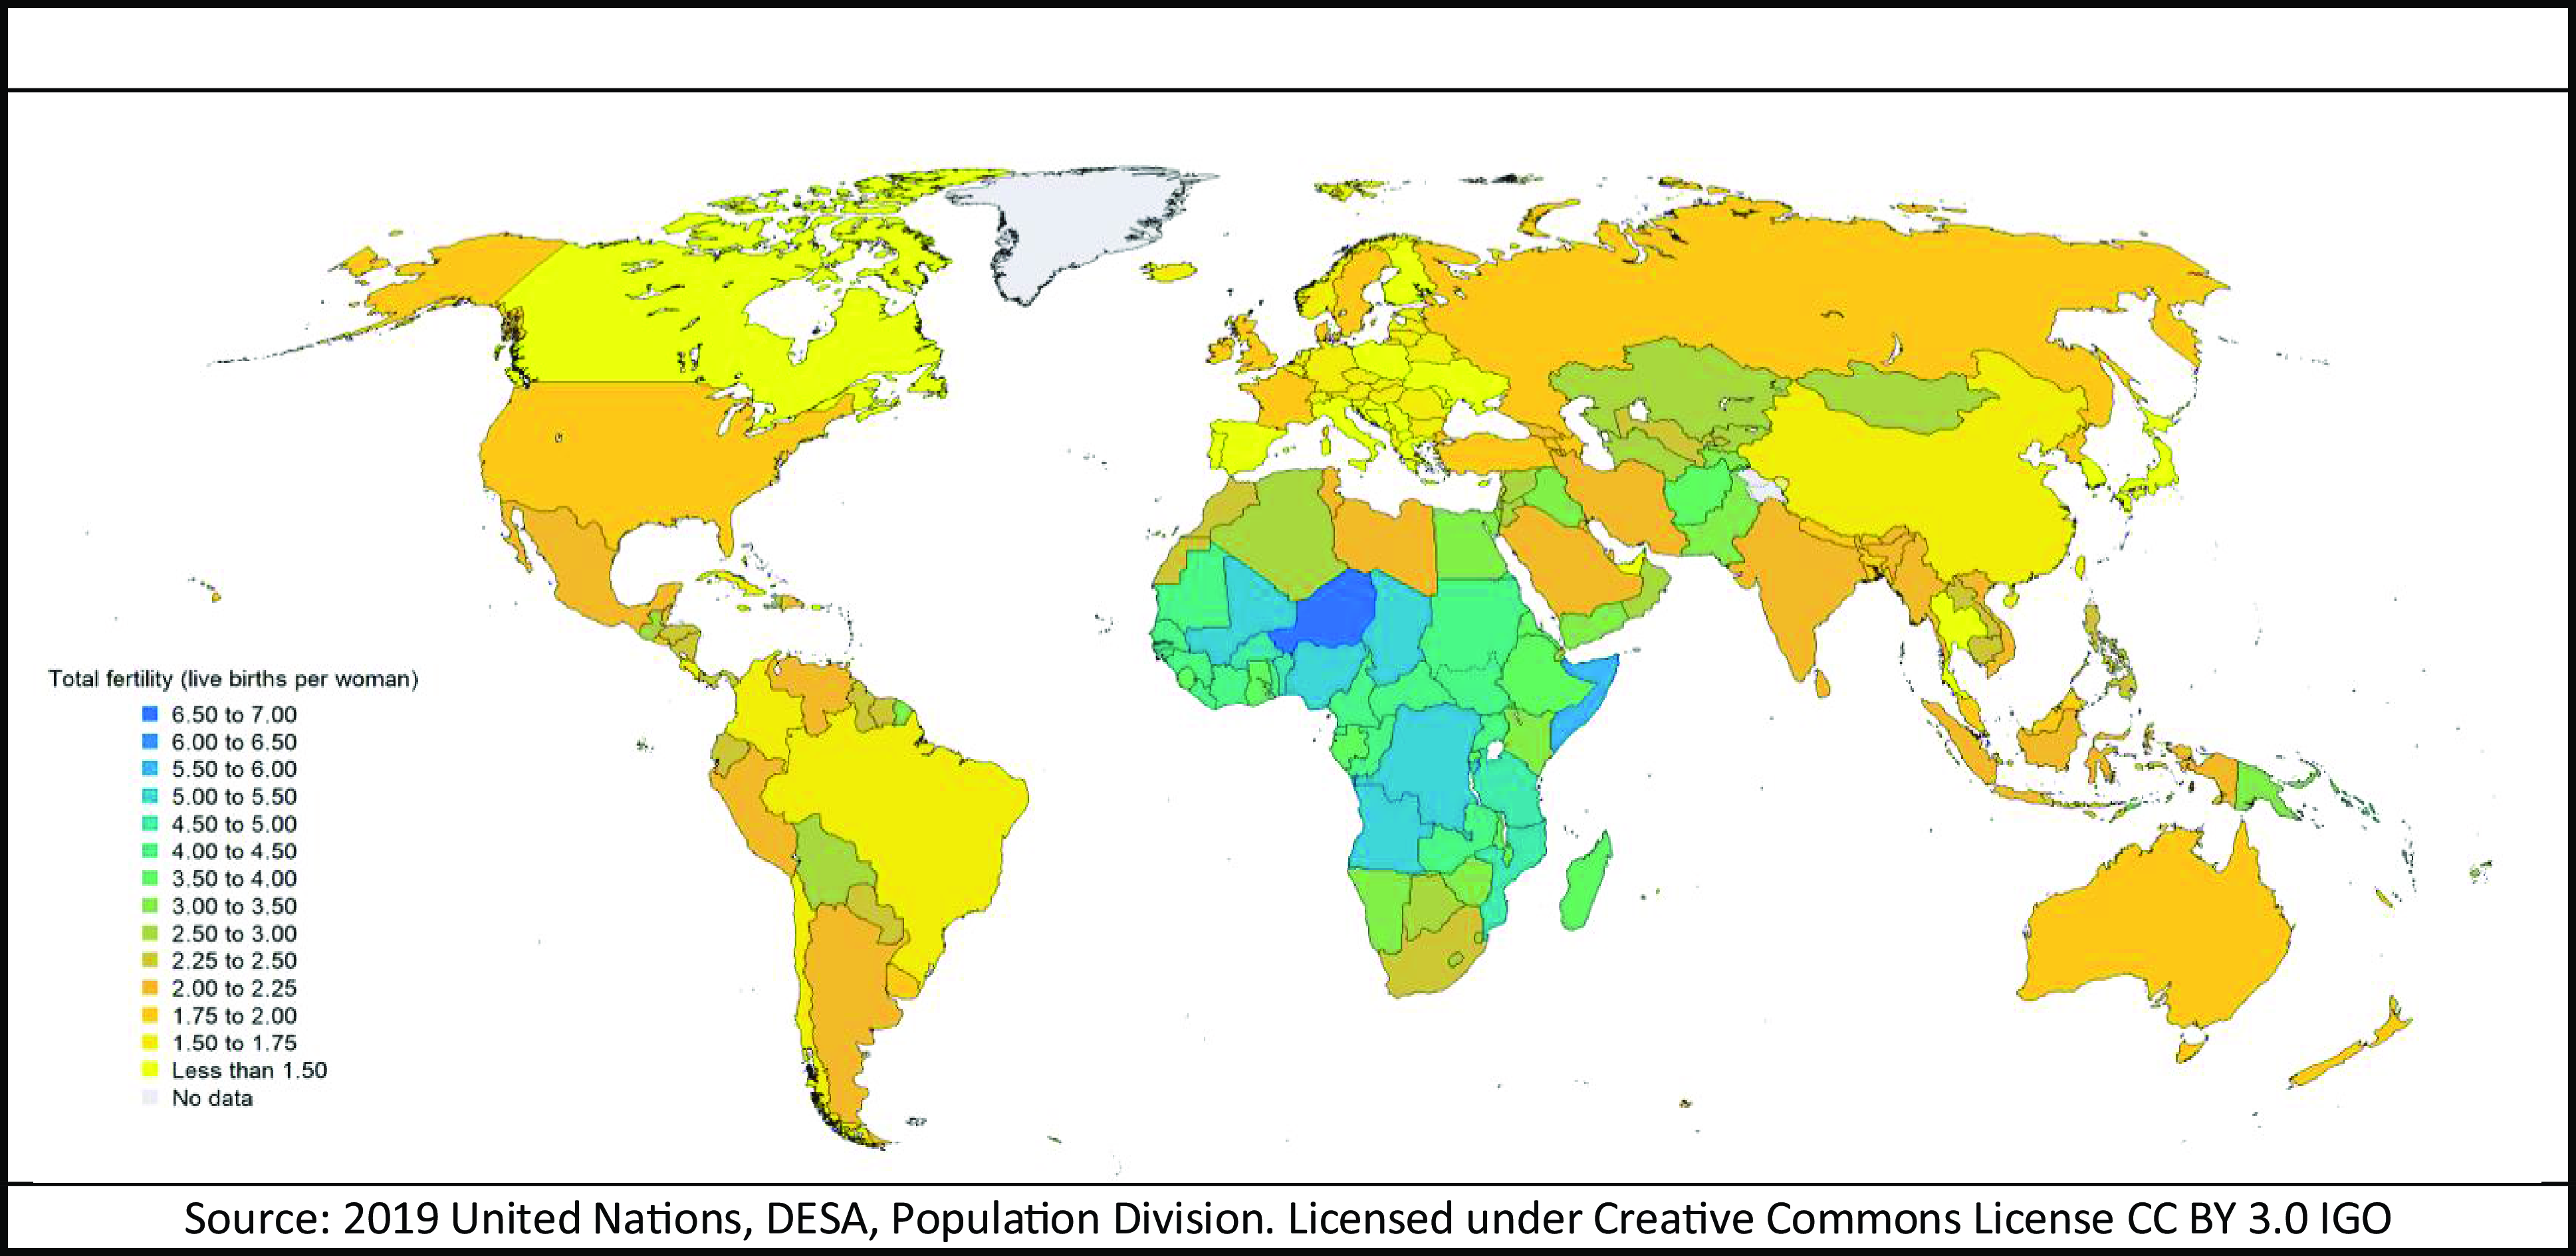
Figure 2. Total fertility rates by country – 2020–2025 (median-variant projection).
Corresponding patterns have arisen with respect to the mother’s average age at birth of her first child (tempo effect). In most countries, this has increased. For example, in the United States, the average age of a mother at first birth increased from age 25.4 years in 2010 to 27.0 years in 2019, with average age for all births increasing from 27.7 in 2010 to 29.1 in 2019 (Martin et al., Reference Martin, Hamilton, Osterman and Driscoll2021).
2.2 The Demographic Transition
Fertility and mortality trajectories have driven the demographic transition, during which a given population moves from a high fertility/high mortality state to a low fertility/low mortality state. The Demographic Transition broadly consists of three phases:
-
1. An initial high fertility and high mortality pre-transition phase, where births are many and life is short. Population growth is slow or non-existent, and the population is young.
-
2. A transition phase of improved healthcare and public health, high fertility, and falling mortality, resulting in a young fast-growing population. Given the right political and social conditions the economy can grow, as there are many workers with a limited number of dependent elderly people to look after (the demographic dividend).
-
3. A post-transition phase with falling or low fertility rates and decreasing or low mortality rates. This phase leads to an ageing and ultimately declining population size, with fertility below the replacement rate. It is characterised by relatively few children and more elderly people.
As Aditya Romansa (Reference Romansa2021) stated “[T]he fertility transition is one of the most profound changes to human living conditions, as the number of children per woman declined from five or more to around two or less … both in the western industrialised world and in many developing countries”.
More recently, a “second demographic transition” theory has tried to explain the continuing low, and at times even very low, levels of fertility in the more developed countries, as well as in many less developed ones. This theory describes the cultural values and behaviours that can lead to a permanently low fertility rate (van de Kaa, Reference van de Kaa2002; Sobotka, Reference Sobotka2008): a focus on self-fulfilment, personal autonomy and development, increased economic aspirations, and a modern lifestyle. These cultural changes represent a conflict between employment and motherhood, a change in the nature and postponement of marriage/partnership and parenthood, and an increase in out-of-wedlock births.
2.3 Factors that Influence Fertility Rates
Fertility can be affected by multiple biological, behavioural, economic, social, cultural, and political factors, with complex interactions. The impact of these factors can vary over time, location, and population group. There is a wide range of factors that are important to consider when setting assumptions and modelling future fertility rates, and these often interact. Therefore, when projecting fertility rates, it is important to consider historical and expected changes in applicable factors. For example, when projecting marriage’s impact on fertility, one should at the same time consider other factors, including cohabitation rates, cultural attitudes towards bearing children, and the expected status of the economy.
The following sections describe factors which are important to consider when projecting fertility. The factors included are not exhaustive. However, they represent the key determinants and drivers of fertility.
2.3.1 Proximate determinants of fertility
Figure 3 provides an overview of factors affecting changes in fertility – proximate and environmental determinants (Bongaarts, Reference Bongaarts1978). The proximate determinants in the ring directly affect fertility, and they are impacted by environmental influences, such as the economic and cultural factors affecting the actions of individuals and society, which can have significant effects on fertility.
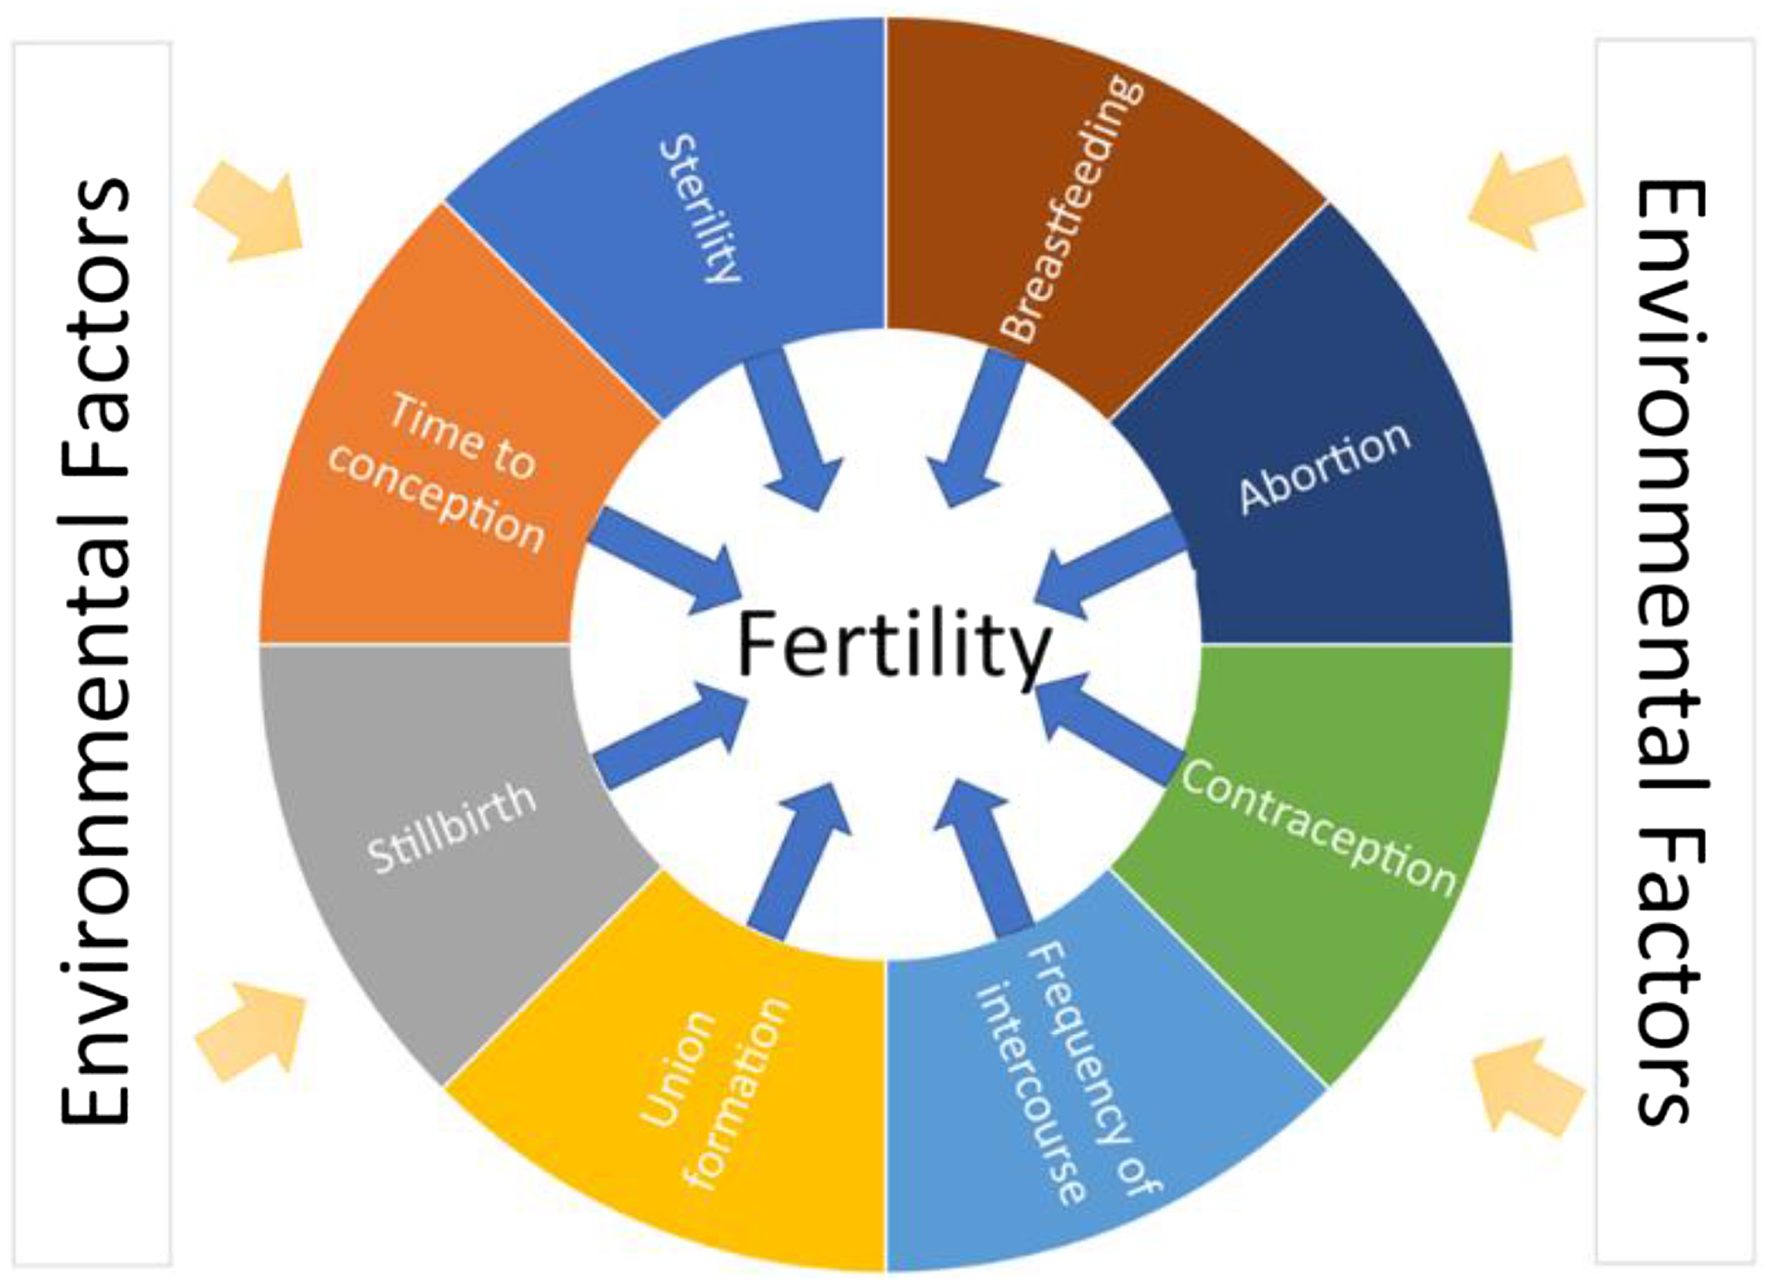
Figure 3. Factors affecting changes in fertility. Source: Bongaarts (1978).
Proximate determinants that directly affect fertility rates and cause them to vary across time and location, can be divided into three types of factors representing exposure, deliberate fertility control, and natural fertility. The exposure measure is union formation, whether marriage or cohabitation, and frequency of intercourse. Deliberate fertility control includes contraception and abortion; while the natural fertility factors are lactational (breastfeeding), sterility, spontaneous intrauterine mortality (stillbirth), and the time to conception and duration of the fertility period.
2.3.1.1 Union formation
Marital patterns are important in the fertility of many societies. Although childbearing has never been limited to within marriage or formal cohabitation, there is a correlation between having children and being within some form of committed union. There is considerable variation in the rate of marriage and percentage of babies outside of marriage (from 2% to more than 80%), as well as an increasing rate of single parenthood. Low levels of and increased age at union formation are likely to keep fertility rates at low levels, or even reduce them further, as demonstrated by Figure 4.

Figure 4. TFR and share living alone by age group and gender, Finland, 1990–2019.
Divorce can also influence fertility rates, in both directions. As divorce ends a marriage, it can reduce marital and overall fertility. On the other hand, if the woman forms another union, she may go on to have more children than she would have in the previous union.
As women’s rights are enhanced, their fertility decisions can speed up the demographic transition in some areas. For example, availability of concealable contraceptives has increased women’s power over fertility, while also having detrimental consequences for their marriage (Ashraf et al., Reference Ashraf, Field and Lee2014). Similarly, additional education of and employment opportunities for women may affect the distribution of the childrearing burden between the partners; and there is a close empirical link between women’s high childcare burden and low fertility rates (Doepke & Kindermann, Reference Doepke and Kindermann2019).
Many couples no longer have children out of duty to the family, the State, or God. Rather, they have one or more children because they want to have children, as that fulfils their relationships and their sense of self. Getting married and having a first child at an older age becomes the norm, as has having only one or two children.
2.3.1.2 Deliberate fertility control
Couples now have more control over the number and timing of their children, provided they have access to family planning and available technologies (including sex education, natural family planning based on women’s fertile periods, abstinence, withdrawal, contraceptives such as condoms and contraceptive pills/the morning-after pill), and long-acting reversible contraception (LARC) such as intrauterine devices (IUDs) and implants. Other fertility-reducing methods include abortion and sterilisation; in India, for example, sterilisation of women has been the main contraceptive method used.
The relative availability, acceptability, and usage of these technologies are among the reasons for differences in fertility across time and location. The use of fertility control methods increased over the past 50 years in most countries although, for cultural, religious, legal, and other reasons, the type of technique used has differed. The availability of contraceptives has led to a dramatic increase in their use and increased women’s power over fertility. Nevertheless, in some countries, fertility remains high because women do not yet know how to manage family size through family planning and contraception use.
On the other hand, many couples and individuals are unable to conceive, and seek help. A fertility industry has developed for the one in six people worldwide who experiences infertility. Certain medical technologies can reduce the incidence of infertility, treat other fertility-reducing ailments, and enable couples to conceive either naturally or through artificial reproductive techniques. The ability to freeze and unfreeze eggs and sperm is now available, enabling future births, for example, when one of the parents has already passed away. The percentage of all births from these techniques is still small, globally less than 1% (Adamson et al., Reference Adamson, de Mouzon, Chambers, Zegers-Hochschild, Ishihara, Banker, Dyer and Kupka2017), while in the United States, they constituted 2.24% of live births in 2019 (CDC, 2022).
The number of countries that provide direct government support for family planning and population management increased from 95 in 1976 to 160 in 2013 (De Silva & Tenreyro, Reference De Silva and Tenreyro2017). The approaches taken can differ dramatically, ranging from providing more education for girls and sex education in schools, to providing a range of contraceptive methods or even limiting the number of children in a family as with China’s former “one child” policy.
2.3.1.3 Natural fertility factors
The natural fertility factors of lactational (breastfeeding) infecundity, sterility, spontaneous intrauterine mortality (stillbirths), and the duration of the fertility period, can have a significant impact on fertility rates.
Breastfeeding women tend to have a longer period of infertility following delivery than women who do not breastfeed, because ovulation is reduced shortly after birth. The length of this infertile period varies depending on factors such as maternal age and parity, and the duration and frequency of breastfeeding. In general, the more frequent and the longer the episodes of breastfeeding, the longer the period of infertility (Chao, Reference Chao1987).
Biological barriers to bearing children have always existed for both females and males, increasing at older ages. Although a great deal of attention has been directed at females, infertility issues also affect males. For example, average sperm count may have declined on a global basis (Levine et al., Reference Levine, Jorgensen, Martino-Andrade, Mendiola, Weksler-Derri, Mindlis, Pinotti and Swan2017) and surveys have suggested that the rate of sexual activity has decreased.
Sterility can be either primary, when someone who has never conceived a child is having difficulty conceiving; or secondary, when someone who has already conceived at least one child is having difficulty conceiving again. Primary sterility affects about 2% of women aged 20 to 44 years, and secondary sterility about 10.5% (Mascarenhas et al., Reference Mascarenhas, Flaxman, Boerma, Vanderpoel and Stevens2012).
Stillbirths can have a small but significant impact on fertility rates, especially when these are already low. In England and Wales, the rate of stillbirths has fallen from around 7 per thousand live births in 1980 to around 4 per thousand in 2021 (ONS, 2021), while sub-Saharan and other less developed countries have significantly higher rates of stillbirth (Hug et al., Reference Hug, You, Blencowe, Mishra, Wang, Fix, Wakefield, Moran, Gaigbe-Togbe, Suzuki, Blau, Cousens, Creanga, Croft, Hill, Joseph, Maswime, McClure, Pattinson, Pedersen, Smith, Zeitlin and Alkema2021).
The duration of the female fertility period is usually assumed to be between ages 14 and 49 years and is fairly constant across time and locations. However, fertility varies within this age range, and begins to fall from about the age of 30 years onwards. The fertile period can be extended using technology such as in vitro fertilisation, although currently with an insignificant impact on total fertility rates.
2.3.2 Environmental determinants of fertility
The environmental determinants of fertility include all the environmental, economic, social, and cultural factors that indirectly affect fertility, by changing the proximate determinants and their impact. For example, periods of economic crises can slow down union formation, or increase the use of contraception.
2.3.2.1 Education of females
As access of females to education increased, their participation in the labour force surged, and consequently birth rates fell, both for those who were married and those who were not. Greater income with more education, imply that higher income loss and reduced career opportunities are associated with childbearing, thus increasing the tendency to delay marriage and childbearing. More educated women also have greater access to, and more effective use, of contraceptives; this is illustrated by the larger gap between their intended and realised fertility rates. In addition, the more years in school, the fewer teenage births due to delayed union formation (Kim, Reference Kim2016).
Further, educated parents tend to have fewer children, possibly because they assign greater value to the quality of their children’s education, and feel it better to invest all their resources into one “golden” child, than to the number (quantity) of children. Figure 5 shows a high correlation between TFRs and the years of educational attainment of women of reproductive age in selected countries.

Figure 5. Female schooling and fertility in selected countries, 2010.
However, this is not always the case. In the United States, for example, the fertility rate of Generation-X college-educated women has increased faster than that of their less well-educated peers – driven by an increasing proportion of those with two children having a third, with a decline in childlessness being sharpest among the most educated women (Pew Research Center, 2015). This, as Zang (Reference Zang2019) noted, marks a shift from the experience of their Baby Boom predecessors.
2.3.2.2 Labour force participation of females
Similar to how increased female access to education can reduce fertility rates, increased female labour force participation and career and job aspirations can affect fertility rates. Many women in lower-fertility countries are highly educated and do not wish to spend their productive ages solely as housewives caring for their children. Indeed, the opportunity cost of mothers’ time continues to play a central role in both the quantum and tempo of fertility.
Due to the discrimination against female participation in the paid labour force, and their role as mothers, women have not earned, on average, as much as correspondingly situated men. To compensate for the market-based cost of childcare, additional financial incentives may be needed to increase female labour force participation and increase the number of children, such as availability of parental leave, childcare, changes in how male partners engage in childrearing, and support for part-time work.
2.3.2.3 Economic factors
Economic theory suggests that the desire by parents for children is influenced by the expected costs including foregone income of raising them, and the expected benefits such as supporting the parents’ old age and contributing to the family income (in rural areas, developing countries, and low socio-economic levels). The cost of maintaining children taken as a ratio to income can seem large to many. This cost also increases perceived financial and personal risks, with many couples not wanting to take on those risks, especially where the economic situation is uncertain, unstable, or bleak.
As economies grow richer and more urban, and with the decline in children’s mortality, children cease being assets, and instead they can become an economic drain on a family’s finances and resources. As a result, the economic view of children has tended to change – from a benefit (an asset) to a cost (a liability). These expectations of the cost affect the fertility rate, as the speed of the change in the assessment of the value of children can be a key determinant of the size of the future global population.
In a study of World Fertility Surveys and of Demographic and Health Surveys covering low and middle-income countries, Chatterjee and Vogl (Reference Chatterjee and Vogl2018) found a positive correlation between long-term economic growth, and a faster decline in childbearing and increases in birth spacing, raising the return to each child investment (quality). Figure 1 demonstrates this by the United Nations SDG (Sustained Development Goals) regions, whereby as countries got richer their fertility rates fell, and more developed regions have lower fertility rates than less developed regions. To the extent that we expect countries, especially less developed ones, to continue to develop, we can expect fertility rates to continue to decline. As stated in 1974 by India’s minister of population, Karan Singh: “Development is the best contraceptive.”
2.3.2.4 Government policies
Government policies to encourage or discourage more children may be the primary external attempts to change fertility trajectories, as shown in Figure 6, with greater, or more often lesser success. Historically, attempts to increase population have included Russia and France after World War II, Israel after its War of Independence in 1948–49, and most of the developed world today. Other countries have imposed fertility-reducing regimes, for example, China’s one-child policy and India’s 1970 sterilisation campaign.

Figure 6. Policies to influence fertility level 2015–19 by number of countries in region.
More recent policies have focused on providing help to women in raising infants and young children with family-friendly policies, such as child or family allowances, free or subsidised childcare and day care, early education, parental leave with job security, flexible or part-time work hours for parents, and tax credits. In addition, discounts on public services, free in vitro fertilisation treatment cycles, housing stipends, additional monthly income, and cash bonuses have been provided by some countries. However, their effects so far have mostly been relatively small and short-lived, primarily encouraging people to have babies earlier than they would otherwise (a tempo effect), as families’ views about the ideal or desired family size generally have not changed much in these countries.
Figure 6 shows that there have been numerous countries that have implemented policies aimed at either decreasing fertility rates (especially in Africa and Oceania), or at increasing fertility rates (especially in Europe).
According to the United Nations (World Population Policies, 2021): “While various approaches and initiatives to lower fertility have shown results globally, reversing the long-term downward trends in total fertility that are the outcome of social, economic, and cultural transformations, has proven to be much more difficult … there is a lack of evidence that these increases are stable and long term, and not merely a reaction by couples to take advantage of incentives provided by advancing the birth of their next child without increasing their ultimate family size.”
2.3.2.5 Migration
Immigration can support the needs of a domestic population whose fertility has not produced an adequate supply of workers, whether seasonal farm labourers or university faculty, and ultimately may be the only way to keep the country’s population from shrinking. The impact of immigration on fertility rates will depend on the level of fertility in the country the immigrants are coming from, as well as the level of fertility in the host country. At the same time, it can also cause a backlash by affecting the cultural, societal, legal, political, and even religious nature of the host country.
The fertility of immigrants will depend on their age, sex, and family status when they migrated, and whether they move as part of a family unit, for family reunification, or as individuals. Usually, after one or two generations, the fertility behaviour of immigrants tends to converge to that of the native-born, as descendants of immigrants adopt the behaviour and attitudes of the new society (Alderotti & Trapplini, Reference Alderotti and Trappolini2021). However, this does not always happen or may occur slowly, particularly if the immigrant community is isolated from the rest of the population.
Germany experienced a migration-based fertility boost in the 2010s from an influx of Syrian and other immigrants with larger families than the native born population. In contrast, south European immigration came primarily from low-fertility countries, such as Romania and Albania, which did not result in a fertility increase.
As Figure 7 shows, the TFR trajectory of immigrants to the United States follows the trend of the native-born, with the change of fertility rate among the immigrants being faster than that of the native-born.

Figure 7. TFR of US immigrants and native-born: 2008–2018.
2.3.2.6 Mortality
Demographic transition theory associates falls in mortality rates with lagged falls in fertility rates (Soares, Reference Soares2005). As mortality falls, especially for infants and children, parents no longer need as many surviving children to ensure the family’s financial survival. As a higher proportion survive, it becomes more economically appealing to have fewer children. Further, a gain in adult longevity increases the time horizon over which a family benefits from investments in its human capital, thus decreasing the need for additional children.
In countries where mortality rates are already quite low, there may no longer be much of an impact of further reductions on fertility rates. But in countries with higher mortality rates, particularly at young ages, fertility may fall further if mortality rates can be brought down.
2.3.2.7 Teenage fertility
The fertility rates of adolescents (ages 15–19) have steadily decreased in many countries, from a worldwide aggregate rate of about 86 per thousand girls in this age group in 1960 to about 42 per thousand in 2018 (World Bank, 2021). The decline in teenage births has been attributed to many factors. In some countries, there has been a reduced level of sexual activity at those ages, while in others the decline is partly due to a change in culture, or an increase in educational and career possibilities for women.
Whatever the cause, teenage births can lead to adverse economic and personal outcomes for both the mother and child, with the child often being raised by a grandparent. These mothers tend to be less likely to seek prenatal care, with many of their babies having lower birth weights and learning problems. Such births can also derail the mothers’ education and job opportunities.
The US experience since the Baby Boom is presented in Figure 8 and is characteristic of current trends in developed countries, particularly among Generation X (born circa 1965–1980), Millennials (circa 1981–1996), and Generation Z (circa 1997–2012) youths. Teen pregnancies fell by 80% over the last 20 years to a level of fewer than 30 births per 1,000 adolescent girls aged 15–19, as they stay less together due to social media and thus have less sex, are more informed about safe sex, use more contraceptives, and are less assured about their future, and therefore tend to delay childbearing (Hall, Reference Hall2021).

Figure 8. US teen birth rates, 1950–2020.
Despite the overall downward trend in teenage pregnancies, there have been exceptions such as in certain Sub-Saharan African and Latin American countries. In 2015–2020, 34 countries had at least 80 births per 1,000 adolescent girls aged 15–19, of which 29 countries were in Africa, 4 in Latin America and the Caribbean, and 1 in Asia.
2.3.2.8 Culture and religion
Culture and religion can be significant drivers of fertility, both upwards and downwards. Within culture, one can include religious and societal attitudes and norms, including community expectations. Cultural factors can play a significant role in the number of children a woman has and encourage higher or lower fertility rates.
These factors are often related to the expected role of women in the family, community, and wider society. They include norms regarding the perceived optimum number of children to have or the number of wives a man may have. Mothers have traditionally spent more time in child raising than fathers, although this has been gradually changing in some countries. These factors are mutable and have differed across time and space, but can be difficult to change. It may take a generation or more for behaviours and institutions to settle into a stable pattern.
The rules and practices of the many religions of the world regarding procreation also differ. In some cases, religions have encouraged childbearing as a sign of trust in God’s providence and a desire to populate heaven. However, in many cases, those who belong to a particular religion ignore their religion’s teachings, at least in this regard. This is the case with traditionally Catholic-dominated countries, such as Spain, Italy, and Poland, which today have some of the lowest fertility rates in the world.
Nevertheless, some ultra-religious communities have much higher fertility rates than those around them. Depending on the size of these communities, their birth outcomes can affect overall national experience. According to Israel’s Central Bureau of Statistics, the country’s TFR was 3.16 in 2017–19, but the TFR was 6.56 for Ultra-Orthodox Jews and only 2.05 for those who are non-religious. It is projected that the Israeli Ultra-Orthodox, who were 11% of the population in 2015, will reach 20% in 2040 and 32% in 2065, thus changing the culture, nature, and economic and security environment of the country.
Due to the spread of social media, cultural and behavioural aspects are becoming effectively universal and can differ from prior generations. Developed world practices are well known in developing countries and thus may result in a faster decline in fertility in some of the currently higher-fertility countries. For these reasons, when projecting fertility rates, it is important to consider how cultural, behavioural, and religious norms may change and affect future fertility decisions and avoid simplistic assumptions about how specific cultural or religious groups may behave.
2.3.2.9 Urban and rural differences
The context of reproductive decision-making can be different for rural and urban inhabitants in both developed and developing countries. Fertility is usually greater in rural than in urban areas, and greater for those who live on a farm than for rural non-farm inhabitants, even though it has fallen rapidly in both. In many poorer, largely rural areas, women still face pressure to marry early and have children who will help with farming and family, or due to community and husband’s expectations.
Although urbanisation has placed downward pressure on fertility rates, in a study of 57 developing countries, increased urbanisation only contributed to 14% of the overall fertility decline (De Silva & Tenreyro, Reference De Silva and Tenreyro2017). In each of the 83 developing countries studied, rural fertility was greater than that of urban fertility (except in the poorest urban slums), with an average difference of 1.5 children per woman (Martine et al., Reference Martine, Alves and Cavenaghi2013). This difference was especially large in sub-Saharan Africa where the fertility of rural populations in several countries has not yet experienced any decline.
The gap between urban and rural fertility, driven by the greater financial and opportunity costs of childrearing in urban areas, as well as smaller living quarters, is related to such factors as differences in wages, education, female job opportunities and paid labour force participation, socio-economic mobility in industrial and service employment, and efficiency in the delivery of family planning. This difference is quite important because movement towards urban areas is universal, with two-thirds of the global population living in cities in the next several decades.
Migration between rural and urban areas, if significant, should be considered when projecting a country’s future fertility rates.
2.4 Impact of economic recessions, pandemics, and other crises
Significant economic recessions, pandemics, and other crises have been associated with decreases in fertility rates. In some cases, these decreases have been small or temporary, followed shortly after by a rebound, possibly reflecting deferred fertility. Others were permanent or significant. The actual pattern can depend on the length and severity of the event, and its effect on different population subgroups. A well-known case was World War II, which in many countries was followed by a baby boom that lasted from a few years to several decades.
During turmoil, uncertainty about employment, personal finances, and the future, couples may conclude that, at least during the crisis period, the expected costs and resources needed to raise children, including the cost of housing, are too much to manage. Although uncertainty is a key determinant of both the quantum and tempo of fertility, during such periods it can particularly influence the timing of becoming pregnant. Women have more children when they feel economically secure.
After the financial crisis in 2007–2008, it was anticipated in several countries that, following several years of fewer births, fertility would rebound with the economic recovery. However, that did not occur in countries such as the United States, where fertility continued to decline, especially among teenagers, unmarried women, Hispanics, and those with advanced college degrees. In addition, unplanned pregnancies particularly decreased as couples were more cautious in their sexual practices.
Schaller et al. (Reference Schaller, Fishback and Marquardt2020) studied the effects of 13 US recessions that occurred between the Great Depression and 2016. An analysis by county of real per capita income indicated that a 1 percentage point increase in the income growth rate was associated with about a 0.13 percentage point increase in fertility in the following year, confirming the procyclicality of fertility. This analysis also showed that a recession can affect future birth rates for at least four years after a shock, followed by a small rebound after year six. This effect was smaller in the most recent 25-year period, in which women had greater educational and job opportunities than in earlier periods.
Changes in birth rates have generally tracked pandemics. During the Spanish Flu of 1918–1919, US birth rates dropped 10% over 9 to 10 months following the peak in excess deaths. Afterwards, American mothers did not “make up” for the previous fertility decline by having more children. Rather, the pandemic had a permanent effect on American family size, with many having fewer children than they would otherwise have had (Chandra et al., Reference Chandra, Christensen, Mamelund and Paneth2018).
The COVID-19 pandemic followed that pattern, where a short baby bust occurred in several countries. However, fertility experience quickly returned in 2021 to pre-COVID-19 levels in most countries (United Nations Fund for Population Activities, 2021). In contrast, a few countries, including several Scandinavian nations and Switzerland, saw increases in birth rates, as strong social safety nets, especially parental leave, an increase in teleworking, and previously low fertility, may have offset some of the associated uncertainties and lowered the expected opportunity cost associated with having children.
The effects of a crisis on fertility can differ significantly by country due to such factors as socio-economic and sociodemographic profiles, the extent of control over pregnancy, and the severity of the crisis on mortality, morbidity, unemployment, and the economy in general.
3. Modelling Fertility
3.1 Methodologies, Models, and Scenarios of Fertility
Most studies of fertility assess patterns over time for a particular population, compare patterns between populations or over time periods, or project future fertility and resulting population developments, in response to a range of socio-economic, sociodemographic, behavioural, geographic, and other factors. As patterns of fertility over time constitute a longitudinal time series, the study of fertility is amenable to statistical, mathematical, and probabilistic analyses. The study of historical experience and its underlying drivers, such as those discussed in Chapter 2, can provide insights into the development of models and derivation of assumptions.
The resulting models may be used to project future fertility and its population consequences, be of interest to demographers, actuaries, economists, public health officials, and other decision-makers, and be the basis for public policymaking. For example, a country that has a TFR well below the replacement rate, like many European and East Asian countries today, may face future population and economic decline (e.g. due to a smaller workforce, tax revenues, and economic growth), as well as increased social outlays to an ageing population.
Analysis of fertility mainly focuses on two of its components:
-
quantum aspects, usually measured by the TFR.
-
tempo effects, reflecting the breakdown of the TFR into age-specific fertility rates.
Although quantum is often a primary focus, tempo can also be important and should not be ignored. For example, a delay in tempo can increase the generational period length and thus the old-age dependency ratio, and time between generations and mothers’ ages at birth can significantly affect long-range social security projections and costs.
Changes in birth expectations and desired family size have been used as early warning indicators of changes in future fertility rates. However, these expectations can change more gradually than actual period fertility. Beaujouan and Berghamer (Reference Beaujouan and Berghamer2019), in a study of the US and 19 European countries, found an average difference per country of 0.3 to 0.5 births per woman between birth expectations and actual (parity) births, the so-called intentions–fertility gap, indicating that birth expectations are usually greater than subsequent fertility experience. These gaps have tended to be larger for more highly educated women in most of the countries studied.
The sex ratio, the ratio of boys to girls in a birth cohort, can be an important component of some population projections, particularly relevant in the determination of future births and the number of females, marriages, and future deaths, due to the difference in mortality rates between the sexes. In many countries, the sex ratio at birth around the year 2019 was between 97% and 103%, with a global ratio of 101.7% (United Nations, 2019). Some countries, mainly in South and East Asia, as well as some Middle Eastern countries, have a much larger sex ratio because of gender bias and sex selection (e.g. by female infanticide or sex-selective abortion). In India, for example, the sex ratio began to surge in the 1970s with the introduction of prenatal ultrasound testing and legalised abortions, but this imbalance has shrunk due to a massive campaign to discourage sex-selective abortions. China, for example, now has 17.5 million more men between ages 20 and 40 years than women.
A major concern for all fertility studies is the availability of detailed, reliable, and high-quality data. Data may include fertility indicators such as gender and socio-economic characteristics of households by period, cohort, and parity, as well as the number of females by age and period. They are primarily derived from public records and surveys, including:
-
National statistical agencies and registries, often supplemented by surveys. For example, the Demographic and Health Surveys agency (DHS, funded by USAID, at https://dhsprogram.com/) collects, analyses, and disseminates population data from more than 400 surveys in over 90 countries.
-
Multinational databases, for example, the Human Fertility Database (https://www.humanfertility.org/cgi-bin/data_short.php) and the US Census Bureau International Database (https://www.census.gov/programs-surveys/international-programs/about/idb.html).
-
Other organisations develop and publish fertility-related data for entire populations or specific population segments, often derived from national statistical agencies or surveys, such as the OECD, the World Bank, and the United Nations Department of Economic and Social Affairs Population Division (https://www.un.org/en/development/desa/population/publications/dataset/fertility/total-fertility.asp).
Although data from these sources for developed countries are normally reliable, this is not always the case for less developed countries. Even when reliable data is available, it may be just for a limited number of countries, years, population segments, periods, and other variables of interest, particularly for pre-1950 data. Countries may also use different definitions of data elements, especially for older data, and have differing levels of reporting completion, resulting in inconsistencies between data sources. These constraints can limit in-depth long-term historical fertility analyses and comparisons between different populations and periods, and force long-term projections to the use of ratios and correlations with relevant reliable data. The reliability of resulting long-term fertility and population projections, as well as conclusions drawn from them, may then warrant caution and proper disclosure to users of the information.
As levels, patterns, quantum, and tempo of fertility can significantly differ between population groups, and the mix of population segments can change over time, it may be appropriate – where data is available – to carefully consider the characteristics of the studied population segments used in the modelling process. For example, it may be appropriate to recognise and balance the experience of segments such as rural and urban, level of education or years of schooling, married and unmarried, religious and secular, or ethnic/racial or socio-economic groups.
While modelling fertility is almost always based on a woman’s age, many variables and factors are usually involved in estimating fertility, are correlated with fertility, or are related to the quantum or tempo of fertility. Consequently, the selection of assumptions, variables, population segments, time periods, trends and discontinuities, functional forms and relationships, other parameters, and the expected use of the findings, can have major impacts on the analysis and validity of the projections. In all cases, judgement and expert scrutiny are needed throughout the modelling process. Note that projected fertility rates, outcomes, and trends are not necessarily indicative of the future, as changes in conditions, interrelations, discontinuities, and inflection points can be difficult to discern.
A general approach to forecasting fertility is the following:
-
Identify and analyse historical and current data, either in the form of age-specific rates or period TFRs.
-
Select a set of individual age fertility rates or TFRs to be achieved at an “ultimate” period, possibly 10 or 15 years in the future.
-
Develop a method of transition from the current level(s) to the selected ultimate level. This can be determined by interpolation or curve fitting between the current and ultimate rates. This transition does not have to be monotonically decreasing or increasing, as waves or cycles might be expected.
-
Depending upon whether fertility rates or TFRs are used in these steps, the other metrics can be calculated.
Factors to consider in the modelling process include:
-
Trends and cycles in fertility experience may occur in response to external events, such as extensive wartime effects (see the effects of the Great Depression and post-World War II baby boom in the United States in Figures 9 and 10). In some cases, they should be ignored, for example, when observed from an appropriately selected period, such as the prior decade or a related average period. In other cases, to balance a wave in experience, rates or TFRs of an entire fertility cycle for a similar population might be used.
-
Blindly relying on historical averages or average trends, without adjusting for the effects of current or expected future conditions including changes in the drivers discussed in Chapter 2 and biological limits, may produce biased estimates.
-
A projection can start with tempo effects, such as age-specific (reflected in single, quinquennial, or decennial age groupings of) fertility rates, followed by a development of TFR or CFR estimates from the age-based rates.
-
Forecasts of fertility experience of sub-populations can be developed and then aggregated. For example, the US Census Bureau has separately projected several ethnic/racial categories that were deemed to have significantly different experience or trends and then taken their sum to develop national projections.

Figure 9. US historical TFRs Office of the Chief Actuary, 2023.

Figure 10. Central birth rate versus year in the United States Office of the Chief Actuary, 2023.
Other sets of assumptions can also be used; for example, estimates can be developed by using parity assumptions. However, such models can add complexity and uncertainty, such as required estimates of first births, and transition probabilities to subsequent children. Alternatively, estimates may consider rates of marriage, divorce, and marital status-based fertility rates. As indicated by (Brown and Norville, Reference Brown and Norville2001), such complex models add “several places where errors could be made with respect to assumptions about future states, thus potentially decreasing the accuracy of the estimates”. Nevertheless, these alternative models can serve as useful reasonability checks.
Due to space limitations, important modelling issues are not thoroughly explored here. These include the use of socio-economic and sociodemographic variables, further exploration of differences in patterns and trends between developed and less developed countries or regions within countries, the basis for the speed of demographic and fertility changes, reasons for fertility cycles over generations, effects of economic, environmental, and pandemic calamities, and quantitative analysis of the impacts of the drivers of fertility discussed in Chapter 2.
3.1.1 Period, cohort, and age-specific measures
A key framework characteristic of a fertility study is whether the key metric used should be based on period or cohort measures. Almost all fertility studies are based on the mother’s age, as the father’s age may not be available, or be of questionable accuracy and relevance. Figure 11 summarises the key differences between these two alternative measures of fertility.

Figure 11. Comparison of period and cohort measures.
Advantages of using CFRs include:
-
provide a truer measure of ultimate fertility.
-
more accurately identify the underlying fertility of a generation and compare fertility between birth cohorts.
-
are not affected by changes in tempo, or by patterns of births of mothers.
-
avoid potential misleading trends in period reporting.
Advantages of using period TFRs include:
-
provide timelier information.
-
may better relate to period-related economic and sociological changes.
-
may serve as a more useful basis for early warning of changes, although they need careful assessment, as a change could reflect either deferred or forgone fertility.
Age-specific fertility rates are used to convert from period TFRs or cohort CFRs to population projections. In almost all cases, tempo consists of age-specific rates corresponding to an inverted-U pattern, increasing from the earliest age at which females can give birth, possibly the age of 12 or 14 years, to a peak at some point in a female’s 20s or 30s, then decreasing, often ending around the age of 49 years. Figure 12 shows a hypothetical pattern of quinquennial age rates, more commonly available than individual age rates in many countries.

Figure 12. Hypothetical age-specific annual fertility rates (per 1,000 women).
As individual age rates are sometimes preferable, a curve can be fitted to develop individual age rates from quinquennial age group data. A parametric formula can approximate these rates, while the shape of this curve and its degree of symmetry can change over time as expected tempo evolves. Alternatively, age-specific annual rates can be estimated or projected through many approaches, including completion of rates not yet experienced, separate estimation of quantum values and changes in tempo, or expert opinion. These may be developed by considering the underlying drivers and factors discussed in Chapter 2 or by observing patterns from applicable populations, other population segments, geographical areas, historical periods, or other leading indicators.
3.1.2 Tempo and parity effects
Historically, age-related fertility rate patterns have usually been characterised as “heavy left tail distributions,” with higher rates for those in their late teen and early twenties. Recently, with changes in fertility tempos in many countries, the fertility rates for younger females have decreased and those for older females have increased. Thus, the age distribution has shifted to a heavier right-tail distribution, accompanied by an increase in average age at birth. These tempo effect shifts, attributable to the factors described in Chapter 2, have sometimes caused trends in period TFRs to be misleading indicators of underlying fertility rate trends, making it more difficult to discern whether a change in a period TFR is due to a shift in quantum or tempo, thus requiring extensive analysis of drivers and birth expectations to supplement quantitative findings.
Figure 9 shows historic TFRs for the United States over the last century. The pattern of fertility rates between about 1990 and 2010 was partly due to the high fertility of non-native-born and young women, together with a high rate of unintended pregnancies. These have diminished because recent Asian Americans and Hispanics immigrants have a lower fertility rate than prior immigrants. The two peaks in fertility, in the 1990s and 2007, were primarily due to a change in the tempo of births, with an older average age of the mother at birth. The 2007 TFR of 2.12 has dropped sharply to an almost all-time low of 1.66 for 2022, a 22% decrease). A cohort view of this fertility would have shown a single peak, with a decrease beginning in the mid-2010s.
Figure 10 further clarifies the trend shown in Figure 9, by detailing the historic and projected patterns of US central birth rates by quinquennial age groups. Figure 10 illustrates the significant decreases in rates for younger women since about 1955, the middle of the US baby boom, and a gradual increase since about 1975 for women aged over 30. The figure also includes the best-estimate projections after 2022 of the Trustees of the US Social Security system.
An important factor that can be used to characterise fertility rate patterns is that parity, the number of children of a particular woman, has been affected by an increase in age at marriage and at first birth in many countries, and the percentage of the female population of childless women. A common measure of parity is the parity progression ratio for a cohort of women, the proportion of women with a given number of children who go on to have another child. This measure can be supplemented by analysis of fertility rate trends for first births, second births, and so on, to gain insights into changes in the fertility of the population. If parity is reflected in this way, the probability of first, second, third, and so on births by age can be used in a more refined fertility model.
Fertility can also be assessed in terms of the percentage of women having at least one child, and the number of births for women who have had at least one child. Feyrer et al. (Reference Feyrer, Sacerdote and Stern2008) compared complete TFRs for women who were born in 1940 and in 1963 to determine the relative importance of these two factors in explaining decreases in TFRs. They found that in 10 of 14 European countries, the number of births per woman was more important, while the percentage of those with at least one child was more significant in the remaining four countries. For example, West Germany’s decrease in TFR was due to a reduction in the percentage of women with at least one child, while in France and Ireland, most of the decrease in their TFR was due to a change in the number of births per woman.
3.1.3 Uncertainty: the use of scenario and stochastic analyses
Uncertainty regarding fertility projections is inevitable. The level and extent of the uncertainty depend upon the reliability and availability of the data, the size of the considered population segments or areas, and the periods being considered, as well as on the models and drivers considered, and their underlying assumptions. Uncertainty is inherent in looking forward to the future, including public attitudes and behaviours of population segments, and behavioural and public policy responses to changed conditions. Under normal circumstances, significant fertility changes can take years to unfold, especially with respect to fertility’s quantum or tempo effects, complicating the recognition of distinctions between trends, cycles, and aberrations, or whether the observed experience will have temporary or permanent effects.
To overcome this high level of long-term uncertainty, several fertility scenarios and alternative models are used in population studies. These, in turn, may force decision-makers to apply their own beliefs as to which scenarios and assumptions to consider in their decision-making process.
Two modelling approaches have primarily been used to assess and report on this uncertainty – scenario and stochastic analyses. They both reflect possible future fertility and population trajectories in response to the effects on the underlying modelled fertility of multiple drivers and assumptions, especially those involving human attitudes and behaviours. In either approach, simulation methodology is often separately applied, rather than or in combination with an analytic solution or scenario analysis, to the TFR and the age-specific distributions.
In scenario analysis, alternative sets of assumptions are applied, each generating a scenario under “alternative world” conditions, resulting in multiple future trajectories. Often, pessimistic, neutral, and optimistic plausible scenarios are selected by the analyst or decision-maker, with simple deviations from the central guessed scenario, for example, a 0.2 deviation from a particular projected TFR. An alternative approach is to develop scenarios based on several likely progressions of conditions, such as increased education of girls, a downward spiral of fertility rates, or slower or faster convergence of the global fertility rate. Alternatives might involve expected quantum, tempo, or both. The selected scenarios may be useful to formulate expected and contingent policies, and their application to other demographic and economic assumptions.
Stochastic modelling of fertility rates can also be performed, although it may be difficult to develop robust probability distributions. The distributions could be derived from experience, from an analysis of individual population segments or fertility drivers, or be based on sociodemographic/economic hypotheses, resulting in expected distributions for possible scenarios, from which alternative trajectories or confidence levels may be computed. A challenge in developing probability distributions is that part of the uncertainty involved may be the result of a discrete set of drivers, rather than of a stochastic process, whose behaviour may be driven by factors that are difficult to project with much accuracy.
3.2 World Population Projections
Thomas Malthus (Reference Malthus1798), and Paul Ehrlich and Anne Ehrlich (Reference Ehrlich and Ehrlich1968, at the peak of global population growth), among many others, have raised concerns about the escalating growth of the world population, predicting worldwide famine and doom resulting from the inability of the earth to feed and sustain the expected population. In contrast, much recent literature has addressed current baby busts, resulting from below-replacement fertility rates in several countries that could lead to major economic and social upheavals. These concerns and patterns have led to an urgent interest in world population projections, to answer such questions as “what will be the world’s population by the end of the 21st century?”. The United Nations, for example, has produced such projections since the 1950s.
Such projections highlight major local, national, and global expected social, economic, and political trends and developments. These in turn enable and support estimates of future demands for food, water, housing, energy, healthcare, education, and other resources and services, as well as the availability of workers and means to provide for them. Public and private policymakers are then better equipped to recognise risks, opportunities, and sustainability, and improve their planning and execution of policies, programmes, and budgets.
Since intervening events, developments, and conditions may wreak havoc with the assumptions underlying any population estimate, a range of alternative projections, and identification and discussion of key drivers of the assumed changes and uncertainties involved, will be needed.
A major difference in alternative global population projections relates to the expected speed of fertility decrease in many African countries with a relatively high current TFR. The United Nations’ projections indicate a tripling of sub-Saharan African population to more than three billion people by 2100, while other projections have a lower peak far earlier than that.
Fertility is only one element of population forecasts, which also include – among other factors – mortality, morbidity, disability, and migration within a country or between countries. These elements may require consideration of multiple population segments, as well as changes in key drivers, correlations, trends, and patterns of the key demographic factors. For a specific scenario, these factors should be as internally consistent as is practical. The expanded scope increases the uncertainties and modelling complexities involved, particularly for long-term projections, and further emphasises the need for carefully constructed stochastic or scenario analysis methodologies.
To highlight the importance of alternative model methodologies and assumptions, and their range of projected populations up to the end of the 21st century, projections from several such models are presented in Figure 13. Over the short term, these global projections are reasonably similar, as they start from similar base populations. They deviate substantially after the first couple of decades, and especially towards the end of the century, as the effects of the underlying assumptions accumulate over time. The ranges between low and high projections do not represent statistical ranges or confidence intervals; rather, they result from alternative sets of assumptions, models, and scenarios. These variations caution against using any one of these projections as a forecast with a high level of confidence. A better understanding of these trajectories supports the need for actions to help effectively shape our future.

Figure 13. Summary of four world population forecasts.
4. Implications of Fertility and Population Ageing
4.1 Introduction
The oft-quoted phrase “demography is destiny” remains applicable, where low fertility and consequential population ageing have and likely will continue to have a major impact on almost all aspects of the future. Demographic, population, and ageing changes can have enormous impacts on all aspects of life, such as climate change, environmental stress, food production, health, the labour force, military might, and economic growth or decline; as well as on the sustainability of national education, healthcare, retirement, and welfare systems.
The changes and their implications are therefore of significant interest to, and used by, a wide range of decision-makers and researchers, forming the basis for many aspects of public policymaking, with significant implications at community, national, regional, and global levels. These changes do not arise overnight and provide plenty of time to address their impacts, but often the public decision process seems slow to anticipate or respond.
The effects of a high TFR are relatively clear, as it has been experienced before. In contrast, some of the effects of the post-transition last stage of the demographic transition, with low or falling fertility and mortality rates, are foreseeable but less understood, and may differ by country. These effects can include workforce and subsequent total population shrinkage, widespread demographic ageing, rural and small-town depopulation, and school closures because of a declining number of students. With fewer active participants in the economy, there may be a reduction in demand for goods and services, a declining housing market, a declining tax base, and a greater public debt per capita.
Although some demographic changes can take decades to play out, a population decline, once it starts, can spiral downward exponentially and be unstoppable – with fewer births meaning fewer girls growing up to have children, who then have smaller families. Widespread catastrophes, such as COVID-19 and its economic consequences, complicate and exacerbate this process.
In the short term, say over 20 to 30 years, a reduction in fertility lowers a society’s dependency burden by reducing the number of children relative to the number of working-age adults. However, in the longer-term, say 40 to 50 years, the working-age population becomes older, and diminishes in size and in its support for both the young and the old. Society’s old-age dependency ratio increases and strains budgets, unless entitlement is delayed or benefits decrease, neither of which is popular. Some countries have reached that point already.
In many respects, prior high population and growth issues have been turned on their head, resulting in current concerns regarding low population growth and economic decline. In contrast, higher birth rates will continue to challenge several African countries that lack resources and sufficiently robust economies to support their large number of young adults. Demographic problems differ between countries, with no ideal or unique size and age mix of a population.
Leaders in countries around the world are just beginning to grapple with several of these foreseeable social, economic, and political effects of fertility changes and patterns. Key questions related to the workforce and elderly population include:
-
Will there be enough younger adults to replace the retiring workforce?
-
Will education and technology affect productivity sufficiently to offset a slowdown in the size of the future labour force?
-
How much and who will pay taxes in an ageing society?
-
Who will provide healthcare and retirement benefits for retirees?
-
Who will care for the elderly?
-
Will people with longer lives still be able to afford to retire from work, and at what age?
-
Who will buy the houses they try to sell as they get old?
-
Will inequality increase or decrease?
Similar questions can also be raised regarding the waning younger generation. Informed knowledge, warning, and effective actions are needed to address these and other issues.
Knowledge about the current and future population size, TFR, age-related composition of the population, and their dependencies and financial consequences, is needed for sound decision-making to address long-term issues. Granular information, for example, through population pyramids, as presented in Figure 14 for the 2022 median world population projection of the United Nations, may prove valuable.
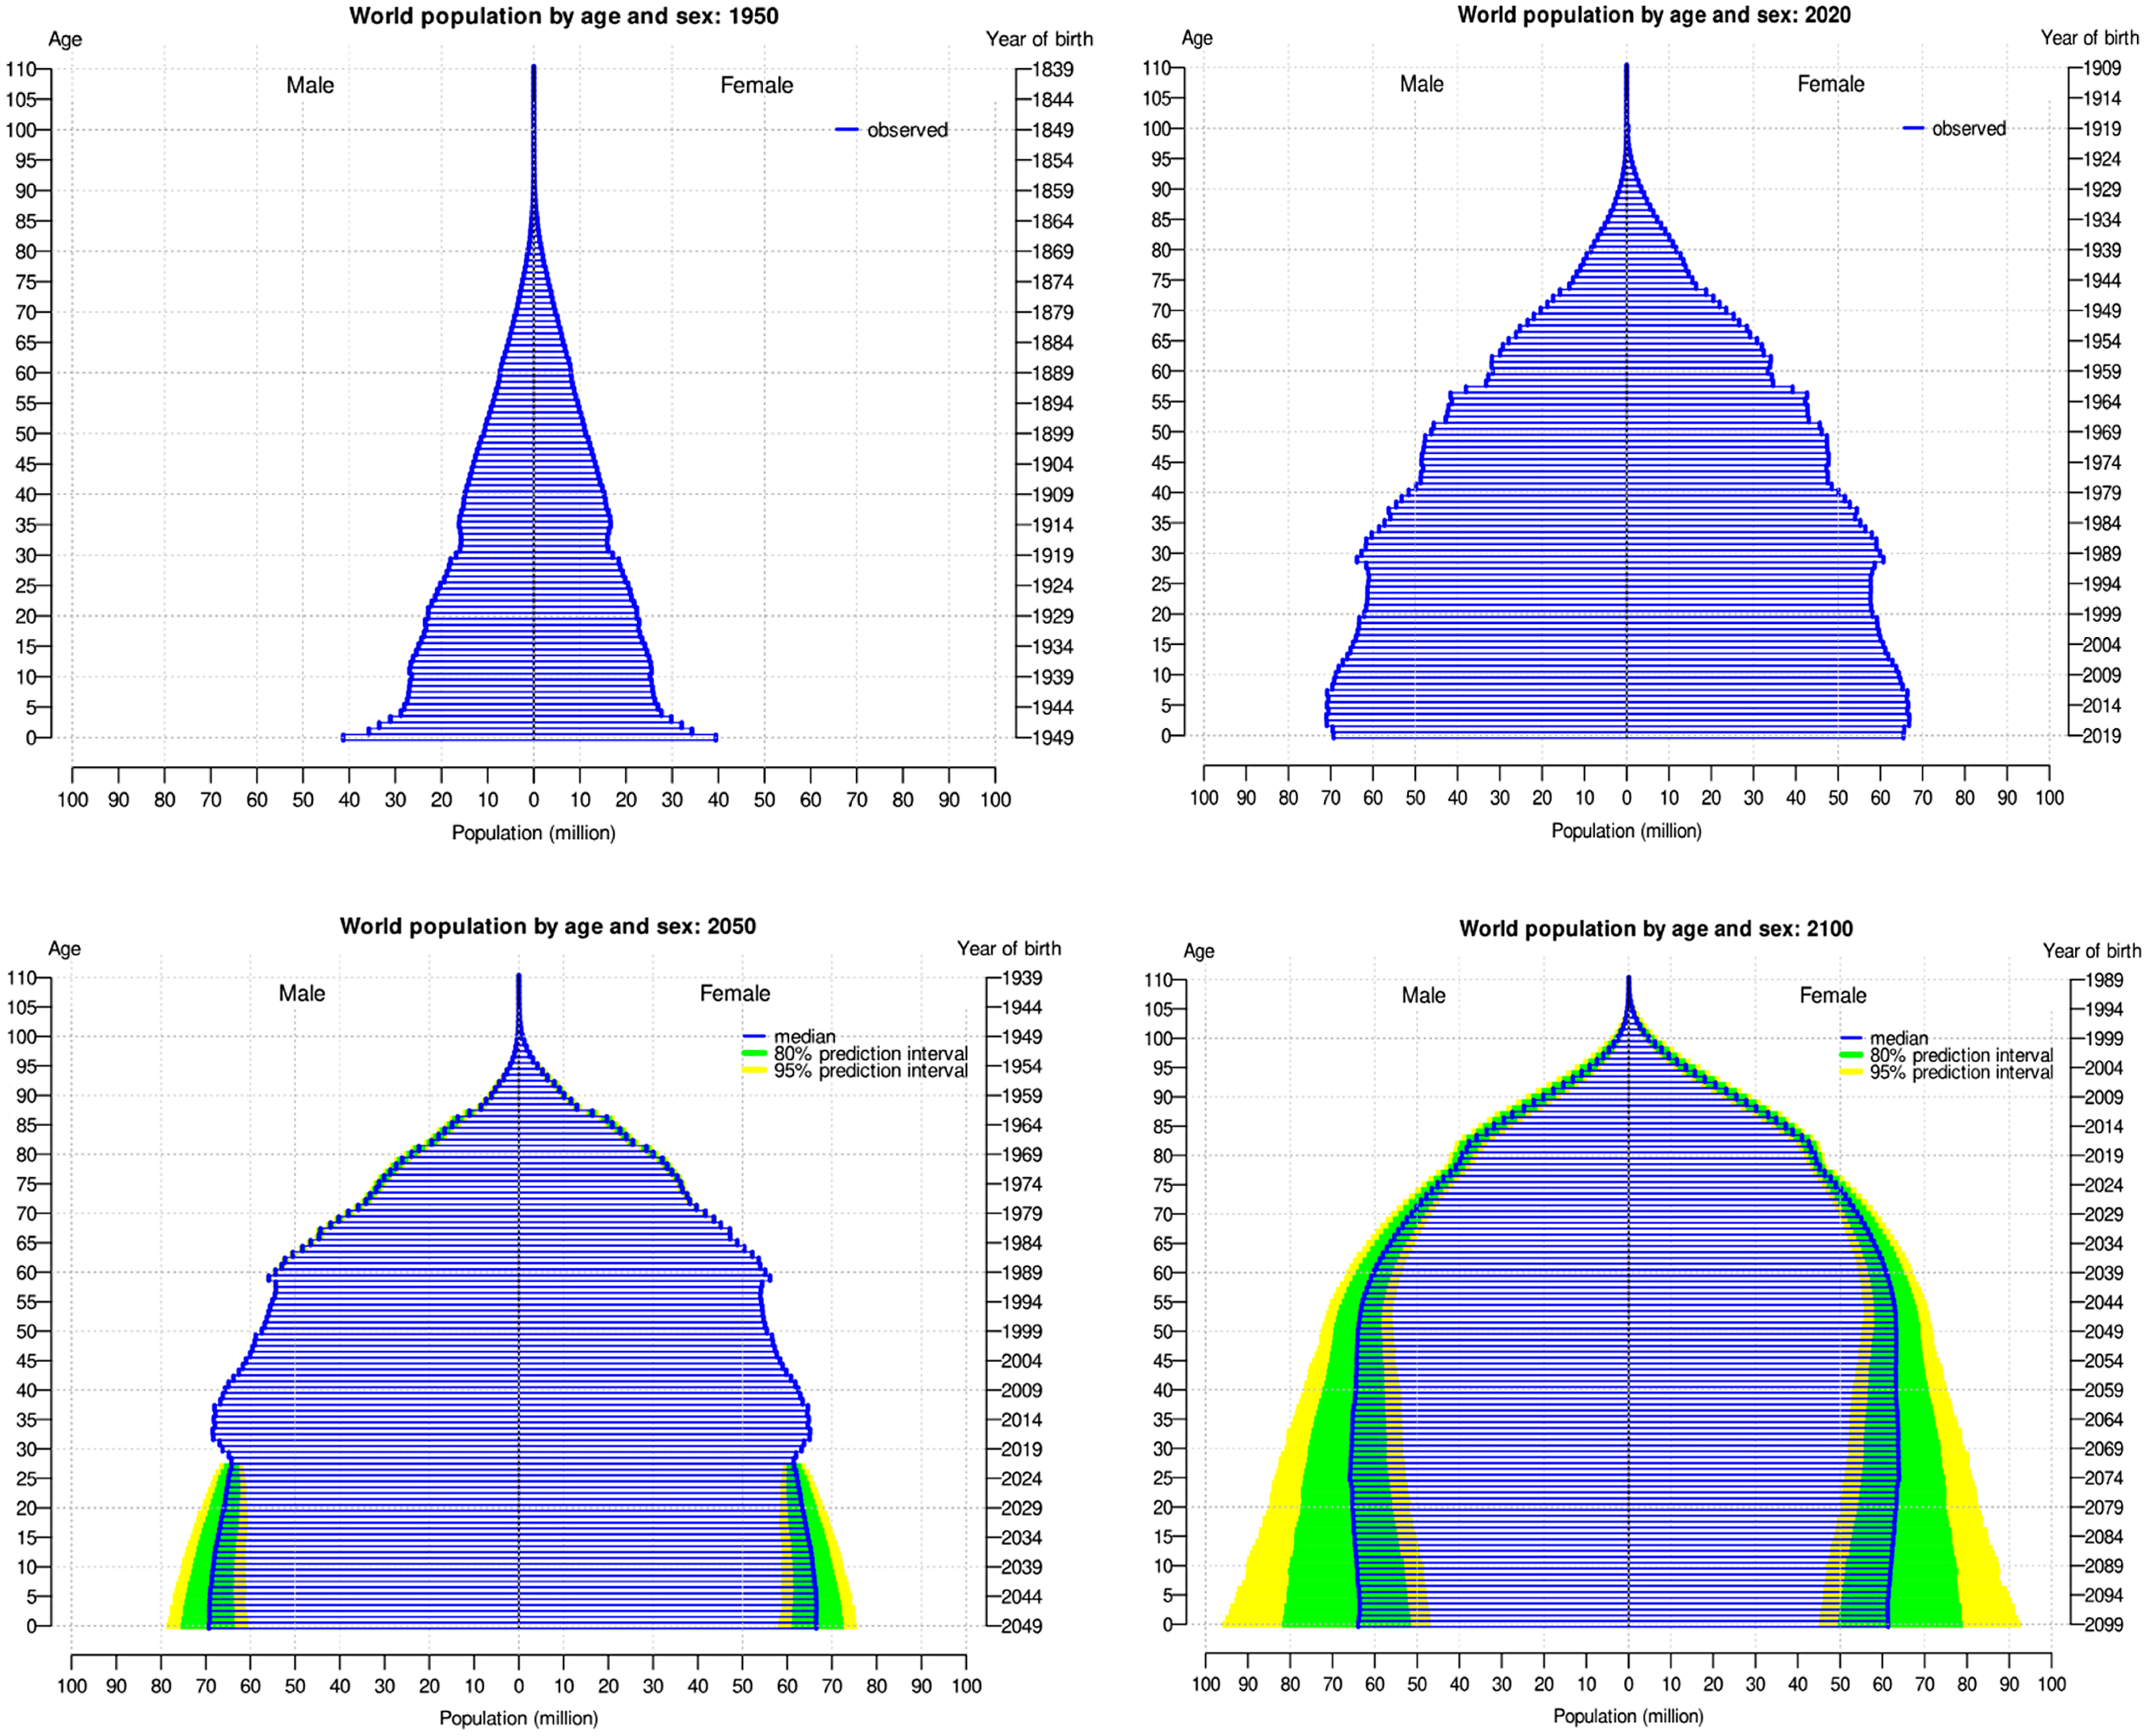
Figure 14. Global demographic information – United Nations (2022) projection.
As indicated in Figure 14, the increase in the old-age population (the top of the pyramid) is evident from around 1950 onwards, when 5.1% of the population was aged 65+, until 2100 when this proportion is projected to increase to 22.6%. At the same time, the dependency ratios, particularly the old-age ratios, change markedly. In other words, in 1950, every person aged 65+ had about 10 (100%/9.9%) workers who supported their economic and social needs, while it is projected that there will be only about 2.4 (100%/41.8%) workers available to do so in 2100.
Despite the numerous adverse consequences of low fertility, there are also some potentially favourable effects. These include fewer mouths to feed, less pressure to increase crop yield, and potentially an easier task to sustain the earth’s resources. Global population decline could ultimately reduce stress on global land, air, and water resources and environmental damage, and slow climate change and its many adverse consequencesFootnote 3 . A smaller population could lead to higher wages, more equitable societies, and a higher quality of life for the smaller numbers of children who are born and their families, depending on changes in productivity and the distribution of wealth. In addition, many women are having fewer children because that is what they want.
Conflicting views have developed regarding the implications of a low-fertility environment on inequality. Goodhart & Pradhan (Reference Goodhart and Pradhan2020) suggest that fewer workers will lead to greater competition for labour, resulting in higher global wages that may ultimately lead to reduced inequality. In contrast, Bailey et al. (Reference Bailey, Guldi and Hershbein2013) suggest that such an environment will lead to increased investment in fewer children for women with more education and income, which will ultimately lead to increased inequality. Van Reenen (Reference Van Reenen2011) shows the sharp increase in wage inequality across the OECD since the 1970s, as technology-related increases in the demand for skilled workers outstripped the growth in their supply while leaving demand for the lowest skilled workers unaffected. Future developments may present divergent inequality futures depending on the country and a range of external factors.
Some claim that ageing concerns are exaggerated because of an outdated definition of “older people,” as those in their 60s are more productive and healthier than those in earlier years. Despite this, deep societal, economic, and personal concerns remain. Ageing represents a major challenge for many societies, placing extra strains on fiscal revenues and spending.
The remainder of this chapter addresses certain key issues involved, mostly dealing with the effects of low and ultra-low fertility.
4.2 Workforce and Economic Implications
In a 1937 lecture, John Maynard Keynes warned that declining populations come with nasty economic side effects. A downward economic spiral could ensue, with a smaller workforce with decreased consumption and consumer demand for goods and services, weak demand for investment, retirees who tend to consume less, and a decrease in tax revenue that in turn could lead to a further decrease in economic growth, and subsequent unemployment. This decline could make it difficult to sustain rising productivity and increased labour costs, accompanied by possible secular stagflation and slow real growth, ultimately leading to increased healthcare and retirement costs per capita as the population ages (Goodhart & Pradhan, Reference Goodhart and Pradhan2020). Governments may want to avoid the risk of this spiral, both in the short and longer terms.
Workforce reduction due to low fertility has already begun in countries such as Japan and China. The size of the European workforce aged 20 to 64 years peaked in 2012 (United Nations, 2019). Without a change in their fertility level or immigration, OECD countries overall are expected to lose a quarter of their working-age population by the early 2050s. Responding to population decline will become an overriding policy concern in many nations. A shrinking workforce is a key economic consequence of low fertility several decades earlier. As the low-fertility generation ages, labour and skills shortages may arise. These shortages in turn may be partly offset by labour-saving technologies, robotics and automation, outsourcing, bonuses for immigrant workers, and more older people working, as well as enhanced continuing education and training.
In some countries, increased labour force participation by women may offset, temporarily, shortages of men in the workforce; similarly, healthy retirees may be encouraged to continue working. Some countries may resort to increased immigration, particularly in people-intensive employment such as in social services, medical support, elderly caregiving, agriculture, and hospitality and tourism industries. Entire industries, governments, education, healthcare systems, and other institutions may need restructuring. As younger people often drive the engine of innovation and new ideas, a significant reduction in their numbers will tend to diminish the dynamic and creative capacity of an economy (Jones, Reference Jones2020).
Goodhart & Pradhan (Reference Goodhart and Pradhan2020) explained that a rising old-age dependency ratio is inherently inflationary and tends to increase interest rates, since dependents consume but do not produce. Meanwhile, workers are likely to consume more, as a shortage of labour pushes up wages, and investment may rise in economically advanced countries as companies substitute capital for more expensive labour. Demand will, as a result, increase as supply falls. Economists hold opposing views regarding whether new technology will increase productivity enough to offset the impending shortage of workers.
4.3 Safety Net Support and Social Security Systems
Through social security and safety net programmes, governments recognise their public responsibility to help ensure that certain basic human financial needs are met, especially for those unable to provide for themselves. This responsibility is provided through welfare or social programmes for such needs as food, housing, healthcare, education, and vocational training. These programmes may be funded by the government or its institutions. Alternatively, they can be funded through insurance programmes, where those supported are restricted to those for whom contributions have previously been paid, either by themselves (as in pension programmes) or by their employers (as in workers compensation and unemployment programmes).
A downside of low fertility is that 30 to 40 years later there will be fewer workers to support the needs of retirees and other beneficiaries of safety net programmes, negatively affecting their affordability, maintainability, and sustainability. Consequently, problems associated with low fertility and ageing are becoming more evident and urgent.
A metric commonly used to assess the severity of this problem is the old-age dependency ratio, the ratio of the number of those older than 65 to the number of supporting adults (e.g. those between ages 20 and 65 years). In Figure 15, the right-hand most red value above each population pyramid is the global old-age dependency ratio, which moved from 9.9% (i.e. about 10 supporting workers per retiree) in 1950 to a projected 41.8% (or 2.2 workers per retiree) in 2100.
Population ageing can result in upwardly spiralling costs of social safety nets such as healthcare, social care, and pensions, while simultaneously risking slower growth in tax revenue as the size of the workforce decreases. Even though many factors are involved, both the Chinese and US national social security funds could, by 2035, run out of money to provide for currently scheduled benefits; unless additional funds can be allocated through increased contribution/taxes, decreased benefits, modified eligibility, or programme design. Similar analysis applies to all safety nets programmes. This is well illustrated in Figure 15, where the projected retirement portion of the US Social Security programme (Old Age, Survivors and Disability Insurance (OASDI)) will require more than 15% of taxable payroll. Such steps can raise the concerns of workers regarding intergenerational income transfers.

Figure 15. Costs of US social security as a percent of applicable taxable income. Source: US Social Security and Medicare Board of Trustees (2023).
Major rating agencies have warned that ageing populations are affecting governments’ credit ratings. Without reform, downgrades are likely, threatening a vicious circle of higher fiscal burdens and rising borrowing costs. The longer governments defer action, the more painful it will be. For example, the hit to public finances has affected the outlook for debt in the European Union, where the share of the population over the age of 65 years will rise from 20% to 30% by 2050.
A related problem is the growing support load of informal (that is, unpaid) long-term social caregivers, often provided by extended family (especially daughters and granddaughters), friends, and voluntary organisations. This source of caregiving will be reduced in size because of smaller family sizes and a longer period between generations. This will require a substantial increase in paid caregiving and increased societal costs for the support of those needing such care, at the same time as the total workforce is decreasing. In contrast, informal child caregivers often consist of grandmothers, and with increased healthy longevity, this source of caregiving may increase.
Overall, there has been a negative correlation between the level of economic development of a country and its TFR. The link between fertility and poverty has been much discussed, with arguments made for a causal link or a correlation relationship (Wietzke, Reference Wietzke2020).
High-fertility countries have a different set of problems. The number of births may burden their budgets and contribute to a high level of inequality and poverty. Weak infrastructure and governance to meet the challenges of high youth unemployment and poverty worsen these problems. Greater expectations, fed from increased social media exposure to the “better” life, may exacerbate unrest and result in weak economic performance. This will increase the already large gap between the have and have-not countries.
4.4 Long-term Public Resources
Budgeting for the long term is essential for long-term planning. As Posner and Rubin (Reference Posner and Rubin2014) noted, “the combined influence of ageing populations and rising healthcare costs is challenging budget officials to recognise the long-term implications of current policies and choices for periods of several decades or more into the future … (while) political leaders are stepping in to reframe the long-term agenda to support near-term political and ideological goals.”
Public systems are usually provided with limited resources from which to achieve their short- and long-term objectives. Funding policy, addressed through budgeting processes, includes raising and allocating resources, distributing these resources to planned targets, and monitoring the use of the budgeted resources. As complex and politicised as short-term budgeting is, it is relatively simple in comparison with long-term budgeting that is affected by uncertainties concerning revenue, taxable income, and future outlays that rapidly increase as the budget horizon lengthens, in addition to unpredictable cultural and demographic changes, including fertility, of a structural nature.
In many countries, reforms that address ageing pressures may be needed if government debt is to remain sustainable. In the absence of reforms to ageing-related fiscal policies, S&P estimated that the typical government would run a deficit of 9.1% of GDP by 2060 from 2.4% in 2025, with pension costs rising by an average of 4.5% of GDP by 2060 reaching 9.5%, and healthcare spending increasing by 2.7 percentage points of GDP for the median country, with a large variation by country (S&P Global, 2023).
Similar forces affect all countries, whether developed or developing. Long-term government infrastructure planning is dependent on the expected changes in population growth and patterns, which may increasingly dominate public budgets and potentially crowd out funding for other needs.
5. Addressing Fertility Issues
5.1 Approaches to Address Low Fertility
The time to address long-term economic, social, and demographic policy is now, rather than 20 or 30 years from now when more adverse outcomes will have emerged and increased in intensity. The impact of these actions can take a long time to become effective, because of the long lags and cultural attitudes involved. Therefore, although the current low and ultra-low fertility rates and trends in many countries do not yet constitute a baby-bust panic situation in most of these countries, they should not and cannot be ignored.
Attempts to change fertility rates directly, especially by coercive means, have almost always failed in the long run. Very few rich countries have successfully reversed a decline in fertility, and none has climbed back above the replacement rate of about 2.1 births per woman after dropping below it. Countries may need to learn to live with and adapt to population changes, such as low fertility, rather than ineffectively resist the underlying forces involved.
Just as there are multiple drivers involved in fertility, there have been many approaches taken to address decreasing fertility should a society decide that it wishes to do so. However, approaches that on paper should work sometimes do not. Some approaches, such as a temporary subsidy for additional births, often just affect tempo and not the quantum of fertility. Discerning the emerging difference between permanent and tempo effects can take a long time.
In response to low fertility, many countries have been promoting “family-friendly” policies that support workers who have children, either today or sometime in the future. These include various subsidies, free or subsidised childcare facilities, paid parental leave, help in financing reproductive technologies such as in vitro fertilisation, synchronising the school day with the workday, and making it easier for women to develop their careers while having a family. However, most approaches that have been tried have had limited success, either in terms of permanence or significance, as multiple factors are involved, and it can take years or decades for changes in underlying attitudes to materialise. Further, some approaches work well in some countries/cultures but may be difficult to work effectively in others.
In confronting the impacts of an ageing population, all governmental and social policies may need to be reviewed and possibly redesigned, using alternative ways of thinking regarding both costs and benefits, including their and structure and contents. For example, in South Korea universities are being encouraged to merge, as they are finding it difficult to find students. In Japan, adult diapers now outsell those for babies, municipalities have consolidated, and entire towns and millions of homes have been abandoned. In Sweden and Italy, some cities have shifted resources from schools to elderly care.
Family-friendly policies line up well with some of the drivers of changes in fertility, while migration policies, although important, may only serve as a partial counterweight to future population decline and may be problematic in their own right. Many family-friendly policies can have additional benefits independent of their effect on fertility. Policies that can be considered include governmental and private sector business actions, such as:
-
encouraging marriages and family formation.
-
supporting the pursuit of careers by females with family-friendly policies.
-
encouraging more women to undertake paid work, including equal pay for equal work.
-
supporting parental leave for women and men at the birth of a child, shared between mothers and fathers.
-
implementing flexible working arrangements such as flexitime.
-
making part-time, flexible work, or work-at-home more available with the right to move to full-time work.
-
handing out baby bonuses, child allowances, and subsidised childcare.
-
providing increased spending on quality, affordable, or free early-year education and childcare support.
-
encouraging and subsidising childcare careers.
-
providing subsidised housing for those with larger families.
-
expanding and providing information regarding gynaecological, obstetrical, postnatal, and paediatric services.
-
improving and making available technology that addresses infertility.
-
implementing or enhancing financial/tax incentives to have more children, through such approaches as higher deductions for dependents, or family tax credits for children after the first.
China, for example, in its efforts to counter its former one-child policy, has taken numerous steps to increase the number of births, including increasing hospital subsidies for the cost of childbirth for second and third children, providing extended maternity and paternity leave, providing cash rewards for births, reducing the cost of education, increasing labour protections for women, requiring signatures of 3 medical professionals to have an abortion after 14 weeks, introducing marriage incentives, establishing local marriage councils to encourage and provide incentives for marriage, implementing divorce restrictions, providing new nursing and childcare facilities in shopping malls, encouraging the sharing of parenting responsibilities, and expanding fertility services (e.g. egg freezing and in vitro fertilisation for married women) while decreasing the number of family planning centres.
To date, however, many of these interventions appear to have had limited or at most temporary success. For example, programmes in Singapore, Taiwan, and Japan have accomplished little so far (Vollset et al., Reference Vollset, Goren and Yuan2020). Despite an impressive package of family-friendly policiesFootnote 4 , the TFR in Sweden has decreased for native-born women from about 1.9 in 2011 to less than 1.7 in 2020, and to somewhat less than 2.1 for non-native-born women. This reduction is similar to that in the United States, without nearly the same level of family-friendly policies as in Sweden.
An extreme example of ultra-low fertility is South Korea, wherein a mismatch has developed between South Korea’s traditional culture, which does not accept children born out of wedlock, and the evolving preferences of its young adults. In 2022 it had a global minimum TFR of 0.78 per woman (in Seoul it was 0.59 per woman), down from 4.53 per woman in 1970. The government has implemented many forms of incentive since 2005, with limited success, as the changes in the attitude of the young had a far stronger effect.
The latest package of South Korean government inducements (Gladstone, Reference Gladstone2001) offers monthly allowances of about US$274 for every newborn and infant up to the age of one starting in 2022. Expectant couples receive a US$1,800 cash bonus, along with increased medical and other benefits. So far, child benefits have not been successful in increasing the number of births.
Since most women bear a greater child-related burden than men, the effectiveness of governmental interventions usually depends more on their value to the woman. A child-based subsidy needs to be 2.2 to 3.1 times larger when targeted to men to be equally effective as compared with that for women (Doepke & Kindermann, Reference Doepke and Kindermann2019).
During the COVID-19 pandemic, many governments adopted some form of lockdown scheme to minimise contact between people and reduce the spread of the pandemic. That in turn forced many families to stay together for months, forced parents to be more involved with their children’s rearing and education, and expanded work-from-home practices. It is not yet clear whether or how pandemic-related uncertainties will have any long-term effects on fertility; early results have not brought significant changes in fertility.
Consistent with results from Sweden, a study of fertility rates since 1980 in 22 developed countries found that while in some ultra-low-fertility countries, particularly in Northern Europe, fertility rates had somewhat increased, recently subsequent fertility rates again decreased (Reibstein, 2007). An example of this decrease in birth rate is Finland, where in 2022 the national TFR had dropped to 1.32 children per woman, an all-time low, despite the government’s efforts to reverse the trend with extensive social programmes to support parents.
5.2 The Role Actuaries Can Play
Gutterman (Reference Gutterman2018) described actuaries as being involved with the bookends of life: understanding shifts of lifecycle events, analysing data, and creating models involving and about rates of birth, morbidity, and death. Still, as Gutterman noted, “most actuaries don’t have to estimate fertility in their daily work (except for those dealing with social security)”. Actuaries, though, provide advice, develop models, and project populations for use by governments, industries, and companies significantly affected by population trends, which in turn are partially determined by fertility trends and patterns.
Actuaries as risk managers are concerned with all of life’s risks between, and including, these bookends, as these risks presently exist and as they develop over time. As fertility is an essential component in the evolution of future populations, affecting all aspects of future demographic, societal, economic, well-being, and cultural life, it must be an essential element of actuarial studies and projections, especially those involving long-term demographic levels and trends.
In many actuarial studies, the baseline is an assumption that the “status quo” will continue, and that past trends can be used as an acceptable basis for future projections. But as Gutterman noted, “rates of fertility in the United States, as in many other countries, have behaved like a roller coaster … Marriages are happening later in life and mothers’ age at first birth has been increasing … More women are in the workplace now, whose careers can place constraints on family size. More women are not having any children or are having only one,” and more families are single-parent families. Thus, the study of fertility becomes essential, particularly for population studies and developers of societal programmes, as the utilisation of averages of historical patterns may not be appropriate in forecasting the future.
Billig and Gallop (Reference Billig and Gallop2014) indicated that “Evolving populations need appropriate products … and result in actuaries working in non-traditional areas”. This is the case for actuaries who deal with social security programmes and for pay-as-you-go pension schemes, as well as for actuaries who assess projected marketing opportunities for products aimed at certain sociodemographic groups during their lifecycle, and future workforce benefits, for example, workers compensation. It is also the role expected of actuaries involved in the design and evaluation of public programmes, such as healthcare and education systems, which plan to satisfy population needs over many years. Actuaries should be involved in assessing the effects of factors such as intergenerational equity, labour shortages, ageing, healthcare, long-term care, and old-age retirement systems.
Actuaries are experts in incorporating statistical, mathematical, demographic, economic, and financial information into risk-oriented models, analyses, and projections, in questioning and combining data from various sources where appropriate, and recently in the use of predictive analytics and big data. Although these capabilities have been mostly applied in traditional fields such as insurance and retirement benefits, they are also needed in many economic, societal, and healthcare arenas where population trends and projections play a significant role. An example of a non-traditional application of actuarial expertise, together with medical and healthcare experts, is in the analysis of reproductive services and to develop insurance coverage of reproductive healthcare. As the roles of actuaries expand to cover a broader range of activities and risk, so will their areas of study and interest – including demography and fertility.
6. Conclusions
Amartya Sen (Reference Sen1994) indicated that “there can be little doubt that economic and social development, in general, has been associated with major reductions in birth rates and the emergence of smaller families.” The factors and trends involved in fertility analysis are multiple and complex. The quantum and tempo of fertility can represent the most significant long-term demographic sources of uncertainty in population trajectories.
Reactions to global fertility trends have changed significantly over the last 50 years. High birth rates in many countries during the baby boom led some to believe that an ever-growing population would soon deplete the Earth’s natural resources and, more recently, contribute to climate change. Recently, this concern has been turned on its head, with below replacement and even ultra-low fertility in some countries that could lead to labour force and population declines becoming the focus.
The ramifications and responses to the fertility transition and decline have already begun to appear, especially in East Asia and parts of Europe. These demographic forces threaten to upend how societies and families are structured. Governments of those countries where fertility has been low for a long time are, or will soon be, involved in balancing the demands of an expanding older population, with the needs of young people whose decisions about childbearing are being shaped by factors unique to the social networks, work, technology, and social environment of the 21st century.
The drivers of fertility suggest that the processes involved in future fertility developments are complex, in some cases driving changes in opposite directions. Nevertheless, both the drivers and possible outcomes are important in determining effective social, educational, health, and economic policies. This process will lead to significant changes in national and local economies, and in turn affect public and private sector financial programmes and institutions.
Methodologies for fertility projection focus on the quantum and tempo of fertility. Most long-term projection models assume gradual convergence of the TFR among countries to a level somewhat below the natural replacement rate, with a wide range of possible future scenarios involving differing speeds of demographic transition and a great deal of uncertainty. Significant differences in long-term global population forecasts primarily involve differences in opinion regarding the speed of decrease in fertility in sub-Saharan Africa, and the ultimate level of fertility of those countries currently experiencing ultra-low levels, such as China, Japan, and South Korea.
Implementation of population policies is a challenge, especially since experience indicates that personal and cultural attitudes are involved, and permanent change usually takes a long time to materialise. Nevertheless, the better that fertility trends, drivers, and implications are understood, the more likely that appropriate solutions will be developed. Ageing represents a major challenge for many societies and their institutions, placing extra strains on fiscal revenues and spending. Actuaries need to be ready to prepare their clients for the upcoming long-term impacts.


 Open access