


Impact statement
Given their exceptional size, the marine megafauna plays key ecological roles in modern ecosystems. Although large animals are known from the fossil record, including many charismatic species, the marine megafauna of the past has never been defined or described before. Here, we propose a definition for the marine megafauna that can be applied to the fossil record. Based on this definition, we review the paleontological literature and list the taxa that constitute the extinct marine megafauna throughout the Phanerozoic, to then do a first exploration of their ecological and evolutionary patterns over time. Our findings reveal that the extinct marine megafauna is dominated by reptiles, in great contrast with today’s assemblage in which reptiles are a minority. The Mesozoic stands out for hosting >50% of the extinct marine megafauna, and the largest body size recorded in the past: 21 m. Like today’s assemblage, most extinct marine megafauna are coastal macropredators. Our work represents a first step towards a better understanding of the extinct marine megafauna and a baseline to inspire further work on this remarkable group.
Introduction
Today, the global marine megafauna includes all freely moving animals of >45 kg that inhabit coastal and ocean habitats, excluding colonial reef-forming scleractinian corals (Estes et al., Reference Estes, Heithaus, McCauley, Rasher and Worm2016). They contain representatives of numerous taxonomic groups, including invertebrates, bony fishes, cartilaginous fishes (hereafter, chondrichthyans), reptiles, seabirds and mammals. Collectively, these animals play important roles in marine systems, including nutrient transportation and storage, top-down population control, biochemical cycling, connecting oceanic ecosystems, and shaping and altering habitats (Estes et al., Reference Estes, Heithaus, McCauley, Rasher and Worm2016; Malhi et al., Reference Malhi, Doughty, Galetti, Smith, Svenning and Terborgh2016; Tavares et al., Reference Tavares, Moura, Acevedo-Trejos and Merico2019). This fauna largely comprises the survivors of a global extinction event that took place around 3 million years ago, which resulted in the loss of one-third of megafauna genera, and around 17% of their functional diversity (Pimiento et al., Reference Pimiento, Griffin, Clements, Silvestro, Varela, Uhen and Jaramillo2017). At least 40% of the extant marine megafauna are currently under threat due to multiple human impacts (Pimiento et al., Reference Pimiento, Leprieur, Silvestro, Lefcheck, Albouy, Rasher, Davis, Svenning and Griffin2020).
Because the profound influence that the marine megafauna has on ecosystems is mostly due to their large size, the definition of ‘marine megafauna’ is size-based (Estes et al., Reference Estes, Heithaus, McCauley, Rasher and Worm2016). The size cut-off to define this fauna is derived from the fossil record, particularly on elevated extinction rates among large terrestrial mammals (>45 kg) during the Pleistocene (Lyons et al., Reference Lyons, Smith and Brown2004). However, applying this 45 kg cut-off to extinct animals is problematic, as the body masses of many fossil taxa are unknown because of the inherent incompleteness of the geological record, especially over deep timescales. This problem is exacerbated by the polyphyletic nature of this marine faunal assemblage, whereby body size estimates are markedly different between body plans, resulting in heterogeneous size measures (e.g., total length, diameter, etc.). As a result, previous paleontological works on ‘marine megafauna’ have not used a body-size-based definition, and instead, have included available representatives of marine mammals, marine turtles, seabirds, and chondrichthyans (Pimiento et al., Reference Pimiento, Griffin, Clements, Silvestro, Varela, Uhen and Jaramillo2017; Dominici et al., Reference Dominici, Danise and Benvenuti2018). Therefore, a definition of marine megafauna that can be applicable to the fossil record is not yet in use.
Why do we need to define the extinct marine megafauna?
Large marine animals are prevalent in the fossil record and include many charismatic extinct species that draw the attention of the scientific community and the public. The fossils of many large extinct species suggest they likely played important roles in ancient marine ecosystems, with their extinctions having a considerable impact on the evolution of major marine clades. For example, the giant extinct shark Otodus megalodon has been proposed to have transported nutrients across oceans, controlled the population of their prey, and potentially influenced the evolution of gigantism in cetaceans (Pyenson and Sponberg, Reference Pyenson and Sponberg2011; Pimiento and Clements, Reference Pimiento and Clements2014; Cooper et al., Reference Cooper, Hutchinson, Bernvi, Cliff, Wilson, Dicken, Menzel, Wroe, Pirlo and Pimiento2022). Hence, large-bodied extinct species likely play important ecological roles in ecosystems collectively and through deep timescales. However, to better understand the extinct marine megafauna, as well as their impact on maintaining ecosystems and evolutionary processes, it is fundamental to first distinguish them from other animal species. To do so, a body size definition applicable across clades is required.
Here, we propose a body size cut-off of 1 m of length to define the extinct marine megafauna. This definition is based on the fact that members of the extant marine megafauna are, in addition to being >45 kg, also ≥1 m when length is considered. For example, the smallest megafauna species today are the sea otter (Enhydra lutris), the emperor penguin (Aptenodytes forsteri) and the common ling (Molva molva), all of which can reach body lengths in excess of 1 m (Estes et al., Reference Estes, Heithaus, McCauley, Rasher and Worm2016; Pimiento et al., Reference Pimiento, Leprieur, Silvestro, Lefcheck, Albouy, Rasher, Davis, Svenning and Griffin2020). Although this definition is arbitrary and might not be universally applicable, it allows us to focus on a set of extinct taxa as a first step towards reaching a better understanding of the marine megafauna that lived in the geological past. We use length instead of other measurements such as mass to ensure the inclusion of as many extinct species as possible from the available literature, while also avoiding the introduction of biases and uncertainties in body mass calculations for extinct taxa.
The purpose of this review is to describe the diversity of extinct marine megafauna over the Phanerozoic. To do so, we reviewed the scientific literature for all known records of extinct marine animals equal to or >1 m in length. Following Estes et al. (Reference Estes, Heithaus, McCauley, Rasher and Worm2016), we exclude colonial-forming organisms and include taxa occurring in coastal and open oceans, which contain semi-aquatic animals (e.g. pinnipeds, sea turtles and sea birds). We use the data extracted from the literature to investigate patterns related to the ecology and extinction throughout the Phanerozoic.
Literature review
Data were gathered via a joint effort of experts on different taxonomic groups, and the students enrolled in the Marine Megafauna through Deep Time course (BIO 263) at the University of Zurich in the autumn semester of 2022. A list of extinct animals considered to be exceptionally large in their respective taxonomic groups was first compiled by experts (see author contributions). These lists were divided among student groups, each working on one of the following taxonomic groups: invertebrates; jawless fishes, placoderms, and bony fishes; chondrichthyans; reptiles (including birds); and marine mammals. The students were tasked with collecting relevant information for each animal on the list, which was then expanded by searching for additional taxa using Google Scholar (https://scholar.google.com) or specific journal websites using a variety of key words, such as ‘giant’, ‘large’, ‘fossil’, ‘extinct’, ‘marine’ in addition to key words relevant to each taxonomic group.
Five categories of information were collected – taxonomy, age range, maximum size reported, type of size measurement, and ecology (see below). Any taxon identified to taxonomic ranks above genus, or for which body size was unknown, was excluded. All data gathered for taxa identified to genus level were collected based on described specimens (e.g., the age of Ptychodus sp. is based on the specimen from which the maximum size was gathered). As such, genus-level taxa in our dataset do not represent the entire genera but the specimen from which maximum size was gathered (e.g., the Ptychodus sp. entry does not represent the entire Ptychodus genus). Taxon age ranges were obtained from literature and from the Paleobiology Database (https://paleobiodb.org, hereafter, PBDB), with the oldest and youngest record of each taxon entered to the best available resolution. All data and sources are included in Supplementary Material Data S1.
Body size data obtained from the literature were inferred from fossil specimens, with many of the values reported being estimates from scaling equations based on specific body parts, e.g., hind limb bone length in birds, or tooth size in sharks (Jadwiszczak, Reference Jadwiszczak2001; Perez et al., Reference Perez, Leder and Badaut2021). All body size data collected pertains to length, which in most cases, refers to the size from the tip of the head to the end of the body. However, length estimates were different for some taxonomic groups (Table 1). For example, in invertebrates and marine turtles, length was often directly measured from fossil remains representing the majority of the animal’s body, such as column length, shell diameters, maximum shell size and carapace lengths (Weems and Sanders, Reference Weems and Sanders2014; Ifrim et al., Reference Ifrim, Stinnesbeck, González González, Schorndorf and Gale2021). Fish body sizes were inferred using three types of length measurements – total length, standard length and fork length (see definitions in Table 1). In sea birds, length was inferred in terms of total swimming length or standing height (Table 1). In a few exceptional cases in marine reptiles, trunk length was used as a proxy (~raw total length) of body size. Although these specific taxa likely reached sizes much larger than their relative trunk length, we consider that including these data adds to the analysis despite the limited availability of total length data in published datasets. All the references used to collect size data are included in Supplementary Material Data S1. The lack of standardisation across measurements likely introduces significant noise to our comparisons across taxonomic groups. Nevertheless, they provide a faithful representation of the literature and therefore, the current state of knowledge for the different taxa.
Table 1. Types of body size measurements in each taxonomic group

The ecological information collected follows previous works (Pimiento et al., Reference Pimiento, Griffin, Clements, Silvestro, Varela, Uhen and Jaramillo2017, Reference Pimiento, Cantalapiedra, Shimada, Field and Smaers2019, Reference Pimiento, Leprieur, Silvestro, Lefcheck, Albouy, Rasher, Davis, Svenning and Griffin2020; Paillard et al., Reference Paillard, Shimada and Pimiento2021) and includes:
-
1. Guild, i.e., most common feeding mechanism:
-
- Macropredator, i.e., feeding mostly upon macroscopic organisms
-
- Micropredator, i.e., planktivorous
-
- Herbivore, i.e., feeding on plants
-
-
2. Vertical position, i.e., position in the water column where animals feed:
-
- Benthic, i.e., bottom on the ocean
-
- Pelagic, i.e., along the water column
-
- Benthopelagic
-
-
3. Habitat, i.e., lateral position where they live:
-
- Coastal, i.e., continental shelf, usually above 200 m of depth
-
- Oceanic, i.e., open ocean, usually below 200 m of depth
-
- Coastal and oceanic
-
We were able to collect inferred ecological data for most extinct megafaunal taxa. However, around 5% of taxa are missing guild data; 24% are missing data on vertical position, and 23% on habitat. Using a logistic regression approach to test for systematic missing values, we found no indication that missing data is non-randomly distributed (with p < 0.01 for all three traits). Invertebrates and birds are the only taxonomic groups without missing ecological data. Notably, among marine reptiles, 42% have unknown vertical positions and 35% lack habitat information. Unsurprisingly, Cenozoic taxa have more complete data overall than taxa from older time intervals (Supplementary Material Data S1). After data collection, the dataset was reviewed by experts to ensure validity of the data entries.
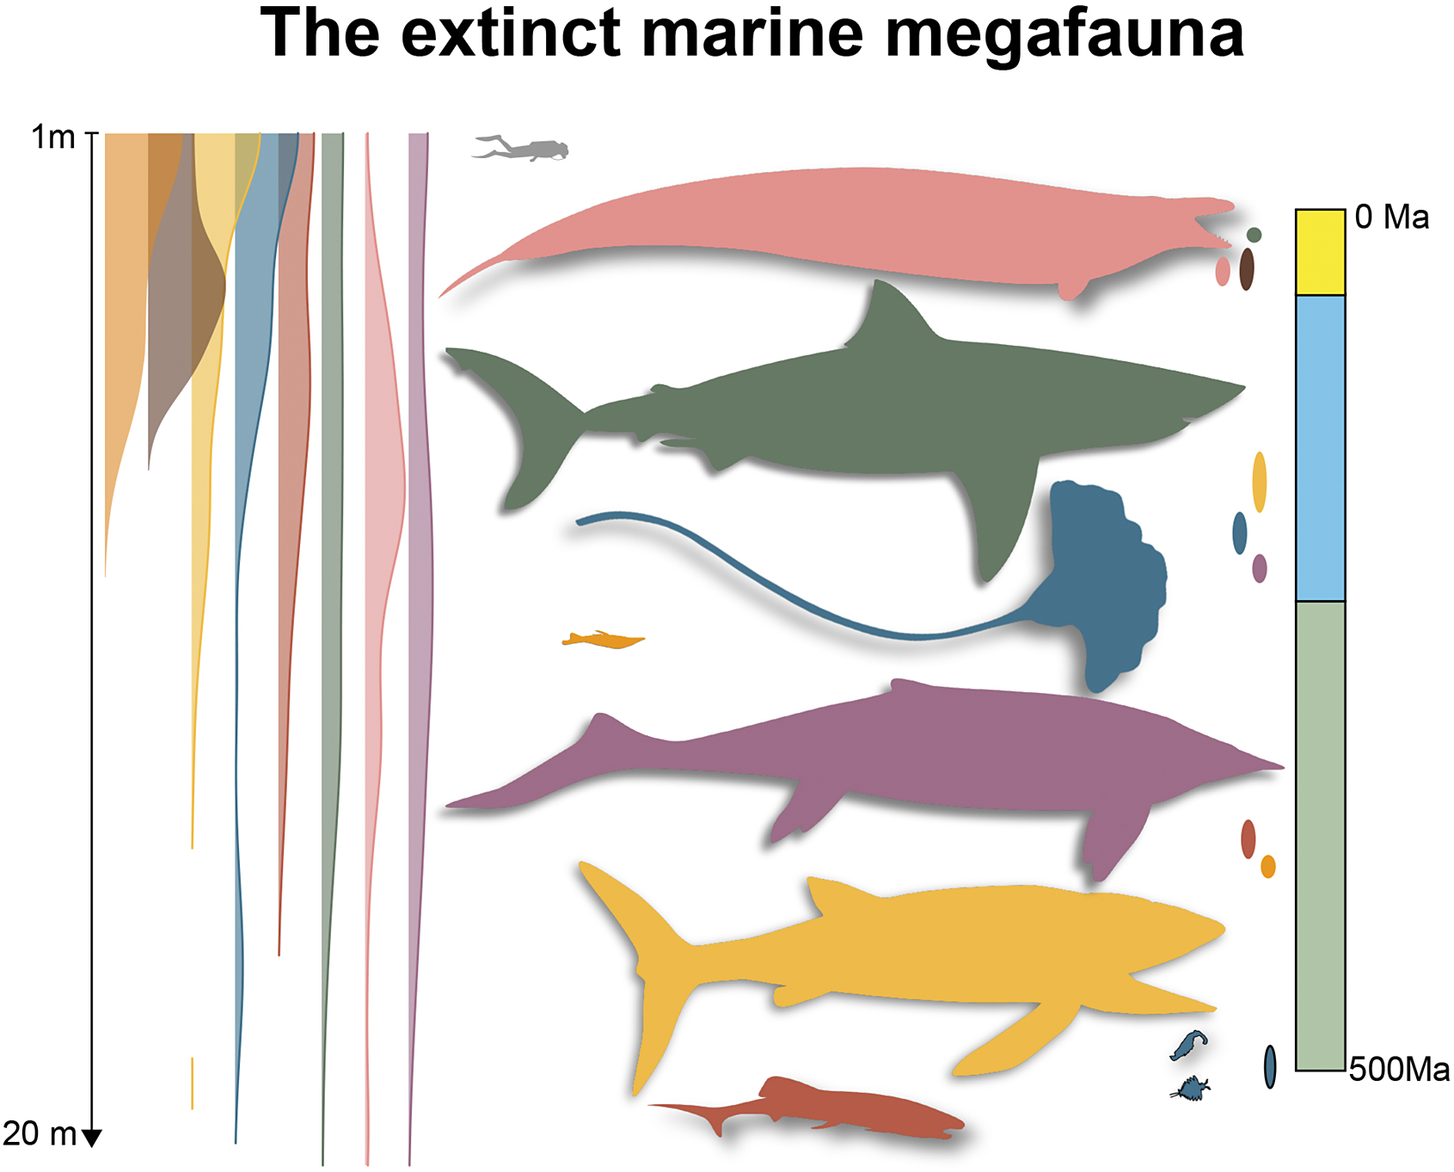
Our literature review reveals 706 extinct marine megafaunal taxa (defined here as extinct animals equal or exceeding 1 m of body length; Supplementary Material Data S1) belonging to the following taxonomic groups: invertebrates (7% of the total megafauna diversity); jawless fishes (0.7%), placoderms (7%), bony fishes (17%), chondrichthyans (12%); marine reptiles (38%); seabirds (2%); and marine mammals (17%). Most of the extinct marine megafauna taxa are identified to species level (93%). The earliest marine megafauna species are the 1-m-long Anomalocaris canadensis and Amplectobelua symbrachiata from the Cambrian (Cong et al., Reference Cong, Daley, Edgecombe and Hou2017; Daley and Budd, Reference Daley and Budd2010; Daley and Edgecombe, Reference Daley and Edgecombe2014; Figure 1). The largest size attained by any extinct marine megafauna sampled was 21 m by Shonisaurus sikanniensis, an oceanic, pelagic, macropredatory ichthyosaur from the Upper Triassic (Nicholls and Manabe, Reference Nicholls and Manabe2004; Figure 1). It is worth noting that this maximum size, despite being remarkable, remains at least 10 m smaller than the maximum size achieved by the largest marine animals in today’s ocean, the 31 m blue whale and the 36.6 m Lion’s Mane Jellyfish (McClain et al., Reference McClain, Balk, Benfield, Branch, Chen, Cosgrove, Dove, Gaskins, Helm, Hochberg, Lee, Marshall, McMurray, Schanche, Stone and Thaler2015). The second largest size was found to be 20 m, reached by three species: O. megalodon (Perez et al., Reference Perez, Leder and Badaut2021), a coastal, macropredatory, pelagic shark from the Neogene (Pimiento et al., Reference Pimiento, MacFadden, Clements, Varela, Jaramillo, Velez‐Juarbe and Silliman2016); by Basilosaurus cetoides, a Paleogene archaeocete with pelagic, coastal/oceanic habits (Swift and Barnes, Reference Swift and Barnes1996; Voss et al., Reference Voss, Antar, Zalmout and Gingerich2019); and Perucetus colossus, a coastal, benthic and presumably macropredatory early whale from the Eocene (Figure 1; Bianucci et al., Reference Bianucci, Lambert, Urbina, Merella, Collareta, Bennion, Salas-Gismondi, Benites-Palomino, Post, de Muizon, Bosio, Di Celma, Malinverno, Pierantoni, Villa and Amson2023). The next largest size was 18 m, reached by the pelagic macroraptorial sperm whale Livyatan melvillei from the Miocene, by Cymbospondylus youngorum, a pelagic, oceanic macropredatory ichthyosaur from the Middle Triassic (Lambert et al., Reference Lambert, Bianucci, Post, de Muizon, Salas-Gismondi, Urbina and Reumer2010; Voss et al., Reference Voss, Antar, Zalmout and Gingerich2019; Sander et al., Reference Sander, Griebeler, Klein, Juarbe, Wintrich, Revell and Schmitz2021), and by Basilosaurus isis, a pelagic macropredator with coastal/oceanic habits (Pyenson, Reference Pyenson2017; Voss et al., Reference Voss, Antar, Zalmout and Gingerich2019). The largest bony fish was Leedsichthys problematicus (16.5 m; fourth largest size; a pelagic, oceanic micropredator) and the largest invertebrate was Seirocrinus subangularis, a 15 m crinoid (fifth largest size; a coastal, pelagic micropredator), both from the Jurassic (Figure 1; Friedman et al., Reference Friedman, Shimada, Martin, Everhart, Liston, Maltese and Triebold2010; Hagdorn, Reference Hagdorn2016; Liston and Gendry, Reference Liston and Gendry2015; Liston et al., Reference Liston, Newbrey, Challands, Adams, Arratia, Schultze and Wilson2013). The largest placoderm was the 8 m Glyptaspis verrucosa from the Devonian, a benthic macropredator (Figure 1; Boylan and Murphy, Reference Boylan and Murphy1978; Sallan and Galimberti, Reference Sallan and Galimberti2015). Birds and jawless fishes occupy the lowest spectrum of body size ranges, with the largest maximum size being 2 m, which is reached by three penguins from the Eocene: Anthropornis sp., Palaeeudyptes klekowskii and Anthropornis nordenskjoeldi (Marples, Reference Marples1953; Stilwell and Zinsmeister, Reference Stilwell and Zinsmeister1992; Bargo and Reguero, Reference Bargo and Reguero1998; Jadwiszczak, Reference Jadwiszczak2001; Reguero et al., Reference Reguero, Marenssi and Santillana2012; Hospitaleche, Reference Hospitaleche2014); and two coastal micropredatory jawless fishes from the Devonian: Pycnosteus sp. and Tartuosteus sp.(Figure 1; Blieck et al., Reference Blieck, Karatajute-Talimaa and Mark-Kurik2002; Mark-Kurik, Reference Mark-Kurik2000; Moloshnikov, Reference Moloshnikov2001; Sallan and Galimberti, Reference Sallan and Galimberti2015). It is worth noting that potentially larger seabirds are known, for example, the 160 kg Kumimanu fordycei, which has been proposed to be the largest-known fossil penguin (Ksepka et al., Reference Ksepka, Field, Heath, Pett, Thomas, Giovanardi and Tennyson2023). However, given the lack of body length measurements available for this and potentially other birds, it was not included in our dataset.
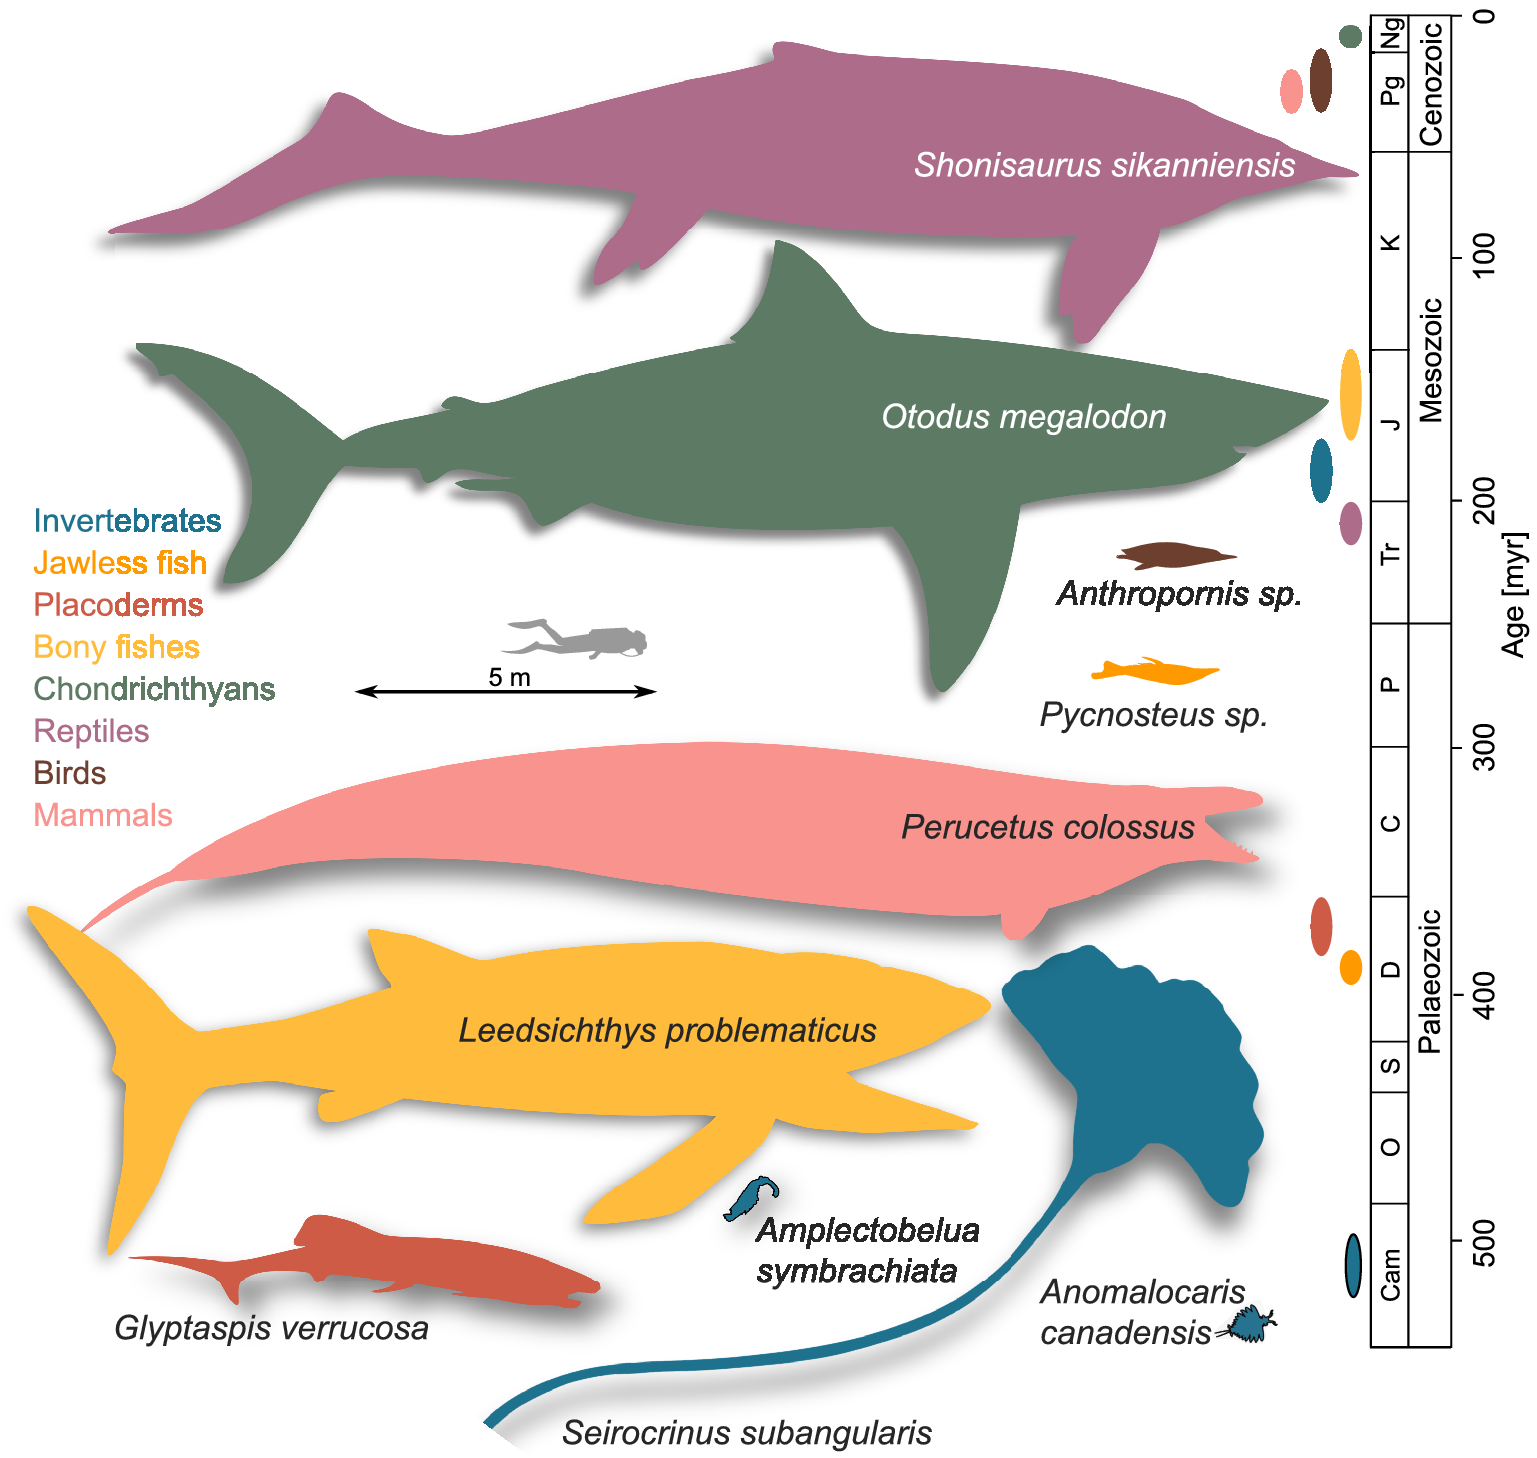
Figure 1. A graphical representation of the earliest and largest extinct marine megafaunal taxa. Colours denote the taxonomic group to which each taxon belongs to, which is also used in the geological timescale on the right to denote stratigraphic range. Animal shapes were downloaded from www.phylopic.org. Credits are as follows: Shonisaurus sikanniensis and Leedsichthys problematicus: Gareth Monger; Otodus megalodon: T. Michael Keesey; Perucetus colossus: Michael Tripoli. Remaining animal shapes have a Public Domain licence without copyright (http://creativecommons.org/licenses/by/3.0).
Representation in the Paleobiology Database
We assessed the current state of knowledge of the extinct megafauna taxa in the PBDB. Specifically, we quantified the number of occurrences of each taxon, both at the species and genus levels. To do so, we downloaded all occurrences from the PBDB while accounting for synonyms. This was achieved by contrasting identified vs. accepted names in the PBDB, thereby identifying the instances when megafauna taxa had multiple occurrences under different taxonomic names.
More than half of megafaunal taxa (523 taxa; 74%) are represented in the PBDB. Those identified to the genus level have 77% representation, whereas those identified to the species level have 74%. Around 28% of the extinct megafauna species only have one occurrence in the PBDB (i.e., singletons; Figure 2A). Placoderms are the least represented taxonomic group in the PBDB, with only 15% of their taxa having an occurrence. All birds, 91% of marine mammals, and 89% of marine reptiles have at least one occurrence in the PBDB. Over half of all chondrichthyan, jawless fish and bony fish megafauna have PBDB occurrences (66%, 60%, 56% of their taxa, respectively; Figure 2B). Chondrichthyan megafauna exhibits the highest number of occurrences in the PBDB overall (1,800 total occurrences), with O. megalodon having the highest number of occurrences (n = 289; Figure 2A).

Figure 2. Representation of extinct marine megafauna in the Paleobiology Database (PBDB) to capture their current state of knowledge. (A) Number of occurrences of each taxon. Each horizontal line (n = 523) represents a taxon (see text). X-axis is log-transformed. (B) Representation of taxonomic groups in PBDB showed as percentages relative to total number of megafaunal taxa in each group. Colours denote the taxonomic group to which each taxon belongs to in A and B. Animal shapes in B are those from Figure 1. (C) Sampling completeness rates for the extinct marine megafauna and the baseline dataset (extinct species with a body length < 1 m) as estimated using a capture–mark–recapture approach. Thick lines indicate the 55% credible interval for the sampling rate, whereas thin lines indicate the 95% interval.
It could be argued that the relatively high representation of the marine megafauna in the PBDB is due to their large size, which can increase detectability (Payne and Heim, Reference Payne and Heim2020). To assess whether the extinct marine megafauna was better sampled than the smaller counterpart (i.e., extinct non-megafauna of <1 m, hereafter ‘baseline’), we quantified sampling rates (i.e., probability for a taxon to be sampled when present in a given time bin) for both groups. The baseline group was assessed by downloading from the PBDB all species-level occurrences belonging to the genus of each megafaunal taxon but excluding the megafaunal species (>1 m). Therefore, each baseline species was extinct and assumed to have a body length < 1 m. We then used a capture–mark–recapture (CMR) approach, whereby each species was marked as either present or absent for each Phanerozoic stage using the Cormack–Jolly–Seber model (Cormack, Reference Cormack1964; Jolly, Reference Jolly1965; Seber, Reference Seber1965) with Markov Chain Monte Carlo sampling. We found that the fossil record of megafauna species is not better sampled than that of smaller body-sized species of the same genera, as baseline species showed an average sampling completeness of 0.06 per stage (95% credible interval (hereafter CI) = 0.03, 0.09) and the marine megafauna sampling completeness was, on average, 0.03 per Stage (95% CI = 0.02, 0.05; Figure 2C).
The extinct marine megafauna through the Phanerozoic
Representatives of the extinct marine megafauna are found in all geological eras and periods. The Palaeozoic encompasses 20% of the total diversity, the Mesozoic 52%, and the Cenozoic 28% (Figure 3A). Invertebrates, bony fishes, and chondrichthyans have extinct marine megafauna representation in all three eras; jawless fishes and placoderms are restricted to the Palaeozoic; non-avian reptile megafauna is only present in the Mesozoic and Cenozoic, and megafaunal representatives of seabirds and mammals are only present in the Cenozoic (Table 2; Figure 3A). Around half of the extinct marine megafauna occur in the Cretaceous (26%) or Neogene (15%; Figure 3A; Table 2). First Appearance Datums (FADs) and Last Appearance Datums (FADs) occur mostly in the Upper Cretaceous (20% of FADs, 21% of LADs) and the Miocene (13% of FADs, 11% of LADs; Table 3; Figure 3B). Invertebrates, bony fishes and chondrichthyans range through all geological eras. Jawless fish and placoderms only range through the Devonian. Birds and mammals range only through the Cenozoic, especially during the Eocene for birds, and the Miocene for marine mammals (Figure 3B and C). Most extinct marine megafauna (84%) have a LAD and FAD in the same Epoch (Figure 3C; Table 3). The mean stratigraphic range of the extinct marine megafauna is 3.5 million years (hereafter, myrs), with longest ranges being that of the shark Cretalamna appendiculata (Lower Cretaceous to Eocene, 82.6 myrs; Figure 3C; (Andrews et al., Reference Andrews, Long, Ahlberg, Barwick and Campbell2005; Albert et al., Reference Albert, Johnson and Knouft2009; Sallan and Coates, Reference Sallan and Coates2010)). Chondrichthyans, bony fishes and invertebrates are the taxonomic groups within the top 2.5% of taxa with the longest ranges (41–82.6 myrs; Figure 3C; Supplementary Material Data S2).

Figure 3. Extinct marine megafauna over time. (A) Number of taxa per taxonomic group and across geological eras. (B) Stratigraphic ranges of the different taxonomic groups (horizontal lines) and percentage of First Appearance Datums (FADs; green), Last Appearance Datums (LADs; grey) in each geological period shown in vertical bars. See Table 3 for details. (C) Stratigraphic ranges of individual taxa. Grey dashed lines delimit the geological eras. See Supplementary Material Data S2 for details.
Table 2. Extinct marine megafauna across geological periods

Table 3. First appearance datums (FADs) and last appearance datums (LADs) of extinct marine megafauna per geological epoch

The maximum body size recorded for most extinct marine megafauna range between 1 and 3 m, with sizes >10 m being rare among all taxonomic groups (Figure 4A). While the Mesozoic and Cenozoic display the full range of extinct megafauna sizes (1–21 m in the Mesozoic; 1–20 m in the Cenozoic), the Palaeozoic only displays half of the range, with the maximum size at up to 9 m (Endoceras giganteum, a cephalopod from the Ordovician; Figure 4B; Klug et al., Reference Klug, De Baets, Kröger, Bell, Korn and Payne2015). Overall, maximum size appears to increase over time across all extinct marine megafauna taxa, with a 1.8% increase, on average, every million-year (95% CI = 1.3%, 2.2%, p < 0.001; black line Figure 4B).

Figure 4. Body size patterns among the extinct marine megafauna. (A) Distribution of maximum body sizes per taxonomic group based on density estimates. Taxonomic groups are ordered by mean maximum body size, with the largest estimate at the top. Sample size (number of extinct megafaunal taxa per group) is shown at the right of each density curve. (B) Maximum body size of each taxon over time, whereby the mid-point of the stratigraphic range was used. The black line shows the average linear trend in maximum body size over time considering all taxonomic groups. (C) Average linear trends in body size per taxonomic group. In A and B, the asterisks indicate statistical significance; the numbers show the average increase in body size per every million-year; maximum body size is log-transformed and grey dashed lines delimit the geological eras.
Palaeozoic
During the Cambrian, only two taxa were found to be categorised as megafauna following our definition: A. canadensis and A. symbrachiata, both reaching 1 m (Figures 1 and 4B; Cong et al., Reference Cong, Daley, Edgecombe and Hou2017; Daley and Budd, Reference Daley and Budd2010; Daley and Edgecombe, Reference Daley and Edgecombe2014). During the Ordovician, the maximum body size for the entire Palaeozoic is reached (Figure 4B) with the possibly up to 9 m long nautiloid Endoceras giganteum (Klug et al., Reference Klug, De Baets, Kröger, Bell, Korn and Payne2015). Both the Cambrian and the Ordovician have only invertebrate megafauna (Figures 3B and C, 4B). Fish megafauna first appear in the Silurian, with the 1 m lobe-finned fish Megamastax amblyodus (Figures 3C, 4B; Choo et al., Reference Choo, Zhu, Zhao, Jia and Zhu2014). The Devonian is dominated by placoderms, jawless fish and lobe-finned fish megafauna. This is the period when the first chondrichthyan megafauna appear, the largest being the 3 m Cladoselache clarki (Figures 4B and C; Albert et al., Reference Albert, Johnson and Knouft2009). The marine megafauna of the Palaeozoic was composed mostly by coastal, benthic macropredators (Figure 5).

Figure 5. Ecological traits across geological eras. The number of taxa per taxonomic group and ecological trait, including counts where the ecological data is missing. (A) Guild, or most common feeding mechanism. (B) Vertical position, or distribution in the water column where animals feed. (C) Habitat, or lateral position where animals live.
Mesozoic
Non-avian reptilian megafauna first appeared in the Mesozoic and are the most common taxonomic group of this era (Figures 3B and C, 4B). During the first and shortest period of the Mesozoic, the Triassic, a remarkably 21-m-long ichthyosaur attains the largest-known body size of the Phanerozoic (S. sikanniensis; Figures 1, 4B). The Cretaceous, a transitional time in Earth’s history, is the interval with the greatest number of extinct marine megafauna taxa (n = 182; Figures 3C, 4B; Table 2). The presence of such a significant volume of megafauna could be related to the extent of epicontinental seas during this time (Barron, Reference Barron1983; Lagomarcino and Miller, Reference Lagomarcino and Miller2012) and possibly the development of higher trophic levels at the Mesozoic Marine Revolution (Vermeij, Reference Vermeij1977; Cortés and Larsson, Reference Cortés and Larsson2023). Invertebrates, bony fishes, chondrichthyans, and marine reptiles all have megafauna representatives across the Mesozoic (Figures 3B, 4C). The marine megafauna of the Mesozoic was significantly rich, mostly oceanic, with a large presence of pelagic macropredators (Figure 5).
Cenozoic
During the Cenozoic, megafaunal mammals and seabirds first appeared. Although marine mammals seem to have been the dominant group (Figure 3B), all marine megafauna taxonomic groups occur in the Cenozoic, except for jawless fishes and placoderms (Figures 3 and 4). Chondrichthyans and marine mammals display the largest sizes of the Cenozoic (20 m), peaking in the Neogene (Figure 4B). The Quaternary is the most taxon-depauperated interval, with only three extinct marine megafauna taxa occurring in this period, all of which are mammals: the Steller’s sea cow (Hydrodamalis gigas, 7 m), the otariid Proterozetes (6 m) and the odobenid Oriensarctos (3 m; Domning, Reference Domning1978; Mitchell, Reference Mitchell1968; Poust and Boessenecker, Reference Poust and Boessenecker2017; Sarko et al., Reference Sarko, Domning, Marino and Reep2010). The low diversity of the Quaternary is likely a sampling and/or preservation artefact, despite the extinction event of the Plio-Pleistocene (Pimiento et al., Reference Pimiento, Griffin, Clements, Silvestro, Varela, Uhen and Jaramillo2017), given that the fossil record of marine vertebrates seems to be particularly scarce during this time period (Valenzuela-Toro and Pyenson, Reference Valenzuela-Toro and Pyenson2019; Pimiento and Benton, Reference Pimiento and Benton2020). In addition, edge effects might have artificially reduced Quaternary diversity (Alroy, Reference Alroy1998; Foote, Reference Foote2000). The marine megafauna of the Cenozoic was mostly composed of coastal, pelagic macropredators (Figure 5), a continuing ecological trend since the Mesozoic.
The extinct marine megafaunal groups
Invertebrates
The invertebrate marine megafauna was more common in the geological past than in the present (48 extinct species vs. 5 extant species; Supplementary Material Data S1; Estes et al., Reference Estes, Heithaus, McCauley, Rasher and Worm2016) despite the fact that their diversity might be underestimated due to the poor preservation of soft-body organisms in the fossil record. The scarcity of invertebrates in the modern assemblage might be a result of the mass-based definition in Estes et al. (Reference Estes, Heithaus, McCauley, Rasher and Worm2016). The extinct invertebrate marine megafauna occurs in all geological eras and includes molluscs, echinoderms, arthropods, and segmented worms (phyla Mollusca, Echinodermata, Arthropoda, and Annelida; Figure 6). The greatest diversity of invertebrate megafauna taxa occurs in the Palaeozoic (Figure 3A). Invertebrate megafauna taxa have sizes between 1 and 3 m, with the largest size reached at 15 m by an echinoderm in the Mesozoic (S. subangularis; Figures 1, 4A and B, 6B; Hagdorn, Reference Hagdorn2016). This size is significantly smaller than that or the extant Lion’s mane jellyfish, which has been proposed to be 36.6 m long. However, this enormous size has not been confirmed (McClain et al., Reference McClain, Balk, Benfield, Branch, Chen, Cosgrove, Dove, Gaskins, Helm, Hochberg, Lee, Marshall, McMurray, Schanche, Stone and Thaler2015). Arthropod and annelid megafauna is only present in the Palaeozoic, echinoderm megafauna only in the Mesozoic, and mollusc megafauna in all three eras (Figure 6B). In general, body size increases over the Phanerozoic among the extinct invertebrate marine megafauna, with a 2.2% average increase every million-years (95% CI = 0.6%, 3.8%, p = 0.007; Figure 4C). The extinct invertebrate megafauna taxa are coastal, occupy both benthic and pelagic environments, and include micro- and macropredators (Table 4; Figure 5). Invertebrates are the only group that contains sessile taxa, which belong to Bivalvia and Crinoidea.

Figure 6. Major clades within the extinct marine megafauna taxonomic groups. (A) The number of taxa per clade within taxonomic groups, whereby the maximum body size of each clade is depicted by the point size. (B) Presence of each megafaunal clade across geological eras where the size of the points depicts the maximum body size, and the coloured surrounding ring represents the corresponding era. No point means that the clade is not occurring in that geological era. *Here, the clade Archosauromorpha only refers to early branching taxa and excludes Paracrocodylomorpha.
Table 4. Ecological traits across the taxonomic groups of extinct marine megafauna

Note: Bold denotes highest values per trait.
Bony fishes
Extinct marine megafaunal bony fishes include 122 taxa (Supplementary Material Data S1), which is comparable with the number of megafauna species today: 133 species (Estes et al., Reference Estes, Heithaus, McCauley, Rasher and Worm2016). Both in the past and today, bony fishes represent one of the most species-rich marine megafaunal group (Figures 3A). The extinct marine bony fish megafauna includes ray-finned fish (Actinopterygii) and lobed-finned fish (Sarcopterygii), although it is mostly represented by Actinopterygii (Figure 6). The earliest bony fish megafaunal species appeared in the Silurian (Megamastax amblyodus (1 m); Figures 3B and C, 4B; (Choo et al., Reference Choo, Zhu, Zhao, Jia and Zhu2014)). Interestingly, the coelacanth Latimeria chalumnae is part of today’s marine megafauna (Estes et al., Reference Estes, Heithaus, McCauley, Rasher and Worm2016), despite marine sarcopterygians being absent from the Cenozoic megafauna assemblage (Figure 6B). The highest number of megafaunal bony fish taxa lived in the Mesozoic (Figure 3A), with the Cenozoic only having actinopterygian representatives (Figure 6B). Most of the extinct bony fish megafauna were between 1 and 2 m (Figure 4A), with the maximum body size at 16.5 m, reached by an actinopterygian in the Mesozoic (L. problematicus; Figures 4A and B; Liston et al., Reference Liston, Newbrey, Challands, Adams, Arratia, Schultze and Wilson2013). Fish body size does not display a trend over time (0.6% on average per million-year, p = 0.12; Figure 4C). Extinct bony fish megafauna taxa were coastal or oceanic, pelagic macropredators (Table 4).
Jawless fishes and placoderms
Extinct marine megafaunal jawless fishes (‘Agnatha’) include five species, and are restricted to the Palaeozoic era, specifically the Devonian (Figure 3). Jawless megafaunal fish reached a maximum body size of 2 m (Pycnosteus sp. and Tartuosteus sp.) and are coastal, benthic micropredators (Table 4, Figure 5). There are no extant representatives of jawless fishes among the modern megafauna (Estes et al., Reference Estes, Heithaus, McCauley, Rasher and Worm2016). Indeed, surviving lampreys and hagfishes rarely exceed 1 m in length (Froese and Pauly, Reference Froese and Pauly2017). Armoured fishes, the extinct placoderms, include 48 megafaunal species, all restricted to the Palaeozoic era, specifically the Devonian (Figure 3B). They include the clades Arthrodira, Ptyctodontida, Antiarchi, Phyllolepida and Rhenanida, with Arthrodira having the highest number of taxa (Figure 6). Megafaunal placoderms were mostly 1 m of size, coastal, benthic and macropredators (Figures 5, 7, Table 4). They reached a maximum body size of 8 m (G. verrucosa; Figure 1; Sallan and Galimberti, Reference Sallan and Galimberti2015) and do not display a significant trend in body size over time (8% on average per million-year, p = 0.21; Figure 4C).

Figure 7. Distribution of ecological traits (guild, position in the water column, and habitat) for the extinct marine megafauna assemblage. (A) The relative frequency of each ecological trait per taxonomic group as percentage. (B) The log-transformed maximum body size in metre per taxon over time and per ecological trait. The mid-point of the stratigraphic range for each taxon was used to plot the maximum body size. Grey dashed lines depict boundaries between eras.
Chondrichthyans
The extinct chondrichthyan marine megafauna includes spiny sharks (†Acanthodii), chimaeras (Holocephali), rays and skates (Batoidea), and sharks (Selachimorpha; Figure 6). Overall, there are 81 chondrichthyan megafaunal taxa, the vast majority being represented by sharks (67%; Figure 6). This diversity is higher than today, when 69 chondrichthyan species are part of the global marine megafauna (Estes et al., Reference Estes, Heithaus, McCauley, Rasher and Worm2016). Chondrichthyan marine megafauna ranged through the entire Phanerozoic (Figure 3). However, the stem-chondrichthyan †Acanthodii, as well as †Ctenacanthiformes and †Phoebodontiformes, are exclusively present in the Palaeozoic. Holocephali is present in both the Palaeozoic and Mesozoic, Batoidea in both the Mesozoic and Cenozoic (Figure 6), and Selachimorpha occurs in all three eras (Figures 3A, 6B). Within the chondrichthyan extinct megafauna, body size appears to increase over time, with increases of 2.8% per million-year on average (95% CI = 1.6%, 4%, p < 0.001; Figure 4C). The earliest chondrichthyan megafauna taxa appear in the Lower Devonian (Machaeracanthus bohemicus (2 m), Machaeracanthus hunsrueckianum (1.5 m), and Machaeracanthu sulcatus (1 m); Figures 3B and C) and are all acanthodians (Südkamp and Burrow, Reference Südkamp and Burrow2007; Botella et al., Reference Botella, Martínez-Pérez and Soler-Gijón2012; Sallan and Galimberti, Reference Sallan and Galimberti2015). The largest-known chondrichthyan species is the 20 m O. megalodon, a gigantic megatooth shark from the Cenozoic (Figures 4A and B; Perez et al., Reference Perez, Leder and Badaut2021). Extinct chondrichthyan megafauna occupy all vertical positions and habitats and are mostly coastal, pelagic macropredators (Table 4, Figures 5, 7).
Marine reptiles
Among the extinct marine megafauna, reptiles include early branching Archosauromorpha, Paracrocodylomorpha, †Ichthyosauromorpha (ichthyosaurs), Pantestudines (e.g., marine turtles), †Sauropterygia (plesiosaurs, placodonts and relatives), and Lepidosauromorpha (specifically Squamata, i.e., mosasaurs and sea snakes). Overall, there are 266 extinct marine megafauna taxa that are reptiles, which makes them the group with highest number of taxa, most of them occurring in the Mesozoic and none in the Palaeozoic (Figure 2A). This diversity is much higher than that of today, as only seven non-avian reptilian species are part of the modern marine megafauna (Estes et al., Reference Estes, Heithaus, McCauley, Rasher and Worm2016). Indeed, most reptilian marine megafauna clades are entirely extinct today (Figure 6A). †Sauropterygia hold the highest number of reptilian marine megafauna taxa (Figure 6A). †Sauropterygia, †Ichthyosauromorpha and early branching Archosauromorpha are absent from the Cenozoic (Figure 6B). The earliest reptilian megafauna species appears in the Lower Triassic (Utatsusaurus hataii (2.6 m); Sclerocormus parviceps (1.6 m); Parvinatator wapitiensis (1 m); Grippia longirostris (1 m); Eretmorhipis carrolldongi (1 m); and Corosaurus alcovensis (1.6 m)) and the maximum size is reached in the Upper Triassic by the 21 m S. sikanniensis (Figure 4B; Motani, Reference Motani1996; Nicholls and Manabe, Reference Nicholls and Manabe2004; Scheyer et al., Reference Scheyer, Romano, Jenks and Bucher2014). This remarkable size is extreme, as other large-bodied ichthyosaurs such as C. youngorum, Himalayasaurus tibetensis, S. popularis and Temnodontosaurus sp. are estimated to have reached 18 m (C. youngorum) and 15 m, respectively. Most extinct reptilian megafauna are between 1 and 5 m (Figure 4A), with body size appearing to increase over time, specifically displaying 4.3% increases, on average, every million-year (95% CI = 2.9%, 5.7%, p < 0.001; Figure 4C). Representatives of the extinct non-avian reptilian megafauna are mostly oceanic, pelagic macropredators, although this is the group with most missing ecological data (Table 4, Figures 5, 7).
Birds
Seabirds are the least rich group of extinct marine megafauna, with only 17 species reaching ≥1 m. This group is represented by a single order, Sphenisciformes (total-clade penguins), which are only present in the Cenozoic (Figures 3A, 6B). The number of extinct seabirds is likely to be underrepresented under our definition of megafauna, as body mass, and not length, is usually used to size extinct birds (Field et al., Reference Field, Lynner, Brown and Darroch2013). Nevertheless, the past diversity of avian marine megafauna largely surpasses that of today, when only one seabird is part of the global assemblage (A. forsteri; Estes et al., Reference Estes, Heithaus, McCauley, Rasher and Worm2016). The earliest bird megafauna appeared in the Palaeocene (Crossvallia unienwillia (1.4 m), Kumimanu biceae (1.7 m) and Waimanu manneringi (1.2 m); Figures 4B (Tambussi et al., Reference Tambussi, Reguero, Marenssi and Santillana2005; Slack et al., Reference Slack, Jones, Ando, Harrison, Fordyce, Arnason and Penny2006; Mayr et al., Reference Mayr, Scofield, De Pietri and Tennyson2017; Giovanardi et al., Reference Giovanardi, Ksepka and Thomas2021)). All extinct avian megafauna is between 1 and 2 m (Figure 4A), and are coastal, pelagic macropredators (Figure 5A).
Mammals
There are 119 mammals that are part of the extinct marine megafauna, a diversity coincidently identical to today’s mammalian marine megafauna (119 species; Estes et al., Reference Estes, Heithaus, McCauley, Rasher and Worm2016; Pimiento et al., Reference Pimiento, Leprieur, Silvestro, Lefcheck, Albouy, Rasher, Davis, Svenning and Griffin2020). As such, marine mammals, which only occur in the Cenozoic, are the third richest taxonomic group of extinct marine megafauna after reptiles and bony fishes (Figure 3A). Extinct marine megafaunal mammals include carnivores (Carnivora), cetaceans (Cetacea), desmostylians (†Desmostylia), sea cows (Sirenia) and xenarthrans (Xenarthra). Cetaceans and carnivorans display the greatest number of taxa (Figure 6A). Most marine mammals that are part of the extinct marine megafauna range between 1 and 3 m in maximum body size (Figure 4A), with the largest species being P. colossus and B. cetoides, both reaching 20 m in the Eocene, which is the earliest recorded age when marine megafaunal mammals first appeared (Figures 1, 3B, 4B; Bianucci et al., Reference Bianucci, Lambert, Urbina, Merella, Collareta, Bennion, Salas-Gismondi, Benites-Palomino, Post, de Muizon, Bosio, Di Celma, Malinverno, Pierantoni, Villa and Amson2023; Blanckenhorn, Reference Blanckenhorn1900; Voss et al., Reference Voss, Antar, Zalmout and Gingerich2019). The mammalian extinct marine megafauna showed no significant trend in size over time (−10.3% on average per million-year, p = 0.93; Figure 4C) and were mostly coastal, pelagic macropredators (Figures 5 and 7).
The ecological roles of the extinct marine megafauna
The vast majority of extinct marine megafauna (from which guild data was collected) are macropredators (i.e., consuming macroscopic organisms; 88%), with all six major megafaunal groups having macropredatory representatives distributed throughout the entire Phanerozoic (Figure 7A). Notably, macropredators include the taxa with extreme sizes (Figure 7B), including the 21-m-long S. sikanniensis, which despite not having teeth as adults, it has been inferred to feed upon cephalopods and fish, and to lack of filter-feeding structures (Motani, Reference Motani1996; Nicholls and Manabe, Reference Nicholls and Manabe2004). Herbivory is the least common guild among extinct marine megafauna (3%) and is occupied by mammals no larger than 10 m in the Cenozoic (sirenians, desmostylians and xenanthras), and by a single 3 m non-avian reptile (Atopodentatus unicus) from the Triassic (Cheng et al., Reference Cheng, Chen, Shang and Wu2014). Thus, this guild is absent from the Palaeozoic (Figures 5A and 7). Micropredators (i.e., planktivorous) represent 9% of the extinct marine megafauna diversity, include representatives from all taxonomic groups, except birds and reptiles, and are distributed throughout the entire Phanerozoic (Figures 5A and 7). While micropredators are not common among the most extreme sizes, there are some large (>10 m) representatives, including the bony fish L. problematicus (16.5 m; Jurassic Friedman et al., Reference Friedman, Shimada, Martin, Everhart, Liston, Maltese and Triebold2010; Liston et al., Reference Liston, Newbrey, Challands, Adams, Arratia, Schultze and Wilson2013), the crinoid S. subangularis (15 m; Jurassic; Hagdorn, Reference Hagdorn2016; Zmarzly, Reference Zmarzly1985) and the cetacean Pelocetus sp. (12 m; Neogene; Figure 7B; Bisconti et al., Reference Bisconti, Pellegrino and Carnevale2021; Coombs et al., Reference Coombs, Felice, Clavel, Park, Bennion, Churchill, Geisler, Beatty and Goswami2022). Nevertheless, unlike the present time when the largest sizes are reached by micropredators (e.g., baleen whales; 30 m; Estes et al., Reference Estes, Heithaus, McCauley, Rasher and Worm2016; Goldbogen et al., Reference Goldbogen, Cade, Wisniewska, Potvin, Segre, Savoca, Hazen, Czapanskiy, Kahane-Rapport and DeRuiter2019), in the deep time, the largest sizes were reached by macropredators (20–21 m; S. sikanniensis, O. megalodon, P. colossus and B. cetoides; Nicholls and Manabe, Reference Nicholls and Manabe2004; Perez et al., Reference Perez, Leder and Badaut2021; Voss et al., Reference Voss, Antar, Zalmout and Gingerich2019.
More than 54% of the extinct marine megafauna (from which vertical position data was collected) is exclusively pelagic (i.e., feeding along the water column), with this vertical position being present throughout the Phanerozoic and across all sizes (Figures 5B and 7). Exclusively benthic taxa (i.e., feeding on the bottom of the ocean) comprise 17% of the diversity, which is spread out across the Phanerozoic. The largest exclusively benthic representatives are the cetacean P. colossus (20 m; Bianucci et al., Reference Bianucci, Lambert, Urbina, Merella, Collareta, Bennion, Salas-Gismondi, Benites-Palomino, Post, de Muizon, Bosio, Di Celma, Malinverno, Pierantoni, Villa and Amson2023) and the placoderm G. verrucosa (8 m; Boylan and Murphy, Reference Boylan and Murphy1978; Sallan and Galimberti, Reference Sallan and Galimberti2015). Benthopelagic taxa comprise only 6% of the total diversity and are mostly represented by chondrichthyans and mammals, with reptiles and bony fishes having one benthopelagic taxon each (Figure 7A). This vertical position is largely absent from the Palaeozoic assemblage, with only one taxon from the Devonian being benthopelagic (Cladoselache clarki; Figure 5A).
Around half of the extinct marine megafauna (from which habitat data was collected) lived in coastal environments (i.e., along the continental shelf, usually <200 m of depth; 44% exclusively coastal), with this habitat being represented in all taxonomic groups (Figures 5C and 7A). Although this might be a result of near-shore environments being better preserved than oceanic habitats in the fossil record (Dominici et al., Reference Dominici, Danise and Benvenuti2018), shallow-waters are also considered a cradle of evolution likely supporting great biodiversity both in deep time and today, especially for the marine megafauna (Pimiento et al., Reference Pimiento, Griffin, Clements, Silvestro, Varela, Uhen and Jaramillo2017; Pimiento, Reference Pimiento2018; Sallan et al., Reference Sallan, Friedman, Sansom, Bird and Sansom2018; Pimiento et al., Reference Pimiento, Leprieur, Silvestro, Lefcheck, Albouy, Rasher, Davis, Svenning and Griffin2020). Oceanic megafauna (i.e., exclusively living in the open ocean; usually >200 m of depth) represents 26% of the total diversity, includes all taxonomic groups but jawless fishes and birds, and the largest currently known extinct marine taxon of the Phanerozoic (S. sikanniensis, 21 m; Figures 5, 7). However, the next largest sizes occur in other habitats (O. megalodon, 20 m, coastal; B. cetoides 20 m, coastal/oceanic; and P. colossus 20 m, coastal; Figure 7B). Only 7% of the extinct marine megafauna lived in both coastal and oceanic habitats and include a variety of bony fishes, chondrichthyans, reptiles and mammals (Figure 7A).
Overall, the extinct marine megafauna was mostly macropredatory, living in coastal habitats and feeding in the water column (i.e., ‘pelagic’; Figure 7A). This is similar to the modern assemblage, except that most modern megafaunal species are benthic (Pimiento et al., Reference Pimiento, Leprieur, Silvestro, Lefcheck, Albouy, Rasher, Davis, Svenning and Griffin2020). However, our results, especially the lack of benthopelagic and coastal/oceanic ecologies, likely represent an artefact given the number of missing ecological data, especially in marine reptiles which is the most species-rich group of the extinct assemblage.
Were marine megafaunal species more prone to extinction than smaller species?
Today, large-bodied marine species are more vulnerable to extinction than smaller species (Olden et al., Reference Olden, Hogan and Zanden2007; Harnik et al., Reference Harnik, Lotze, Anderson, Finkel, Finnegan, Lindberg, Liow, Lockwood, McClain, McGuire, O’Dea, Pandolfi, Simpson and Tittensor2012; McCauley et al., Reference McCauley, Pinsky, Palumbi, Estes, Joyce and Warner2015; Payne et al., Reference Payne, Bush, Heim, Knope and McCauley2016). Using the novel dataset collected for this study, we tested whether this was the case in the geological past by modelling extinction risk in marine megafauna and comparing it with that of baseline species. To do this, we used occurrences downloaded from the PBDB at the species level (see above). We identified the FADs and LADs for each megafauna and baseline taxon, which we then binned into geological stages (Gradstein et al., Reference Gradstein, Ogg, Schmitz and Ogg2020). Taxa confined to a single stage were excluded as they tend to produce undesirable distortions of the fossil record (Foote, Reference Foote2000). We then modelled the extinction risk for each taxon using a hierarchical Bayesian generalised model with a binomial family link using the brms R package (Bürkner, Reference Bürkner2017). The LAD of each taxon was coded as ‘extinction’ and occurrences in geologic stages between FADs and the LADs as ‘survival’. As such, this approach assumes FADs and LADs are equivalent to species’ origination and extinction times. We regressed this binomial extinction/survival response against the group identity (i.e., megafauna vs. baseline) allowing for a mixed-effects trend, thereby estimating the average extinction risk for each group in every time interval. We also allowed this average extinction risk to vary between taxonomic groups by setting a random effect. We used flat priors on each parameter as the amount of data was high (3.055 extinction/ survival responses), allowing the likelihood to dominate the posterior samples.
We found the extinction risk of species belonging to megafauna to be similar to that of baseline species (Figure 8A), in agreement with a previous study at genus level (Payne and Heim, Reference Payne and Heim2020). Specifically, the baseline group showed an average extinction risk of 36.8% (95% CI = 25%, 51%) across all geological stages, while megafauna species had an average extinction risk of 36.5% (95% CI = 17%, 56%). This result is robust across all studied taxonomic groups; however, baseline birds and chondrichthyans showed slightly higher extinction risk than megafauna taxa (birds = 2.4% higher risk, 95% CI = 2%, 5%; chondrichthyans = 8% higher risk. 95% CI = 6%, 9%). We found this signal of equal risk for megafauna and baseline taxa to be robust across the whole Phanerozoic (Figure 8B). Our findings are unlikely to be biased by size-based sampling differences (Payne and Heim, Reference Payne and Heim2020), as our CMR analyses indicate that the fossil record for megafauna species is not more complete compared to baseline species (Figure 2C). Overall, our results from the geological past contrast with the present time where marine megafauna is particularly at risk (Dulvy et al., Reference Dulvy, Sadovy and Reynolds2003; Dulvy et al., Reference Dulvy, Fowler, Musick, Cavanagh, Kyne, Harrison, Carlson, Davidson, Fordham, Francis, Pollock, Simpfendorfer, Burgess, Carpenter, Compagno, Ebert, Gibson, Heupel, Livingstone, Sanciangco, Stevens, Valenti and White2014; McCauley et al., Reference McCauley, Pinsky, Palumbi, Estes, Joyce and Warner2015; Payne et al., Reference Payne, Bush, Heim, Knope and McCauley2016; Dulvy et al., Reference Dulvy, Simpfendorfer, Davidson, Fordham, Bräutigam, Sant and Welch2017; Pacoureau et al., Reference Pacoureau, Rigby, Kyne, Sherley, Winker, Carlson, Fordham, Barreto, Fernando, Francis, Jabado, Herman, Liu, Marshall, Pollom, Romanov, Simpfendorfer, Yin, Kindsvater and Dulvy2021), further supporting the idea that the extinction drivers acting over deep time are different to those acting in the Anthropocene (Harnik et al., Reference Harnik, Lotze, Anderson, Finkel, Finnegan, Lindberg, Liow, Lockwood, McClain, McGuire, O’Dea, Pandolfi, Simpson and Tittensor2012; Payne et al., Reference Payne, Bush, Heim, Knope and McCauley2016).

Figure 8. Extinction selectivity of marine megafauna compared with non-megafauna species (i.e., baseline, taxa that belong to the same genus as the extinct megafauna, but that are < 1 m). (A) The extinction risk for fossil taxa as estimated by a Bayesian generalised linear mixed-effects model. Points show the average extinction risk for each taxonomic group, and lines the 95% Credible Interval. (B) Extinction selectivity over time on a logit scale for each megafauna group as estimated by the Bayesian model. Positive values indicate an extinction selectivity towards baseline taxa and negative values preferential extinction of megafauna taxa. Thick coloured lines depict the average trend per taxonomic group and the shaded area the corresponding 95% Credible Interval. Logit values are defined as the logarithm of the extinction probability for megafaunal taxa divided by the extinction probability for baseline taxa.
It is worth noting, however, that our results are not conclusive because: (a) the FADs and LADs do not necessarily indicate true times of origination and extinction (Silvestro et al., Reference Silvestro, Salamin and Schnitzler2014a; Silvestro et al., Reference Silvestro, Schnitzler, Liow, Antonelli and Salamin2014b), and (b) our occurrence data from PBDB does not represent a comprehensive account of all known occurrences of the marine fauna of the Phanerozoic. Still, our work is the first to explicitly define marine megafauna in geological time and assemble a comprehensive dataset of megafauna taxa. While preliminary, our findings provide a first step towards elucidating the potential differences between the extinction mechanisms of megafauna and non-megafauna (baseline) species.
Concluding remarks and future directions
We defined the marine megafauna in deep time and listed 706 extinct taxa based on an exhaustive literature review. The extinct marine megafauna is fairly well-represented in the PBDB; however, our resampling analyses suggest that they are not better known in the paleontological literature than their smaller counterparts (Figure 2). Overall, the extinct marine megafauna is dominated by reptiles, as they represent one quarter of total diversity and includes the largest species (Figures 1–3). This finding contrasts with today’s assemblage, in which marine reptiles are a minority and occupy the small end of the body size distribution (Estes et al., Reference Estes, Heithaus, McCauley, Rasher and Worm2016; Pimiento et al., Reference Pimiento, Leprieur, Silvestro, Lefcheck, Albouy, Rasher, Davis, Svenning and Griffin2020). The Mesozoic era (a.k.a., the ‘Age of Reptiles’) stands out for hosting >40% of the extinct megafaunal taxa, and the largest body size (S. sikanniensis, 21 m; Figures 1–4). However, body size among the extinct marine megafauna tends to increase over time across the Phanerozoic, with iconic gigantic sharks and cetaceans in the Neogene, including O. megalodon, P. colossus, B. cetoides and L. melvillei (Figures 1, 4). Similar to the modern assemblage, most extinct marine megafauna are coastal macropredators (Figures 5, 7). Unlike today (Dulvy et al., Reference Dulvy, Sadovy and Reynolds2003, Dulvy et al., Reference Dulvy, Fowler, Musick, Cavanagh, Kyne, Harrison, Carlson, Davidson, Fordham, Francis, Pollock, Simpfendorfer, Burgess, Carpenter, Compagno, Ebert, Gibson, Heupel, Livingstone, Sanciangco, Stevens, Valenti and White2014, McCauley et al., Reference McCauley, Pinsky, Palumbi, Estes, Joyce and Warner2015, Payne et al., Reference Payne, Bush, Heim, Knope and McCauley2016, Dulvy et al., Reference Dulvy, Simpfendorfer, Davidson, Fordham, Bräutigam, Sant and Welch2017, Pacoureau et al., Reference Pacoureau, Rigby, Kyne, Sherley, Winker, Carlson, Fordham, Barreto, Fernando, Francis, Jabado, Herman, Liu, Marshall, Pollom, Romanov, Simpfendorfer, Yin, Kindsvater and Dulvy2021), the marine megafauna from the past does not seem to have higher extinction risk than their smaller counterparts (Figure 8). However, these results are preliminary and more comprehensive examinations are warranted to assess shifts in extinction risk through geologic time.
Although our list of extinct marine megafaunal taxa is comprehensive for the most part, temnospondyl amphibians are yet to be included and, despite our efforts, the list of bony fishes is likely missing some species. To gain a better understanding of the extinction mechanisms influencing the marine megafauna throughout geological history, it is fundamental to compile a comprehensive occurrence dataset of all extinct marine megafauna taxa so that accurate times of origination and extinction can be estimated (Silvestro et al., Reference Silvestro, Schnitzler, Liow, Antonelli and Salamin2014b). Importantly, to improve our knowledge regarding body-size patterns and the ecological roles of the extinct marine megafauna over the Phanerozoic, it is essential to fill the gaps in our current dataset, particularly in terms of the habitat and vertical position in the water column of many anatomically diverse taxa, such as marine reptiles (Figure 5). Expanding our understanding of taphonomic processes and biases of the extinct marine megafauna is therefore critical to strengthening our ecological interpretations. Other life-history and ecological traits such as metabolism (e.g., thermoregulation capabilities) and reproductive strategies could further provide a more complete picture of the functional diversity of the marine megafauna through deep time. A better-informed picture of what constitutes megafauna in deep time and its macroevolutionary patterns can be achieved by the standardisation of the array of measurements reported in the literature (e.g., biovolume (Payne et al., Reference Payne, Boyer, Brown, Finnegan, Kowalewski, Krause, Lyons, McClain, McShea, Novack-Gottshall, Smith, Stempien and Wang2009), and by using and/or adopting methodologies that consider parameters such as lateral body surface area to provide better proxies for body size.
Open peer review
To view the open peer review materials for this article, please visit http://doi.org/10.1017/ext.2024.12.
Supplementary material
The supplementary material for this article can be found at http://doi.org/10.1017/ext.2024.12.
Data availability statement
The data collected in this study is included as Supplementary Material (Data S1). All code used to conduct the analyses of this work are available at https://github.com/Pimiento-Research-Group/marine_megafauna_extinction. This is the Paleobiology Database publication number 489.
Author contribution
C.P. designed the study, performed exploratory analyses and led the writing. K.K. coordinated the data gathering and collected data. G.H.M. analysed the data and created figures with input from C.P. T.A., E.A.C., J.A.C., D.C., D.F., C.K., K.K., T.M.S. and A.V.T. (clade experts) collected the initial set of data and checked student-collected data. K.K., G.H.M., J.A.C., A.M.G., E.I. and D.S. collated ecological data. T.B., M.G., A.M.G.,. P.H.,. G.J., S.K., S.M., I.M., S.R., E.R., M.R., S.S., C.S., N.S., V.S. (the students) collected additional data from literature. J.B., J.R. and J.A.V. checked and harmonised the student-collected data. E.I., K.C.K., J.R., D.S. and C.Z. filled data gaps. L.F. and L.J.G. curated and harmonised the references. K.K., G.H.M., T.A., E.A.C., D.C., D.F., C.K., T.M.S. and A.V.T. provided input on different versions of this manuscript.
Financial support
This project was funded by a PRIMA grant (no. 185798) from the Swiss National Science Foundation to CP. TA was supported by a research fellowship from the Alexander von Humboldt Foundation. DC was supported by McGill University’s Graduate Mobility Award 2023 and the Smithsonian Tropical Research Institute, the Anders Foundation, the 1923 Fund, and Gregory D. and Jennifer Walston Johnson.
Competing interest
The authors declare no conflict of interest.


 Open access
Comments
Dear Editor,
We hereby submit our manuscript entitled: The extinct marine megafauna of the Phanerozoic for consideration at Cambridge Prisms: Extinctions.
The marine megafauna is known to play important ecological roles over different timescales and includes many charismatic species. Here, for the first time, we propose a definition for the marine megafauna that can be applied to the fossil record. Based on this definition, we review the paleontological literature and list the species that constitute the extinct marine megafauna in the geological past, to then explore their ecological and evolutionary patterns over time.
We found 602 extinct taxa belonging to eight main groups. This fauna was found to be fairly represented in the Paleobiology Database; however, resampling analyses suggest that they are not better known in the paleontological literature than their smaller counterparts. Overall, the extinct marine megafauna is dominated by non-avian reptiles, in great contrasts with today’s assemblage. The Mesozoic stands out for hosting over 40% of the extinct megafaunal taxa, and the largest size recorded (21 m). However, body size among the extinct marine megafauna tends to increase over time across the Phanerozoic, with iconic, gigantic sharks and cetaceans in the Neogene. Similar to today’s assemblage, most extinct marine megafauna are coastal macropredators. However, unlike today, the marine megafauna from the past does not seem to have higher extinction risk than smaller animals.
Our work represents a first step towards a better understanding of the marine megafauna that lived in the geological past and we expect for our list to be expanded in the future and to inspire further work on this group.
On behalf of the co-authors, we thank you for your invitation to contribute and for considering our manuscript.
Sincerely,
Catalina Pimiento