


Introduction
Local food scholarship has long understood that access to locally oriented food outlets is not equal to all segments of society. However, most such findings rely on case studies conducted at the level of individual farm (and farmers market) outlets. This paper seeks to understand local food access systematically and does so through the lens of outlet availability. More specifically, our research question is: Who has on-site, direct-to-consumer (DTC) farm outlets available to them? While this side steps other access-related questions of economics, transportation, time, and skill, it also drives at a fundamental aspect of access: one must have such food options nearby for these other dimensions to be relevant. This study's unique contribution is its focus on the role of proximity within a regional short food supply chain (SFSC) system and its relationship to local food availability. We use a regional case study exploring the spatial patterns of local food in southern New England, specifically related to on-site direct-to-customer establishments (i.e., pay-as-you-go farmstands, pick-your-own [PYO] operations, and box share arrangements [community-supported agricultures (CSAs)]). We argue that local food availability is a systematically uneven phenomenon, and we demonstrate how the dynamics of that availability vary with both outlet type and social characteristics.
We begin by explaining what we mean by an SFSC, as well as a brief review of the relevant literature on local food access. We then turn to an overview of the data and methods for the project, which draws on the geolocations of locally oriented farms linked to the sociodemographic characteristics of the surrounding area. Our findings show that availability of local SFSC outlets is not evenly distributed, particularly when we examine for race and class-related factors. Pay-as-you-go operations are more likely to be found in predominantly White areas and (to some extent) areas with higher overall incomes. CSA box share arrangements show a particular association with higher educational attainment. We then discuss the implications of these findings as they relate to broader issues around access to local food, with an emphasis on some of the distinct characteristics of CSAs relative to other local SFSC types. We believe these findings contribute especially to local SFSC scholarship by suggesting a systematic way in which availability of local food (a preliminary dimension of access) is an uneven phenomenon. This method and outcome are particularly relevant and important given that spatial proximity has been identified as the main attribute by which food's localness is determined (Carroll and Fahy, Reference Carroll and Fahy2015).
Background
An SFSC refers to the development of ‘alternative’ or ‘short’ food supply chains that remove intermediate actors in the production and distribution of food by shifting away from the complex ‘long’ industrial supply chains to a local, ‘short circuited’ supply chain from nearby farms (Marsden, Banks and Bristow, Reference Marsden, Banks and Bristow2000). The most common characteristic of SFSCs is geographical proximity, or spatial adjacency between consumer and producer—framed by either political boundaries or physical closeness measured in distance or time (Paciarotti and Torregiani, Reference Paciarotti and Torregiani2021; Trivette, Reference Trivette2015). But what matters most is not the number of times a product is handled or the total distance that it travels, but the inherent nature of the connections and associations that are made between the producer and consumer; this is what gives local food its value (see also Hauvala, Heikkilä and Pölkki, Reference Hauvala, Heikkilä and Pölkki2019).
Almost by definition, to access local food one must have such food outlets available. Past studies have shown the importance of spatial proximity to food sources (Andreatta, Rhyne and Dery, Reference Andreatta, Rhyne and Dery2008; Kato, Reference Kato2013; Beagan, Chapman and Power, Reference Beagan, Chapman and Power2016), while also identifying what has become known as the ‘local trap’—the assumption that regionally based, close proximity, and presumed small-scale agriculture is inherently more ecologically sustainable and socially just than other types of food sources (Born and Purcell, Reference Born and Purcell2006). Despite this awareness of proximity's importance, it appears to be the least thoroughly interrogated and theorized compared to other barriers to local food access. It is notable, however, that spatial inequalities have been widely interrogated regarding community food access more generally, particularly in relation to the existence of food deserts (c.f. Raja, Ma and Yadav, Reference Raja, Ma and Yadav2008; Smoyer-Tomic et al., Reference Smoyer-Tomic, Spence, Raine, Amrhein, Cameron, Yasenovskiy, Cutumisu, Hemphill and Healy2008; Gatrell, Reid and Ross, Reference Gatrell, Reid and Ross2011; Hallett and McDermott, Reference Hallett and McDermott2011; Russell and Heidkamp, Reference Russell and Heidkamp2011; Hubley, Reference Hubley2011; Meenar and Hoover, Reference Meenar and Hoover2012). The focus of food desert studies tends to be on more mainstream food outlets, such as grocery and convenience stores, not on locally oriented SFSC options.
Other barriers that may limit one's ability to interface effectively with SFSCs include material resources (local food is often critiqued as being more expensive than conventional food, though the evidence for this claim is far from clear; Pirog and McCann, Reference Pirog and McCann2009), transportation systems to get to and from local food outlets, available time to purchase and prepare the food, and the cultural capital (or what Bourdieu might call habitus) of various kinds and forms of food (Bourdieu, Reference Bourdieu1984; Kato, Reference Kato2013; Parsons, Reference Parsons2016; McGuirt et al., Reference McGuirt, Jilcott Pitts, Hanson, DeMarco, Seguin, Kolodinsky, Becot and Ammerman2018). This cultural or symbolic aspect is difficult to quantify but worth briefly considering. Middle-class values are often expressed by eating in accordance with both nutritional guidelines and ethical and ‘green’ consumption (Beagan, Chapman and Power, Reference Beagan, Chapman and Power2016; Kamphuis et al., Reference Kamphuis, Jansen, Mackenbach and van Lenthe2015; Parsons, Reference Parsons2016). In a variety of ways, local food is often tied to all these hallmarks: it is touted as more nutritious than conventional food, ethically grown and raised, and environmentally friendly (Bagdonis, Claire Hinrichs and Schafft, Reference Bagdonis, Claire Hinrichs and Schafft2009; Farmer et al., Reference Farmer, Chancellor, Robinson, West and Weddell2014; Izumi et al., Reference Izumi, Rostant, Moss and Hamm2006; Sonnino, Reference Sonnino2009; Vallianatos, Gottlieb and Haase, Reference Vallianatos, Gottlieb and Haase2004; Vogt and Kaiser, Reference Vogt and Kaiser2008). What is striking is that less affluent individuals also indicate a concern over nutrition and health, but often do not associate local food as being part of that nutrition-health nexus (see Kato, Reference Kato2013). Further, DTC establishments (particularly CSAs and farmers markets) are significantly marked as white and upper-middle class spaces (see Alkon and Mares, Reference Alkon and Mares2012; Alkon and McCullen, Reference Alkon and McCullen2011; Allen, Reference Allen2008; Cone and Myhre, Reference Cone and Myhre2000; Farmer et al., Reference Farmer, Chancellor, Robinson, West and Weddell2014; Guthman, Reference Guthman2008a, Reference Guthman2008b; Hinrichs, Reference Hinrichs2003; Johnston and Baumann, Reference Johnston and Baumann2010; Macias, Reference Macias2008; O'Hara and Stagl, Reference O'Hara and Stagl2001; Slocum, Reference Slocum2006).
The scale of prior research has mainly focused on the case study level and though these findings have been important and consistent across studies, to date we are unaware of any comprehensive systematic study, across a large geographic area—something Macias (Reference Macias2008) has called for. Additionally, recent local SFSC scholarship has focused on factors within the space of the local food establishment (e.g., farmers market or the CSA farm), with little being done to explore the broader spatial distribution patterns of these SFSC operations (Jarzębowski et al., Reference Jarzębowski, Bourlakis and Bezat-Jarzębowska2020) or understanding how racial and class barriers may operate differently across various SFSC outlet types.
The SFSC outlets described in this paper are what Marsden, Banks and Bristow (Reference Marsden, Banks and Bristow2000) would characterize as DTC or face-to-face SFSC outlets. While the database this project draws from does include retailers and other intermediaries, what Marsden et al. might characterize as ‘spatial proximity’ or ‘spatially extended’ SFSC, we focus in this paper on local food outlets where the consumer purchases food directly from the producer, on-site (i.e., farmstand, PYO, or CSAs).
The regional context of southern New England
The states of southern New England are all coastal and relatively small compared to most other states in the Union. Forty-one other states have larger area than all three southern New England states combined. They are overall very densely settled, especially along the coastlines; even the more ‘rural’ areas of western Massachusetts and northwestern Connecticut are within easy access of an urban area—a far cry from how we might think of rural in a Midwestern state. Of the 300 largest cities in the USA, 12 can be found in this region, including Boston, Worcester, Springfield, Providence, New Haven, and Hartford. Three interstate highways pass through this region: I-95 (along the coastline of all three states), I-91 (North-South through Connecticut and western Massachusetts), and I-90 (East-West across Massachusetts); additionally, numerous auxiliary routes connect cities in Rhode Island and eastern Massachusetts.
According to the Census of Agriculture (2002–2012), the total number of farms and the total acreage in cultivation nationally decreased in the first decade of the 21st century. However, during this same time period, all three of these states saw an increase in both count of farms and total cultivated farmland. Most agricultural operations in this region are small; while nationally only 20% of farmland is operated on farms of less than 500 acres, in these states that size farm makes up approximately three-quarters of all cultivated land. If we lower the threshold to farms smaller than 180 acres, the contrast is even starker: only 9% of farms nationally operate at this size, while almost half of the farms in this region are this size or smaller. What we can see from this is that small-scale farming—a non-essential, but often-found hallmark of locally oriented food—is thriving in southern New England. Additionally, the New England area has a highly developed local food scene established several decades ago and accessing local food is incredibly popular and well-promoted in this region, thereby making it a good regional case study for this type of analysis.
Methods
We utilize a mix of methods to answer our research question exploring availability of specific local food outlets in the region. We rely on a choropleth map visualizing the density of local SFSC outlets in the southern New England region to explore key distributional patterns. From there we use a generalized linear model to explore how various demographic factors across the region are associated with these distributional patterns. See Gatrell, Reid and Ross (Reference Gatrell, Reid and Ross2011) for another example of employing GIS to address questions of food system access. Below we describe the specific data sources and analyses used in this study, as well as the limitations of the data and methods.
Dependent variables: locations of locally oriented farms
Data on locally oriented farm participants in southern New England (Massachusetts, Rhode Island, and Connecticut) come from the website www.farmfresh.org, a website managed by several sub-regional local-food advocacy organizations that maintain information on a variety of locally oriented farm and retail participants in the region. (As of this writing the FarmFresh website is no longer active, but was being regularly updated at the time of data collection.) These organizations worked to support local agriculture by connecting farms, food outlets (restaurants, grocery stores, etc.), and consumers throughout the region. Their reputation was such that most locally oriented entities chose to affiliate with them (for branding purposes if nothing else), making this database one of the most extensive available for the region. When a farm or retailer becomes a member of one of these organizations, their information is posted on the main website, including (1) their connections to other locally oriented food entities in the region (such as who sells food to whom), (2) their participation in any DTC sales (see Fig. 1)—such as participating in a farmers market or operating a CSA, farmstand, or PYO operation, and (3) their physical location (e.g., address and latitude, longitude coordinates).

Figure 1. On-site direct-to-consumer (DTC) farm locations in southern New England, categorized by type of farm outlet.
The database used in this study were collected from the FarmFresh website in late 2011 using an automated web-based data gathering program called scrapeR (Acton, Reference Acton2010), which pulled all publicly available information on the website. The complete data set consists of 2626 farms and 913 retailers; however, this project draws on a subset of 1164 farms—those that have at least one on-site DTC operation (farmstand, PYO, or CSA). Many farms operated multiple DTC types, though farm stands are by far the most common (and PYO operations are slightly more prevalent than CSAs; see Table 1). For further details on the database, see (Trivette, Reference Trivette2015).
Table 1. Counts of on-site direct-to-consumer (DTC) farm types in southern New England

Note: 289 farms (24.8%) operate more than one DTC outlet.
Independent variables: regional demographic measures
The independent demographic variables for this study come from the US Census American Community Survey (ACS) Five-Year Estimates for 2007–2011, so as to best align with the farm data collection year (2011); data are taken at the census-tract level (a total of 2555 census tracts are used in the analysis). Specifically, we draw on variables for race, education, income, and population density. (Preliminary models included variables on poverty, nativity/citizenship status, aggregate travel time to work, overall inequality metrics [GINI coefficient], transfer programs [food stamps], car access, and employment status; however, none proved useful in enhancing the models.) Details on each variable used are described below.
The ACS reports race at the level of every person in the population. We quantify race as the proportion of non-Hispanic Whites (hereafter referred to as White) relative to the total population (i.e. percent White). The region overall has relatively little racial diversity (77.3% White), with most minoritized populations concentrated in urban and semi-urban areas. The average census tract in the region is approximately 74% White, and although some census tracts have no White people residing in them, most are over two-thirds White. The race variable is skewed right, but attempts to normalize it using standard transformation techniques created the appearance of a bimodal distribution, so we left it untransformed.
Education is reported in the ACS for each person over the age of 25 and demarcated by the highest grade level a person completed or the highest degree they attained, including time spent toward an uncompleted degree. We quantify this into years of education to calculate the mean years of education for each tract. The region is overall well educated with most people having completed at least some college and many holding a college or even advanced degree. Still, those with higher levels of education do tend to cluster in certain areas, most notably around the suburbs of Boston. Education did not need data transformation.
The ACS provides median household income (MHHI) already calculated at the tract level; for model simplicity, we converted this to be measured in $1000 increments. At the state level in 2011, Massachusetts and Connecticut both had MHHIs of $62,859 and $65,753, respectively, while Rhode Island's MHHI was closer to the national average at $53,636. As with education and race, there are considerable spatially manifest income disparities across the region. Also, as is usual with income distribution, this variable is highly skewed. The maximum value listed is somewhat misleading, as the Census stops asking about specific income above $250,000; excluding the few census tracts with MHHI at this level gives an effective highest MHHI of $180,000. Nonetheless, no census tracts were excluded from the models due to extreme MHHI values. The distribution of MHHI by census tract is close to normal and therefore did not require transformation.
Population density is important to consider because it likely influences the location of farms in general: agricultural operations typically require a certain amount of uninhabited space. Densely populated environments (such as cities) typically do not have such available space, meaning farms are more likely to be found in rural—or at least less populated—areas. We calculate population density using population counts and size of the census tracts (measured in people per square mile). The natural log of population density was used to normalize the distribution, which originally skewed left.
Choropleth map
To visualize the distribution and density of on-site DTC outlets in the region, we performed a spatial join between the local food outlets and their associated census tracts using ArcGIS Pro, to calculate the number of outlets found in each tract. This count of outlets was standardized by the area of the census tracts (in square miles), representing a value akin to population density, but for farms. The resulting scores were broken into evenly distributed quantiles and shaded in progressively darker shades to represent areas with more outlets relative to the size of the area of the census tracts (Fig. 2).
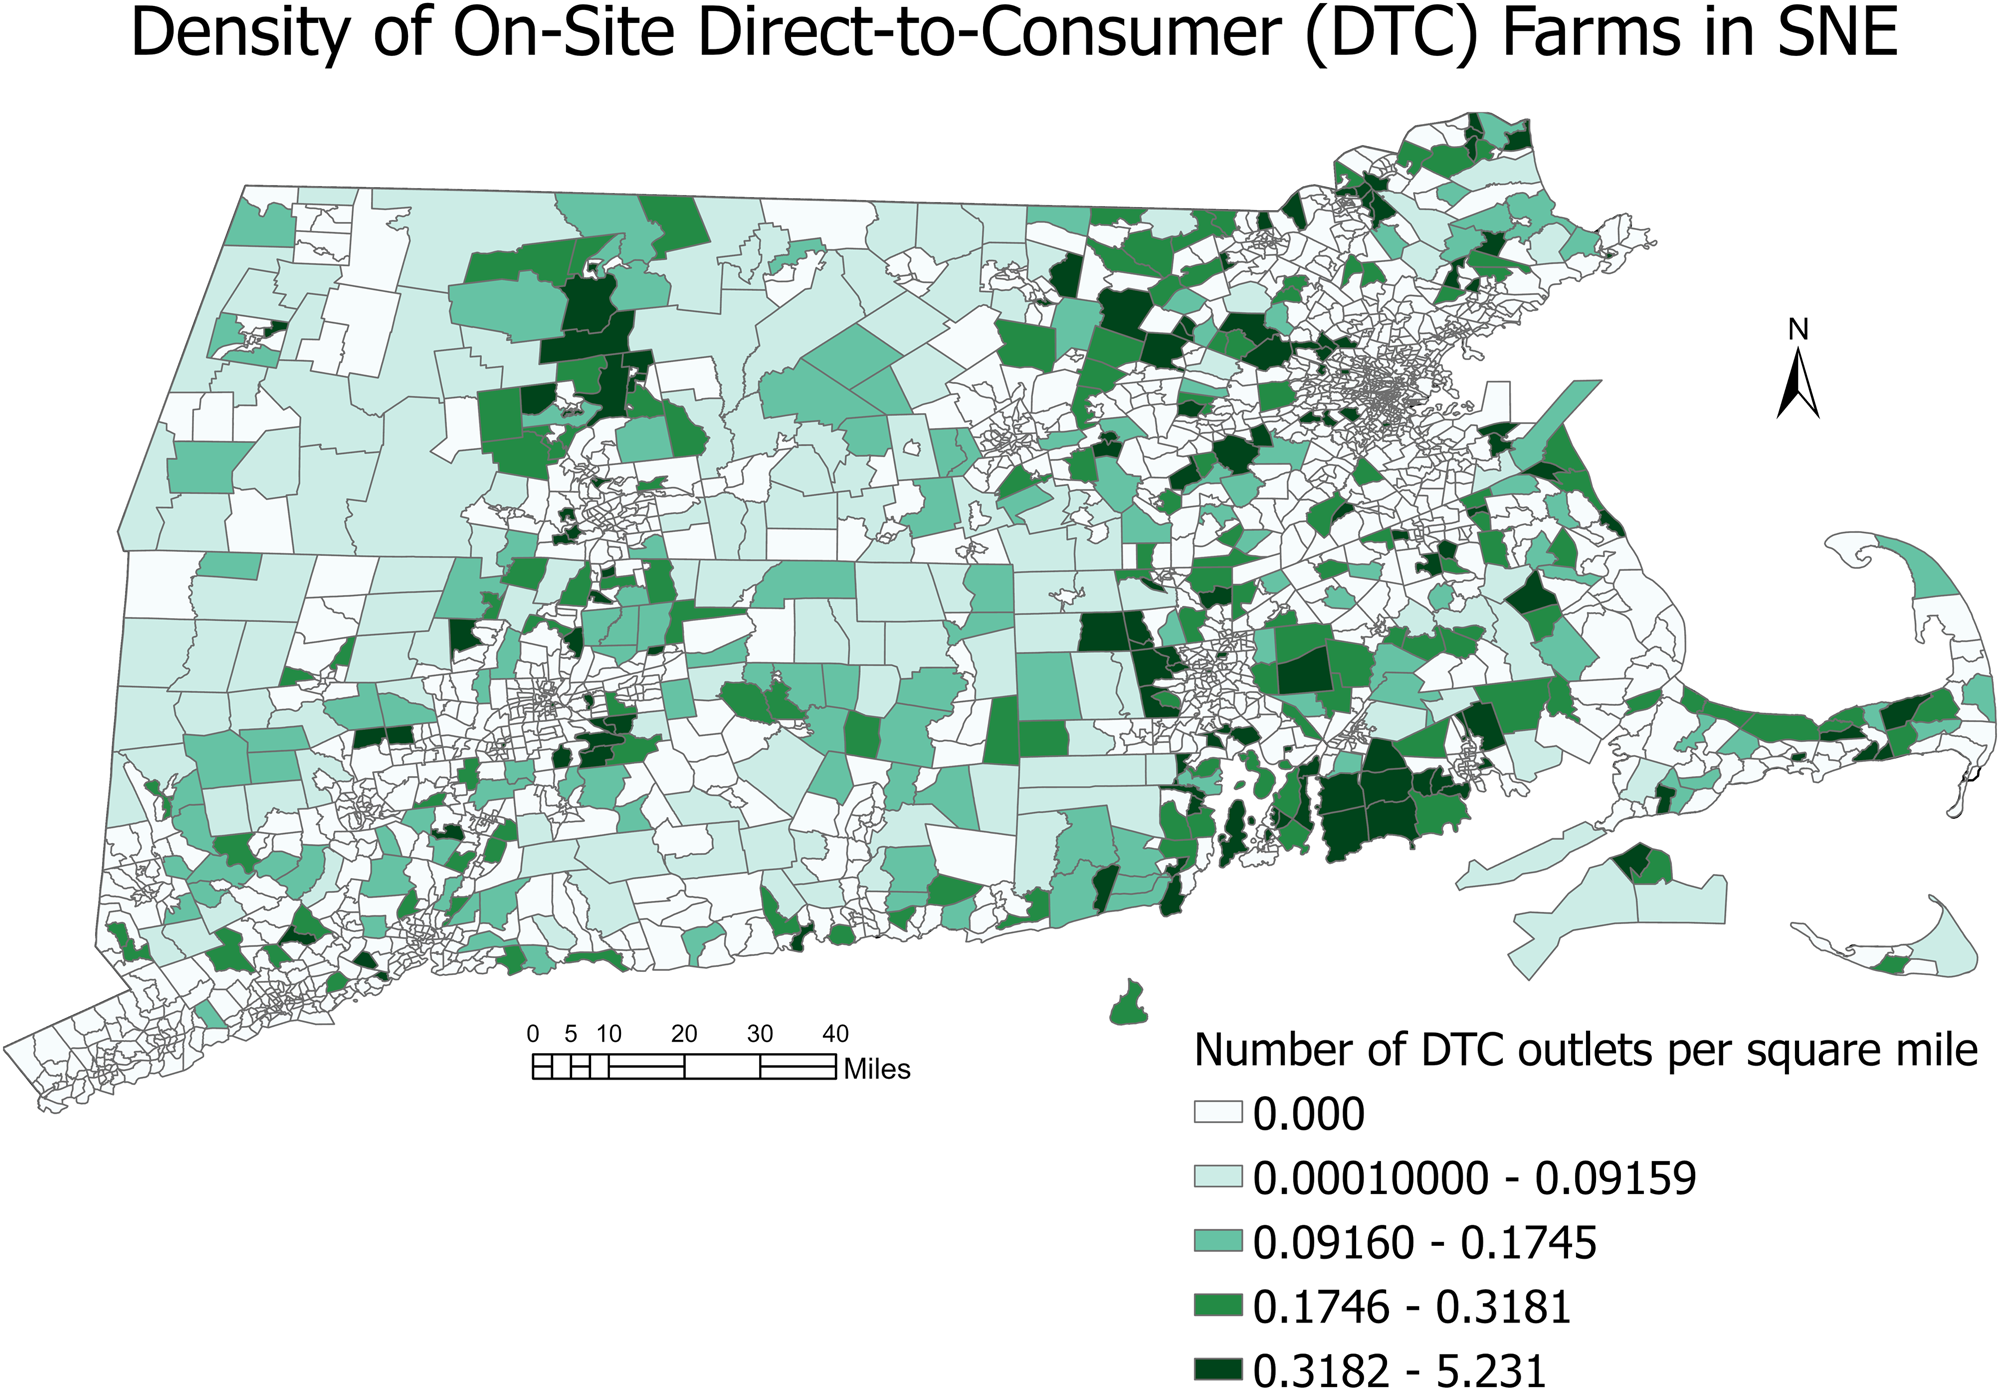
Figure 2. Density of on-site direct-to-consumer (DTC) farms in southern New England standardized by census tract area.
Binomial (logistic) regression modeling
To answer the question of who has on-site, DTC farm outlets available to them, we use a generalized linear model to explore how the distributional patterns seen in the choropleth visualization are associated with various demographic factors across the region. We employ a binomial (logistic) regression since it is suitable for dependent variables with a binary outcome and it accounts for distributions with overdispersion. An example equation for our most inclusive model is provided below.

where a–e are the regression coefficients for the included variables and P is the probability of a farm with an on-site DTC component being present. All logistic regression calculations were performed in R (version 4.2.1). Binomial models present the likelihood of a ‘success’ in the dependent variable based on the configuration of independent variables included. While the coefficients in ordinary linear regression indicate the strength of a presumed linear relationship between variables, the coefficients in binomial regression represent a log-likelihood association. Put another way, larger coefficients indicate a greater probability of finding the presence of the dependent variable. Because these coefficients are log-likelihoods, proper interpretation requires exponentiating them.
Using the census tract as the unit of analysis, the dependent variable in all models is the presence or absence of an on-site DTC farm and the independent variables are the associated demographic variables from the ACS for the census tract. In total, we ran 28 models, seven for each DTC configuration. One set of models looks for the presence of any type of on-site DTC farm and later sets focus on specific types of on-site DTC farms (those with a farmstand, PYO, or CSA). Where there is value in modeling for all farms, each DTC farm type represents a distinct economic orientation; this means there is also value in modeling each separately. A CSA/farmshare arrangement typically requires a consumer to pay some lump sum at the start of the growing season in exchange for a weekly box of seasonal produce. It is an economic commitment not seen in farmstands or PYO operations, which generally allow consumers to pay as they go. The distinctions between farmstands and PYO operations are twofold. First, and perhaps most important, is the labor involved. A farmstand generally has produce that has already been picked (and often cleaned and perhaps packaged or bunched, as appropriate) by the producer; the consumer can simply pull up, select what they want, pay, and be on their way. A PYO operation allows the consumer to perform the labor of harvesting, requiring a slightly greater time commitment than a farmstand (though still less of an economic commitment than a CSA). The other distinction between the two pay-as-you-go types is in the produce available. PYO operations typically focus on crops with simple harvest needs, most commonly berries and tree fruit or vegetables that don't damage easily (such as beans). Farmstands typically offer a much wider array of produce from the farm, and also ensure that consumers can't accidentally damage crops, soil, or surrounding areas.
To check for spatial autocorrelation, we use the inferential statistic Moran's I, which indicates whether or not phenomena are randomly distributed in space. It is conceptually similar to a correlation coefficient in that, for significant p-values, the value of Moran's I tells us the strength and direction of the spatial relationship. Moran's I values of 0 or near 0 indicate weak (or no) spatial association, while values of 1 or near 1 indicate strong positive associations in space (values of −1 or near −1 indicate strong negative associations, or that the phenomena in question are spatially divergent from one another). Moran's I can be used on regression model residuals to evaluate whether spatial autocorrelation may still be influencing the outcome. To account for this possibility, we provide the Moran's I output with all of our models.
Limitations of data and methods
We acknowledge the following limitations of our data and methodology. First, this study recognizes that availability of various SFSC outlets based on their locations to certain parts of the population does not equate to or guarantee actual food acquisition, actual participation in, or actual patronage to the farms. Therefore, we do not attempt to infer patterns related to actual participation in or patronage of the on-site DTC outlets, since we are analyzing demographic data at the census tract level. Second, and related, this study uses census tracts to define proximity rather than actual distance people travel to obtain food from the local food outlet. DTC outlets that are on the periphery of a census tract may be patronized by people from neighboring census tracts. Also, our analysis does not account for any CSA programs that deliver to the consumer rather than the consumer going to the farm location. Third, the cross-sectional nature of the study provides a snap-shot in time (2011). Fourth, while the database contains a count of the number of farmers markets a farm sells at, we do not have information on which farmers markets, nor where they are located. Such data would be a valuable contribution to the findings which future studies should endeavor to include. Fifth, the nature of the website where the data were obtained was such that we can't guarantee it was all-encompassing for every local food outlet in the region, but we are confident that it represented a substantial, high-quality data source, as described in the data section above. Finally, the biophysical attributes related to the location of the SFSC outlets in this study are outside the scope of this paper.
Results and discussion
As the literature suggests, access to local SFSC outlets does not occur equally across all social strata. The present study adopts a wide-spread, systematic approach to show how these trends are reflected in the spatial distribution of local SFSC outlets. Of course, inequality is only one portion of the narrative related to the placement of local SFSC productions (i.e., farms), though still an important portion. Considering the nature of farming, we suspect the biophysical aspects of food production are likely also (if not more) powerful predictors of farming locations, but given those ecological constraints, placement of local SFSC outlets does not occur equally to all social groups.
Descriptive results
The three states that make up southern New England contained 2555 census tracts in 2011; 519 of those tracts had at least one DTC on-site farm, approximately half of which had more than one such farm. As Table 2 shows, the average census tract in this region is almost three-quarters White with a typical MHHI of around $70,000 annually and average educational attainment of at least some college. We can compare that to the average census tract in which a DTC-oriented farm is located (Table 2) to begin to paint part of the picture of access. We see slightly higher average educational attainment and MHHI. What is especially striking, though, is the drastic difference in racial makeup of those tracts. Tracts with on-site DTC farms are on average over 90% White. Only 3.6% of farms in our sample are in census tracts that are less than 74% White (and only four farms in tracts that are majority non-White). This tells us that access to locally oriented farms—simply from a proximity perspective—is a very racialized phenomenon.
Table 2. Demographic variables of southern New England
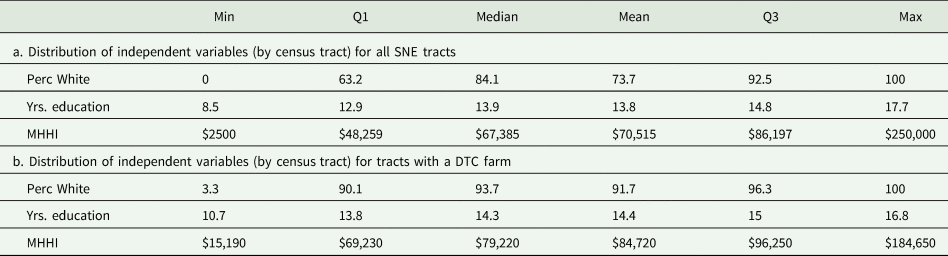
Summary statistics are calculated at the level of the census tract, for (a) all tracts in the region whether it has an on-site DTC farm or not, and (b) for tracts with an on-site DTC farm.
Choropleth map interpretation
The choropleth map (see Fig. 2) indicates several regional clusters of local food activity. The most notable is in the Pioneer Valley (western Massachusetts). The outskirt areas around Providence and Boston also show very high clustering of local food outlets, though the cities themselves (unsurprisingly) show very little; a similar, if smaller, trend can be seen around Hartford. Cape Cod also shows a relatively high concentration of farm outlets. There also appear to be modest concentrations of local outlets in central Massachusetts (between Worcester and the Pioneer Valley), eastern Connecticut, and the Berkshires (far western Massachusetts).
Binomial (logistic) regression model results
Aggregate on-site DTC farms: farmstands, PYO, and CSA
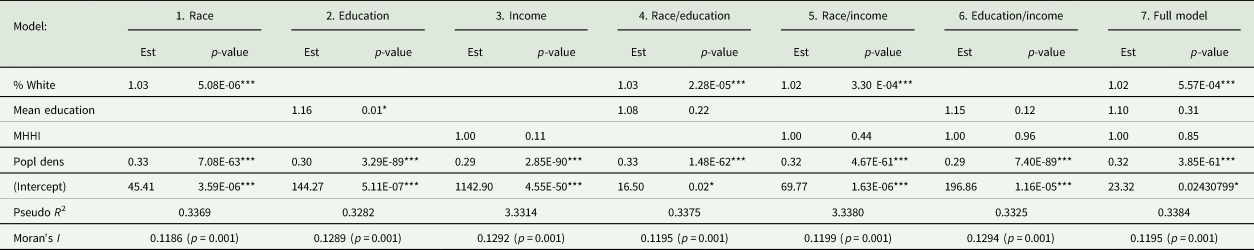
When we look at on-site DTC farms in the aggregate (Table 3), two primary characteristics stand out: they are found in less densely populated areas and they are in predominantly White areas. Urban areas are significantly less likely than rural areas to have such an establishment. While the impact of the race term is not nearly so dramatic, and perhaps not surprising given that non-White populations tend to be concentrated in urban areas, the fact that both terms attain consistent statistical significance tells us that both factors matter in understanding the locations of locally oriented farms. Simpler models (see Model 2 in Table 3) suggest that educational attainment may be positively associated with farm locations, but this term is not significant when included with others. Income never attains significance.
Table 3. Binomial (logistic) regression models with any on-site DTC farm as the dependent variable

Values presented in Tables 3–6 are odds ratios. The coefficients from the binomial models are exponentiated to give a number indicating whether a given variable makes the binomial outcome more (greater than 1) or less (less than 1) likely to occur. Significance: ***⩽0.001; **⩽0.01; *⩽0.05 for all models and tables.
The Moran's I statistics for the model residuals range between 0.11 and 0.12 (and are statistically significant). This suggests that a modest amount of positive spatial autocorrelation (or clustering) may still be at play. However, given that we have accounted for the most likely driver of such effects (population density) and have relatively robust pseudo-R 2 values with only a few key variables, we are hesitant to add more potential variables for fear of overspecifying the model.
Pay-as-you-go operations: farm stands and PYO
Likely owing to the fact that they are such a large proportion of all farms in the dataset, farmstands (Table 4) follow the same patterns as seen for farms in the aggregate. Their location is primarily associated with predominantly White, lower population density areas; education may matter, but not extensively, and income does not help to explain much of this phenomenon. These model residuals also have similar Moran's I values (0.12–0.13) as with the models for aggregate farms.
Table 4. Binomial (logistic) regression models with farmstands as the dependent variable
PYO operations (Table 5) show a similar story, except that now income matters. They are in less-densely populated, predominantly White areas; in fact, the race coefficients suggest they may be in slightly more White areas even than farmstands (the slightly lower Moran's I values for the models that include race also support this). There is a slight, but consistent and statistically significant, positive association between income and the presence of a PYO farm. Education by itself suggests a possible positive association, but its inclusion with any other term (save population density) eliminates its statistical significance, suggesting it is not a useful factor in explaining such farm types.
Table 5. Binomial (logistic) regression models with PYO as the dependent variable

Box share arrangements: CSA operations
The CSA models tell a very different story (Table 6). The only similarity they share with other farm types is that they are less likely to be found in densely populated areas. The association between CSAs and race is only significant when no other terms are included in the model, and even then, is much milder than seen for other farm types. Additionally, the Moran's I values for all CSA models drop dramatically, to around 0.03–0.04. While these values remain statistically significant, they suggest that very little spatial autocorrelation is still at play in the models predicting presence of CSAs.
Table 6. Binomial (logistic) regression models with CSAs as the dependent variable
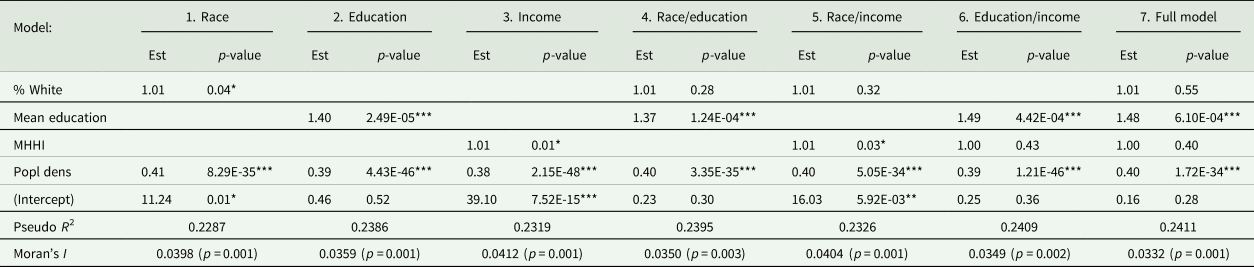
The prevailing (and consistent) factor appears to be education. The education term is consistently significant regardless of what other variables are included and shows a strong positive association with CSAs that only increases when income is added. This is in line with what Galt et al. (Reference Galt, Bradley, Christensen, Fake, Munden-Dixon, Simpson, Surls and Van Soelen Kim2017) show, that CSA participants tend to have high levels of educational attainment (at least a bachelor's degree, and often a graduate degree), even across income differences. Income, by itself and when included with race, shows a slight positive association; but when included with education, it loses significance.
Implications and discussion
As we would expect, the locations of all farm types are strongly associated with less densely populated areas. Beyond this shared feature, different sociodemographic factors help explain each farm type. Farmstands are primarily associated with White populations while PYO operations are primarily associated with White and higher-income populations. The locations of CSAs, on the other hand, appear to be primarily associated with the educational attainment of an area, and not so much with race or income. In this section, we consider the implications of such findings and conjecture a possible explanation.
Prior research has consistently found that localized SFSC outlets (particularly CSAs) are predominately White spaces and has indicated the challenges associated with further including people of color (Allen, Reference Allen2008; Guthman, Reference Guthman2008b; Alkon and McCullen, Reference Alkon and McCullen2011; Galt et al., Reference Galt, Bradley, Christensen, Fake, Munden-Dixon, Simpson, Surls and Van Soelen Kim2017; McGuirt et al., Reference McGuirt, Jilcott Pitts, Hanson, DeMarco, Seguin, Kolodinsky, Becot and Ammerman2018; Joyner et al., Reference Joyner, Yagüe, Cachelin and Rose2022). Our findings largely support this when we look at farmstands and PYOs. However, the lack of significance of the race term in the CSA models suggests that while that trend may still hold for CSAs, it is not the most significant feature explaining differential availability of such outlets. That does not mean that we would not find a predominantly White customer-base were we to visit most of these CSA farms; in all likelihood, we would (as indicated by Table 6, Model 1). However, what particularly seems to matter for understanding CSAs is education. The education term is consistently significant for CSAs, much as the race term is for farmstands and PYOs. This could indicate a certain cultural capital of local food (Bourdieu, Reference Bourdieu1984; Parsons, Reference Parsons2016), perhaps one that exists independent of race.
There are both philosophical and practical differences between the operation of the different farming types being considered. Though the CSA model has become relatively commonplace in mainstream society, it is still one of the more recent local food distribution models to be developed, and one driven heavily by the recent rise of the local SFSC movement. Farms operating CSA shares tend to be established around this box share format, in part because such an orientation demands a polyculture growing arrangement and functions in a fundamentally unique way compared to industrial/commodity agriculture.
Farmstands (and to some degree PYO operations), on the other hand, have existed for much longer than CSAs. While CSAs are typically established as CSAs, farmstands are flexible enough to play many possible roles in a farm's business model: central, supplemental, or something in between. Further, they are easily incorporated by a wide array of farms, from those focused on selling to a local market (perhaps also incorporating a CSA component or utilizing farmers markets) to those engaged primarily in commodity agriculture. Though farmstands are certainly effective means of obtaining fresh, local food, they are rarely touted as a main SFSC outlet for would-be consumers. Even PYO operations, while requiring more long-term investment by the farmer than a farmstand, offset the labor of harvesting from the farmer to the consumer (often under the rubric of family fun).
Participating in a CSA share carries a certain import not seen in a farmstand purchase, which we might call a marker of cultural capital. Markers of cultural capital (Bourdieu, Reference Bourdieu1984) are often tied to educational attainment, which we found to be significantly related to CSA locations. In a way, CSAs are ‘more local’ than farmstands, perhaps in part because of these very differences in both philosophical orientation and physical setup. CSAs are not just a means of obtaining fresh, local food; they are also imbued with other positive qualities that generally are not associated with farmstands. They are also more of a commitment on the part of the consumer than either of the other types (and even than the more common method of provisioning food from a grocery store). With a CSA one typically pays in at the start of the growing season and makes a weekly visit to pick up the food available. This typically also entails developing meal ideas based on what is available rather than simply purchasing the necessary ingredients at the store, regardless of seasonality. These symbolic and practical associations may contribute to the difficulty of equalizing access to local SFSCs and suggest that understanding class access (even more generally) involves understanding both material (including spatial) and symbolic differences. The finding on education could be reflective of some of these symbolic differences. Future studies could explore this relationship in greater depth.
Conclusion
In this paper, we have sought to understand local food availability by focusing on the relationship between the farm locations and population distribution patterns. This helps us see who has proximal access to such spaces and whether these arrangements could contribute to barriers in overall access. We find that there are significant racial and class-based configurations in how these farms are distributed in space which shows systematically how availability of (and by extension, access to) local food is an uneven phenomenon. Pay-as-you-go operations are much more likely to be found near White communities, indicating one racialized component in accessing such food outlets. CSAs are much more likely near highly educated populations, suggesting a certain privileging related to social class. This says nothing about what other factors may limit or enable access to local food spaces, simply that even in a very local-food-saturated environment, certain segments of the population have a leg up on accessing such outlets simply based on proximity—and these associations are not by random chance.
Not all parts of the country look like New England, so future research might consider whether and how these trends play out in other regions, particularly ones with more racial diversity and different socioeconomic characteristics. By extension, an in-depth examination of farms that are located near less-advantaged communities would likely reveal useful insights about how availability intersects with other potential barriers in accessing local food. It might also be useful to better control for the biophysical aspects of farming, such as soil quality and water access; we attempted to account for the space requirement of farming by including population density, but this is not the only factor that matters in selecting a suitable site to raise food.
The availability of (and access to) local food outlets is not simply a binary affair. Certain types of local food outlets are more readily available to some segments of the population than others. In this paper, we have demonstrated how local food availability is a systematically uneven phenomenon and how the dynamics of that availability vary with both outlet type and social characteristics.
Data availability statement
Data that support the findings of this study are available upon reasonable request from the corresponding author.
Acknowledgements
The authors wish to thank everyone who made this paper possible. We appreciate the dedication of the sub-regional local-food advocacy organizations that (up until recently) maintained and managed information about a variety of locally oriented farm and retail participants in the region on the website: www.farmfresh.org. We are also grateful to the three anonymous reviewers, whose insights and useful feedback improved the manuscript.
Competing interest
Both authors declare none. This was an unfunded project.


 Open access