


Obesity is a state of over-nutrition that occurs after a long-term energy surplus which can be achieved by higher energy input and lower energy output(Reference González-Muniesa, Mártinez-González and Hu1). In recent decades, it has been shown that a positive energy balance can be obtained by increasing consumption of high-energy foods and beverages while a lower energy output can be achieved by having a sedentary lifestyle(Reference González-Muniesa, Mártinez-González and Hu1). This has been supported by finding that a combination of a low-energy diet and exercise is better than only a low-energy diet to induce weight loss in individuals with overweight and obesity(Reference Luglio, Sulistyoningrum and Apriliana2). In addition to lifestyle factors, it has been reported that genetic inheritance plays an important part in the development of obesity(Reference Loos3,Reference Nan, Guo and Warner4) .
This role of genetic inheritance on weight gain was initially suggested by Bouchard et al.(Reference Bouchard, Tremblay and Després5) three decades ago. In the present study, they overfed young adult male monozygotic twins for 100 d and found that despite all subjects having an increment in body weight, their degree of weight changes varied. Interestingly, the pattern of weight changes is similar between twins showing the role of genetic inheritance in determining response to energy intake. It has been estimated that genetic heritability could explain 40–70 % of BMI variation(Reference Herrera and Lindgren6). To date, reports have documented the influence of genetic variation in specific loci on the development of obesity. This include variation of the genes involved in energy regulation pathway(Reference Loos3,Reference Nan, Guo and Warner4,Reference Rudkowska and Perusse7) . Interestingly, although genetic inheritance has a more important role in explaining variation of BMI, the examination of obesity genetic loci altogether using genome wide association study could only explain less than 2 % of BMI variation(Reference Herrera and Lindgren6). This shows there are some other factors connected to genetics that influence individual variation in adiposity.
Uncoupling protein (UCP) is a protein located at the inner membrane of mitochondria and involved in energy metabolism(Reference Fisler and Warden8). UCP has several isotypes, namely UCP1, UCP2 and UCP3. UCP2 is expressed at a wide range of tissues and organs, unlike UCP1 which is expressed in brown adipose tissue and UCP3 which is expressed in skeletal muscle(Reference Azzu and Brand9,Reference Ricquier10) . In a population setting, studies have shown that UCP2 was associated with an increased risk of obesity(Reference Andersen, Dalgaard and Justesen11). Additionally, clinical trials have shown that UCP2 gene variation induces differential responses to an energy restriction diet or chronic overfeeding(Reference Mutombo, Yamasaki and Shiwaku12,Reference Ukkola, Tremblay and Sun13) . The -866 location of UCP2 gene variation was associated with UCP2 gene expression and metabolic rate in humans(Reference Esterbauer, Schneitler and Oberkofler14,Reference Kovacs, Ma and Hanson15) . Additionally, we previously reported that UCP2 gene variation influences energy regulation through regulation of leptin sensitivity(Reference Luglio, Sulistyoningrum and Huriyati16).
A recent meta-analysis has shown the role of UCP2 gene variation on BMI variability(Reference Brondani, Assmann and de Souza17). It has been reported that the A allele of -866G/A UCP2 gene variation was associated with lower BMI among a European population. However, there is a lack of investigation on the effect of UCP2 gene variation on changes in adiposity measures in a longitudinal setting, especially among the Asian population. In addition, the majority of those studies did not take energy balance into account including energy intake and physical activity. Those factors are important as obesity is a long-term consequence of energy surplus influenced by the interaction of genetic and environmental factors(Reference van Vliet-Ostaptchouk, Snieder and Lagou18).
The present study aimed to analyse the role of UCP2 gene variation on changes in adiposity measures among healthy Indonesian adults who were followed for 2 years. Additionally, we also evaluate the influence of UCP2 gene variation on the relationship between energy intake, physical activity and changes in adiposity. By conducting the prospective study, we intended to investigate the causal role of gene–lifestyle interaction on changes in adiposity.
Methods
This was a prospective cohort study among Indonesian adults living in the city of Yogyakarta, Indonesia whom the initial data collection has been reported previously(Reference Luglio, Sulistyoningrum and Huriyati16,Reference Muhammad, Sulistyoningrum and Huriyati19) . The present study is part of Indonesian Nutrigenetic Cohort or INDOGENIC study. The aim of INDOGENIC study was to evaluate the interaction between diet and gene variation on obesity and early signs of CVD among Indonesian adults. The initial data collection was started in 2016, and the first follow-up data collection was done in 2018.
The inclusion criteria were adults between 20 and 56 years old who had lived in the city of Yogyakarta for at least 2 years prior to the initial data collection. The exclusion criteria were a diagnosis of chronic disease, pregnancy during the cohort period, following a strict diet and problems with walking or conducting physical activity in the last 6 months. Ethical clearance was obtained from the Medical and Health Research Ethics Committee Faculty of Medicine, Gadjah Mada University – Dr Sardjito General Hospital, Indonesia (KE/FK/0218/EC/2018). The present study followed the ethical guidelines of the 1975 Declaration of Helsinki. Minimal number of subjects was 184 calculated based on calculation of minimal number of subjects for initial research proposal with 95 % CI (z = 1·96), two-sided significance 0·05 and Indonesian prevalence of obesity (2014) 15·4 %.
In the present study, changes in adiposity were based on data on body weight (kg), BMI (kg/m2), body fat (%), waist (cm) and hip circumference (cm). Body weight and body fat were measured using a bioelectrical impedance (0·01 kg precision, Omron Karada Scan HBF-375). Height was measured using a wall-mounted tape measure (0·1 cm precision, GEA medical). BMI was calculated by dividing body weight with the square of height. Body composition was defined by percentage body fat. Waist and hip circumference were measured using a non-elastic tape (0·1 cm precision). Waist:hip circumference ratio (WHR) was calculated by dividing waist circumference (cm) with hip circumference (cm). All anthropometric measurements were conducted by trained personnel using calibrated instruments. The measurements were carried out over in two time points, at baseline (2016) and after 2 years (2018).
Daily food consumption was collected using a semi-quantitative FFQ, and total energy intake was calculated based on Indonesian food database and the United States Department of Agriculture(20,Reference Steinemann, Grize and Ziesemer21) . Physical activity was measured using the International Physical Activity Questionnaire(Reference Wanner, Probst-Hensch and Kriemler22). This questionnaire contains information on the intensity and duration of several activities including work/job, transportation, house-related work and maintenance, recreation, exercise and leisure-time physical activity. The quantitative measures of physical activity were calculated as MET-min/week. The basal energy expenditure was a calculated value using formula developed by Mifflin et al.(Reference Mifflin, St Jeor and Hill23). The data of semi-quantitative FFQ and International Physical Activity Questionnaire were collected by a face-to-face interview between trained nutritionists and subjects. Those questionnaires were developed, validated and used in previous studies(Reference Steinemann, Grize and Ziesemer21,Reference Wanner, Probst-Hensch and Kriemler22,Reference Luglio, Eurike and Huriyati24) .
A total of 10 ml blood sample was collected from each subject in EDTA-containing tubes. After collection, blood plasma and buffy coat were separated by centrifugation. The DNA sample was isolated from the buffy coat using a commercial DNA extraction kit (Favorgen). UCP2 -866G/A genotyping was done using PCR-restriction fragment length polymorphism with forwarding primer: 5′-CAC GCT GCT TCT GCC AGG AC-3′ and reverse primer: 5′-AGG CTC AGG AGA TGG ACCG-3′. PCR conditions are 8 min of denaturation in 95°C followed by thirty-five cycles of 95°C for 1 min (denaturation), 55°C for 1 min (annealing), 68°C for 1 min (extension) and 72°C for 7 min (final extension) (Applied Biosystem; Thermo Fisher Scientific). The PCR product (360 bp) then digested using BSTUI enzyme digestion (Thermo Fisher Scientific) into two fragments, 270 and 90 bp. Restriction fragments were resolved on a 3 % agarose gel. There are three genotypes expected to be examined including AA, GA and GG. Subjects were grouped to GG and AA + GA because those with the GG genotype had different UCP2 gene expression compared with those with the A allele (AA + GA)(Reference Beitelshees, Finck and Leone25–27).
Statistical analysis was done using JASP software version 0.8.3.1 (The University of Amsterdam). Prior to data analysis, a normality test was done for each dataset using the Shapiro–Wilk test. To compare the difference in the proportion of male and female between each genotypes group, a χ 2 test was conducted. Changes in adiposity measures, dietary intake and physical activity after 2 years in all groups were tested using the paired t test or Wilcoxon signed-rank test depending on whether data were distributed normally or not. The correlation between changes in energy intake, dietary composition and physical activity on changes in adiposity measures after 2 years of the cohort were done using a linear regression test correction for age, sex, change in physical activity (for energy intake and dietary composition) and changes in energy intake (for physical activity). This analysis was done in all subjects and in UCP2 genotype groups. Significance is reached when P < 0·05. All analysis was conducted in two tails. Repeated-measures ANOVA was used to evaluate differences between UCP2 genotype groups with correction for age, sex, energy intake and physical activity.
Results
This is a cohort study in Indonesian adults living in the urban area of Yogyakarta, Indonesia. Subjects were followed after 2 years of initial data collection. From a total of 503 subjects who were measured for adiposity, dietary intake and physical activity at baseline, DNA samples from a total of 333 subjects were analysed for UCP2 gene variations and successfully measured at 2 years. Of those, ten subjects were excluded from analysis due to extreme weight changes within 2 years (increase or reduce more than 15 %) (Fig. 1). The frequency of the A allele was 38 %, and this gene variation is within the Hardy–Weinberg equilibrium (P = 0·420).
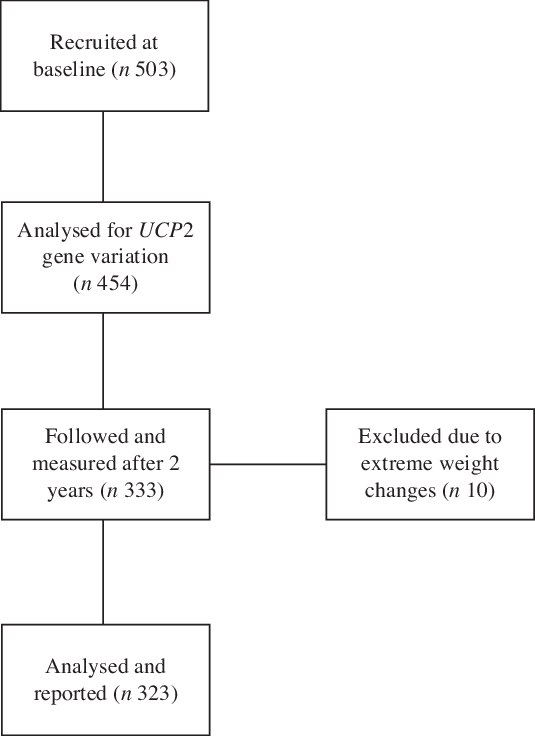
Fig. 1. The schematic sample flow of data collection.
The baseline data are shown in Table 1. Sex and age were equally distributed throughout the UCP2 genotypes (P = 0·829). In all subjects, there were significant increments in body weight, BMI, body mass and reduction in WHR (all P < 0·05). Subjects had a significant reduction in energy intake (P < 0·001) but no difference in the changes in dietary composition (P > 0·050).
Table 1. Changes in adiposity, dietary measures and physical activity after 2 years of follow-up in all subjects (n 323)*
(Mean values and standard deviations)

WHR, waist:hip ratio; MET, metabolic equivalent of tasks.
* Mann–Whitney test.
† To convert kcal to kJ, multiply by 4·184.
We report that in all subjects, body weight and body fat changes were positively correlated with total energy intake (P = 0·023 and 0·030, respectively) (Table 2). By contrast, changes in dietary compositions including percentage energy from fat, protein and carbohydrate were not associated with changes in adiposity measures (P > 0·05). Change in physical activity was also not correlated with all adiposity measures (P > 0·05).
Table 2. Correlations between changes in energy intake and physical activity on changes in adiposity measures

WHR, waist:hip ratio; MET, metabolic equivalent of tasks.
* To convert kcal to kJ, multiply by 4·184.
† Linear regression test with correction for age, sex and changes in physical activity.
‡ Linear regression test with correction for age, sex and changes in energy intake.
In the present study, two genotypes (AA and GA) were combined into a group to test the effect of the A allele on adiposity response towards changes in energy intake and physical activity. At baseline, there were no differences in body weight (P = 0·879), BMI (P = 0·804), body fat (P = 0·586), WHR (P = 0·085), physical activity (P = 0·361) and energy intake (P = 0·292) between AA + GA and GG. There was no difference in the proportion of male and female subjects in both genotype groups (P = 0·987). The differences in changes of adiposity measures, energy intake and physical activity between UCP2 gene variation are shown in Table 3. Subjects in both genotype groups (AA + GA and GG) had a significant increment in body weight, BMI and body fat (all P < 0·05). Subjects with the GG genotype had a greater reduction in WHR in comparison than those with AA + GA (P = 0·040). There were no differences in changes in energy intake, dietary composition and physical activity between UCP2 genotypes (all P > 0·05).
Table 3. Differences in changes of adiposity measure, energy intake and physical activity between UCP2 gene variations
(Mean values and standard deviations)
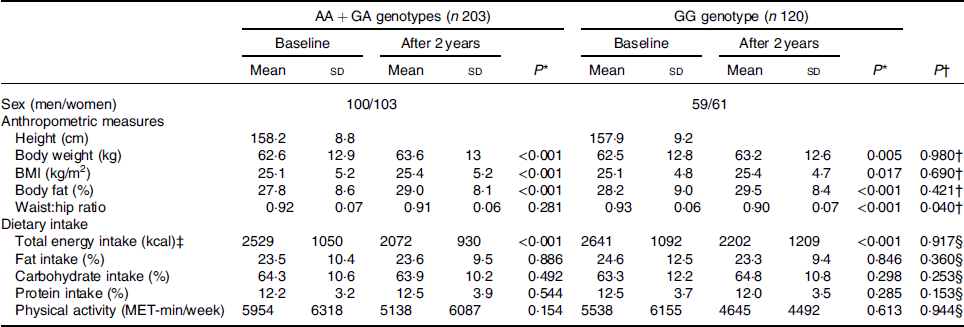
MET, metabolic equivalent of tasks.
* Paired t test on changes after 2 years of follow-up.
† Repeated-measures ANOVA between AA + GA and GG genotypes with correction for age, sex, changes in energy intake and changes in physical activity.
‡ To convert kcal to kJ, multiply by 4·184.
§ Repeated-measures ANOVA between AA + GA and GG genotypes with correction for age and sex.
The gene–lifestyle interaction analysis on changes in adiposity measures is presented in Table 4. Correlation between energy intake and physical activity on adiposity measures was analysed based on UCP2 genotypes (AA + GA and GG). In the present study, we show that energy intake was positively correlated with changes in body weight and body fat among subjects with the GG genotype (P = 0·016 and 0·034, respectively) but not AA or GA genotypes (all P > 0·05). Dietary composition was not correlated with changes in all adiposity measures at both genotype groups. Physical activity was negatively correlated with changes of WHR among those with the GG genotype (P = 0·040) but not among those with the AA + GA genotype (P = 0·684).
Table 4. Correlation between changes in energy intake and physical activity on changes in adiposity measures according to UCP2 gene variation
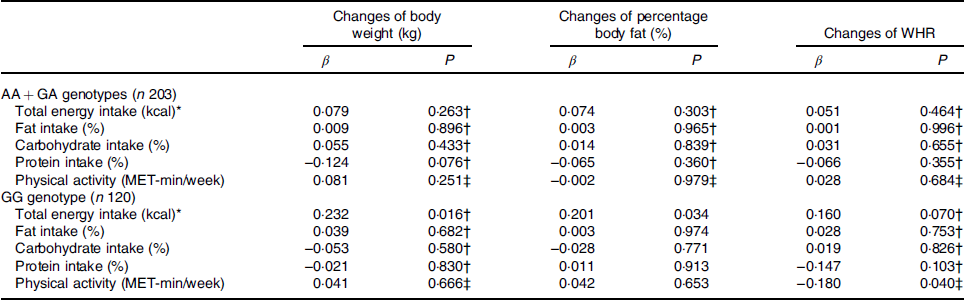
WHR, waist:hip ratio; MET, metabolic equivalent of tasks.
* To convert kcal to kJ, multiply by 4·184.
† Linear regression test with correction for age, sex and changes in physical activity.
‡ Linear regression test with correction for age, sex and changes in energy intake.
Discussion
The present study shows the interaction between genetic factors (UCP2 gene variation) and environment factors (energy intake and physical activity) on changes in adiposity after 2 years among healthy Indonesian adults. Energy intake and physical activity are selected as the exposure in this prospective cohort design, while the change in adiposity measures is regarded as the outcome. The UCP2 gene variation is selected as a determining factor that might influence the relationship between the exposure and the outcome. In all subjects, change in energy intake was positively correlated with changes in body weight and body fat. The UCP2 gene variation was not associated with adiposity changes. However, the correlation between energy intake and weight change was significantly dependent on UCP2 genotype groups, showing the influence of the UCP2 gene on the interaction between energy intake and adiposity.
Between 2016 and 2018, there was a significant increment in body weight (roughly 1 kg). The increment of body weight reflects changes in nutritional status among adults in Indonesia. In a National Basic Health Survey or Riset Kesehatan Dasar (RISKESDAS) conducted by the Indonesian Ministry of Health(27,28) , it was reported that the prevalence of overweight and obesity in 2018 was 35·4 % which increased 9·1 % compared with those in 2013. We report that the increment of body weight was positively correlated with changes in energy intake but not physical activity. Interestingly, despite energy intake being significantly reduced from that in 2016, the body weight was increased. When the study was conducted in 2016, we reported all measurements (anthropometric, blood pressure and lipid) to the subjects. We assumed that this report might motivate them to improve their dietary pattern and reduce energy intake. However, despite energy intake being reduced (10 753 ± 4460 kJ/d in 2016 and 8871 ± 4360 kJ/d in 2018), the latest energy intake was still relatively higher than required to achieve energy balance or energy deficit. On average, the ratio of energy intake/resting energy expenditure was 1·75 in 2016 and 1·44 in 2018. Therefore, it is argued that despite energy intake being reduced, the latest energy intake was still higher than required and this might induce weight gain. This is proven by a positive correlation between energy intake and changes in adiposity measures.
In the present study, we report that UCP2 gene variation was not associated with baseline adiposity measures and their changes after 2 years. Similar to the present study, Oktavianthi et al.(Reference Oktavianthi, Trimarsanto and Febinia29) also showed that UCP2 gene variation was not associated with BMI among Indonesian adults living in Bali. The similarity between the present study and the previous study(Reference Oktavianthi, Trimarsanto and Febinia29) was that both studies were conducted among Indonesian adults within a close time frame. However, the study conducted by Oktavianthi et al.(Reference Oktavianthi, Trimarsanto and Febinia29) was conducted in rural and urban areas while our study was conducted only in an urban area. Interestingly, they also reported that among the similar genotype A/A, those who live in the urban area had higher BMI than those in the rural area. This shows that environmental factors might have an influence on the association between the UCP2 gene and obesity.
Results in the present study and in Oktavianthi et al.(Reference Oktavianthi, Trimarsanto and Febinia29) are different from other studies conducted in different populations. A meta-analysis of an observational study by Zhang et al.(Reference Zhang, Wang and Zhao30) has reported that the A allele of -866G/A UCP2 had a protective effect on overweight and obesity in a European population. The present study included data from 15 976 individuals from eighteen studies in Australia, Europe and Asia. In the overall population, they reported that -866G/A UCP2 was not associated with overweight and obesity. However, when data were stratified into European population (Australia, Italy, Denmark, Germany and Spain) and Asian population (China, India, Indonesia, Iran and Taiwan), they found the association become significant among the European population but not among the Asian population(Reference Zhang, Wang and Zhao30).
The direct protection effect of the A allele on obesity and weight gain is not reported in the present study. However, it is suggested that the A allele was protective towards the effect of higher energy intake. This was based on the observation that despite energy intake being positively correlated with changes in adiposity among those with the GG genotype, this correlation was not seen among those with the A allele (AA + GA). In our previous reports, we showed that the A allele was associated with better leptin sensitivity(Reference Luglio, Sulistyoningrum and Huriyati16). In a weight loss programme, it was reported that those with the AA + GA genotype had better weight loss response towards low-energy diet and exercise than those with the GG genotype(Reference Muhammad, Pratama and Hartono31).
It is suggested that the protective effect of the A allele against obesity is due to its direct link with UCP2 production and energy metabolism. UCP2 is responsible for decoupling process of energy transfer at mitochondria leading to proton leak(Reference Ricquier and Bouillaud32). Consequently, UCP2 has been reported to modulate the potential of mitochondrial membrane, respiration rate and thermogenesis(Reference Ricquier and Bouillaud32). In humans, the A allele of -866G/A UCP2 gene variation was associated with higher UCP2 mRNA expression in adipose tissue(Reference Esterbauer, Schneitler and Oberkofler14,Reference Krempler, Esterbauer and Weitgasser26) . In addition, it was also reported that those with the AA genotype of this gene variation had a higher energy expenditure than those with the GG genotype(Reference Kovacs, Ma and Hanson15).
There were several limitations to the present study. Firstly, all subjects in the present study are living in an urban area. Although this approach is beneficial to limit heterogeneity due to variation in environmental factors, results from the present study might not be applicable to the general population. It was recently reported that those who live in the urban and rural area of Yogyakarta province, Indonesia had different characteristics(Reference Susetyowati, Huriyati and Kandarina33). Adults who live in the urban area had higher body weight, body fat and central adiposity than those in the rural area. Additionally, the urban area was associated with a higher intake of wheat-based food products, animal protein and fried foods. It is argued that energy intake from rural and urban areas could come from different food sources, thus might potentially influence the association.
Secondly, participant attrition was high. This might affect the power of the analysis and conclusion generated by the present study because the number of subjects was reduced. The number of subjects with the effect allele in the present study is lower than the minimal requirement to evaluate gene × nutrients interaction. Recently, Grimaldi et al.(Reference Grimaldi, van Ommen and Ordovas34) suggested that for an observational study a minimal of 500 subjects per effect allele is required for development of guideline in personalised nutrition. One of the strength of the present study was a cohort prospective design which allows the evaluation of changes in adiposity measures within subjects. This could hopefully ameliorate potential bias normally found in a cross-sectional study.
Thirdly, despite the effort of the present study to evaluate the interaction between energy intake, physical activity and UCP2 gene variation, there might be other factors that influence changes in adiposity. Intake of other nutrients (i.e. fibre, vitamins and minerals) or foods (fruits, fast food and beverages) which might influence body weight was not evaluated because those were not in a direct correlation with UCP2. Moreover, energy intake might also interact with other genes which are not analysed in the present study. The variation of MC4R, FTO and LEP genes might interact with energy intake and have influence of weight gain(Reference Crovesy and Rosado35).
In summary, we report that UCP2 gene variation was not associated with changes in adiposity measures among Indonesian adults. By contrast, we show that energy intake was associated with body weight and body fat gain. The influence of energy intake on weight gain was significant among subjects with the GG genotype of UCP2 -866G/A but not among those with AA + GA genotypes. This suggests that those with the GG genotype had more sensitivity towards the effect of energy surplus on body weight.
Acknowledgements
We thank Cita Eri Ayuningtyas, Satwika Arya Pratama, Maya Nurfitriani Hartono, Fani Cahya Wahyuni, Ruth Helena Girsang and Erri Larene Safika on their involvement in managing data collection.
The present study was funded by Hibah Dana Masyarakat, Faculty of Medicine, UGM and International Research Collaboration grant (no. 1002/PPSK/910408) (Universiti Sains Malaysia).
Conceptualisation and methodology, H. F. L. M., D. C. S., E. H., Y. Y. L. and W. A. M. W. M.; investigation and data collection, H. F. L. M., D. C. S. and E. H.; data curation, H. F. L. M.; writing – original draft preparation, and review and editing; H. F. L. M., Y. Y. L. and W. A. M. W. M.; funding acquisition, H. F. L. M. and W. A. M. W. M.
The authors declare that there are no conflicts of interest.


