


Impact statement
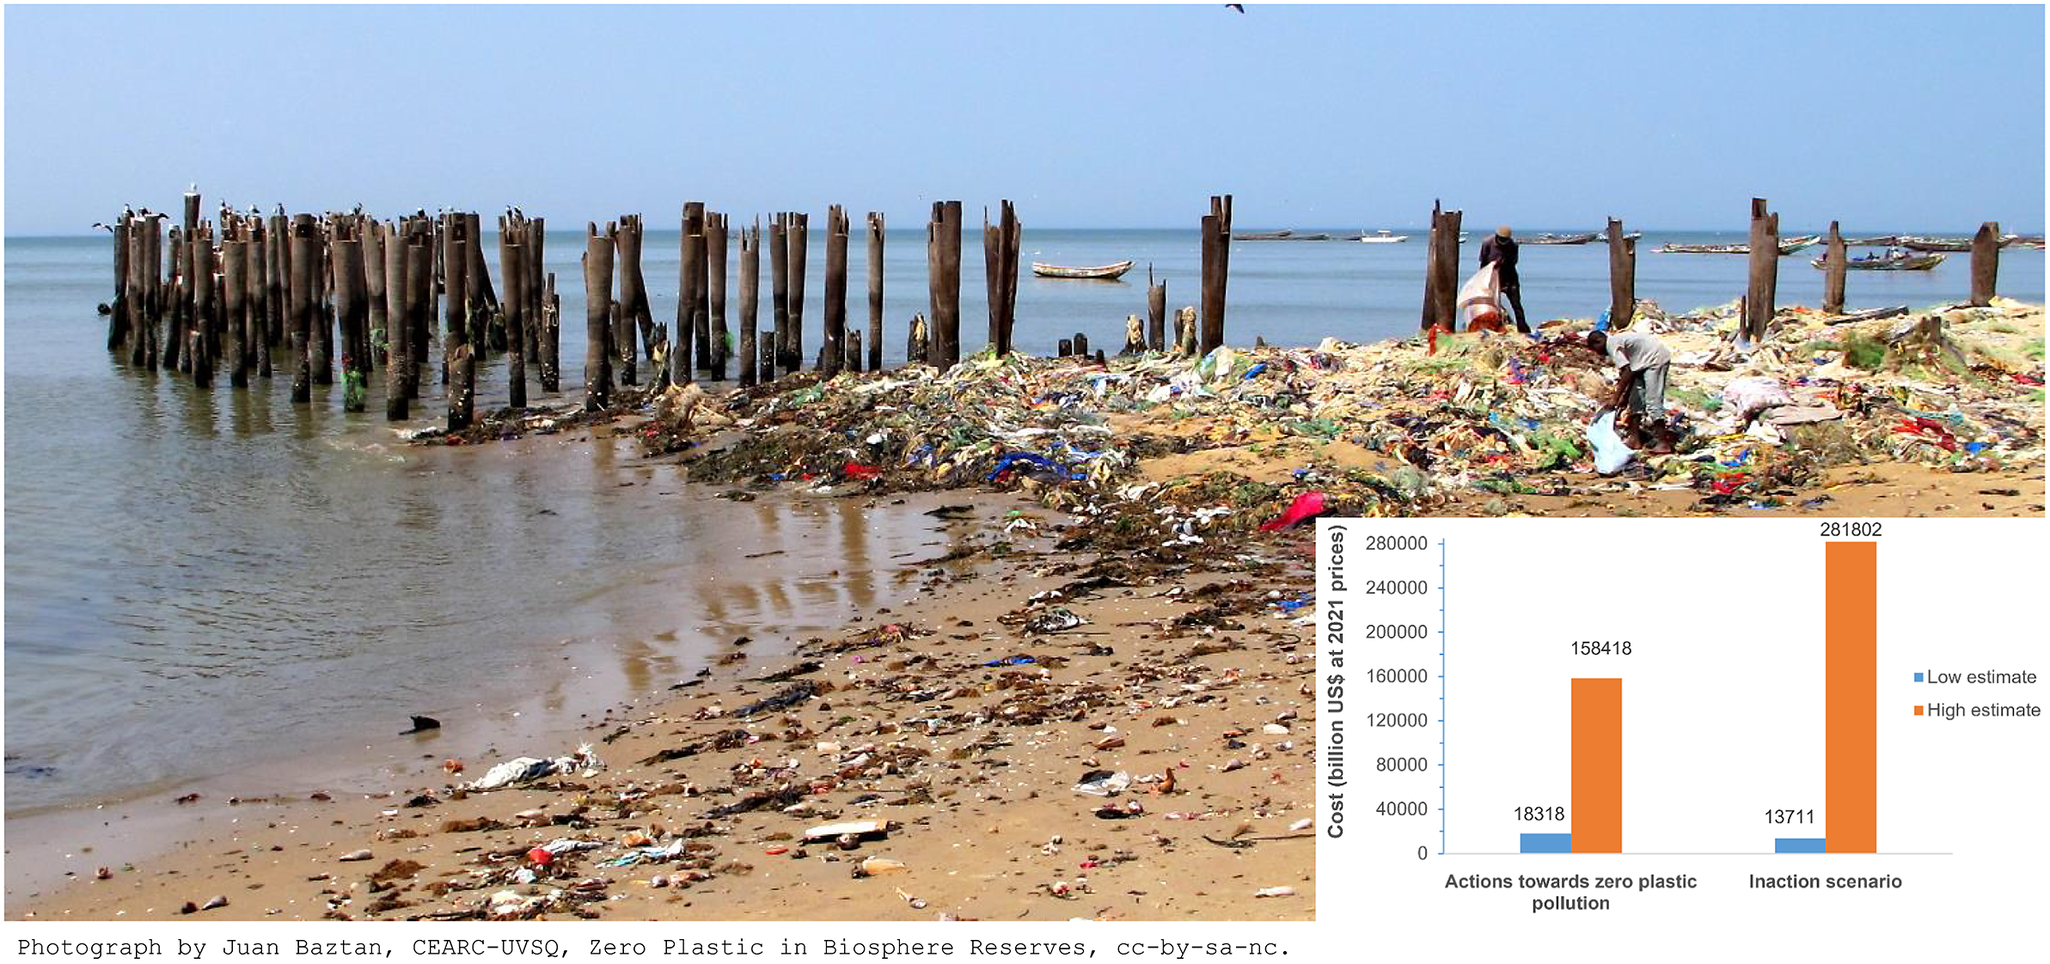
Lau et al. (Reference Lau, Shiran, Bailey, Cook, Stuchtey, Koskella, Velis, Godfrey, Boucher, Murphy, Thompson, Jankowska, Castillo Castillo, Pilditch, Dixon, Koerselman, Kosior, Favoino, Gutberlet, Baulch, Atreya, Fischer, He, Petit, Sumaila, Neil, Bernhofen, Lawrence and Palardy2020, Science 369, 1455–1461) show that reducing plastic production and replacing plastics with alternative materials could reduce the production of plastics by 47% in 2040. This would reduce plastic pollution in terrestrial and aquatic ecosystems. Other interventions are also needed, such as cleanups in oceans, rivers, beaches and all terrestrial ecosystems. Interventions such as reusing old plastic products, improved collection, sorting, recycling and disposal of municipal solid plastic waste are also required in many countries. Implementing all these interventions globally, in theory, would allow the environmental target of zero plastic debris in the global ecosystem by 2040 to be met. This would cost between US$ 18,000 billion and US$ 158,000 billion, meaning the cost of action is between the Gross Domestic Product (GDP) of China and 1.6 times the world GDP. On the other hand, if we do nothing to address plastic pollution, the cost of global environmental damages (estimated to be US$ 14,000–282,000 billion) could be significantly higher than the cost of taking actions to end plastic pollution. These actions will certainly produce environmental gain. They might also produce an economic gain but this requires further research to reduce uncertainty margins and confirm inaction is substantially more expensive than action.
Introduction
Plastics represent a group of polymers including natural, semisynthetic or synthetic materials that are malleable and can be modeled into solid objects (Chen and Yan, Reference Chen and Yan2020). Natural plastics such as horn, tortoiseshell, amber, rubber and shellac have been worked with since antiquity. However, the first synthetic plastic, Bakelite, is more recent and was invented by a Belgian chemist Leo Baekland in 1907 (Baekland, Reference Baekland1909; Science Museum, 2019). With the salient plastic virtues of low-cost, being lightweight, durable, odorless and versatile, among others, a large and rapid expansion of plastic manufacturing started in the 1950s (Chen and Yan, Reference Chen and Yan2020). In 1950, the annual production of plastic goods amounted to 2 million metric tons (MMT) globally and by 2018, it surpassed 450 MMT (Geyer et al., Reference Geyer, Jambeck and Law2017; Law and Narayan, Reference Law and Narayan2022). This global market growth is projected to be driven in the future largely by increasing plastic use in the construction, automotive and electrical and electronics industries (Grand View Research, 2022).
Scientists realized in the 2010s that a significant share of the massive amounts of plastics manufactured since 1950 had not been appropriately managed at the products’ end of life (Geyer et al., Reference Geyer, Jambeck and Law2017). Plastic waste mismanagement explains why plastics are now found in the form of plastic debris in absolutely all ecosystems: on land and in the ocean, even in its deepest parts at 11 km depth in the Mariana trench (Chiba et al., Reference Chiba, Saito, Fletcher, Yogi, Kayo, Miyagi, Ogido and Fujikura2018), and on all continents, even in Antarctica (Lacerda et al., Reference Lacerda, Rodrigues, Van Sebille, Rodrigues, Ribeiro, Secchi, Kessler and Proietti2019). Among all manufactured products, plastics are among the toughest to decay. The decomposition period of plastic waste in the environment is poorly understood but recent studies suggest it might range from decades to centuries and even several thousand years for several types of plastic products (Law and Narayan, Reference Law and Narayan2022). The half-life of plastic products ranges, for example, from 4.2 years to more than 2,500 years for plastic bags and from 12 years to more than 2,500 years for plastic bottles. The half-life is defined as the time in which the plastic material loses 50% of its original mass through natural biodegradation in the environment, which depends on environmental conditions (Chamas et al., Reference Chamas, Moon, Zheng, Qiu, Tabassum, Jang, Abu-Omar, Scottand and Suh2020). These estimations must, however, be considered cautiously as underlined in Ward and Reddy (Reference Ward and Reddy2020). They show the extreme difficulty of estimating degradation times and defining what “plastic degradation” means.
Annual discards of inadequately managed plastic waste have been estimated by Lebreton and Andrady (Reference Lebreton and Andrady2019), Lau et al. (Reference Lau, Shiran, Bailey, Cook, Stuchtey, Koskella, Velis, Godfrey, Boucher, Murphy, Thompson, Jankowska, Castillo Castillo, Pilditch, Dixon, Koerselman, Kosior, Favoino, Gutberlet, Baulch, Atreya, Fischer, He, Petit, Sumaila, Neil, Bernhofen, Lawrence and Palardy2020), Cordier et al. (Reference Cordier, Uehara, Baztan, Jorgensen and Yan2021) and Yan et al. (Reference Yan, Cordier and Uehara2022 and Reference Yan, Cordier and Uehara2024). Annual discards have been increasing at the global scale, for example, from 23 to 91 MMT per year in 2010 to 36–115 MMT per year in 2020, and will probably multiply by 2–4 over the period of 2020–2060 (Supplementary Figure S1). Inadequately managed plastic waste is highly likely to be encountered in ecosystems since it includes littered plastic waste (directly thrown on the ground by individuals) and plastics for which waste treatment consists of collective discarding in waterways and marine areas or landfilling in open dumps, making it likely to enter terrestrial or marine ecosystems via inland waterways, wastewater outflows, storm drains, transport by wind or tides or leakages from open dumps and open uncontrolled landfills (Jambeck et al., Reference Jambeck, Geyer, Wilcox, Siegler, Perryman, Andrady, Narayan and Law2015; Lebreton and Andrady, Reference Lebreton and Andrady2019; Cordier et al., Reference Cordier, Uehara, Baztan, Jorgensen and Yan2021). These annual flows of inadequately managed plastic waste accumulate over time in the environment. Summing annual flows year after year gives the total amount of plastic accumulated since 1950, which passed from 444 to 2,451 MMT in 2010 to 735–3,373 MMT in 2020 and is forecast to be multiplied by 3–9 between 2020 and 2060 if no serious plastic pollution reduction strategies are undertaken in the coming years (Figure 1).

Figure 1. Global cumulative discard of plastic waste inadequately managed over 1950–2060 – BAU scenario. Note: MMT: million metric tons. The curves are computed summing over time global annual discard of inadequately managed plastic waste (Supplementary Figure S1) provided by Lebreton and Andrady (Reference Lebreton and Andrady2019), Lau et al. (Reference Lau, Shiran, Bailey, Cook, Stuchtey, Koskella, Velis, Godfrey, Boucher, Murphy, Thompson, Jankowska, Castillo Castillo, Pilditch, Dixon, Koerselman, Kosior, Favoino, Gutberlet, Baulch, Atreya, Fischer, He, Petit, Sumaila, Neil, Bernhofen, Lawrence and Palardy2020), Cordier et al. (Reference Cordier, Uehara, Baztan, Jorgensen and Yan2021) and Yan et al. (Reference Yan, Cordier and Uehara2022).
A portion of the globally accumulated discards of inadequately managed plastic waste since 1950 (Figure 1) leaks into the environment and accumulates in terrestrial and aquatic ecosystems (Figure 2). The massive amounts of plastic debris accumulated in ecosystems explain why marine scientists have detected plastic particles in a wide variety of marine organisms including mussels, oysters, shrimps, daphnia, turtles, sea birds, fish and so forth (Peng et al., Reference Peng, Fu, Qi, Lan, Yu and Ge2020; Bajt, Reference Bajt2021). Across all studies accounting for microplastics, the incidence rate of plastic ingested by fish was 26%. Over the last decade, this incidence has doubled, increasing by 2.4% per year (Savoca et al., Reference Savoca, McInturf and Hazen2021). This presents serious threats to the health of marine animals, causing symptoms such as malnutrition, inflammation, chemical poisoning, growth thwarting, decrease of fecundity and death due to damages at individual, organ, tissue, cell and molecular levels (Peng et al., Reference Peng, Fu, Qi, Lan, Yu and Ge2020). This means human health is also affected through seafood consumption. Plastic particles have been detected in human blood (Leslie et al., Reference Leslie, Van Velzen, Brandsma, Vethaak, Garcia-Vallejo and Lamoree2022) and in human placenta (Ragusa et al., Reference Ragusa, Svelato, Santacroce, Catalano, Notarstefano, Carnevali, Papa, Rongioletti, Baiocco, Draghi, D’Amore, Rinaldo, Matta and Giorgini2021). Human health could be adversely affected stemming from both the exposure to chemicals contained in plastic components and from toxins that adsorb onto plastic debris from the surrounding seawater (Choy et al., Reference Choy, Robison, Gagne, Erwin, Firl, Halden, Hamilton, Katija, Lisin, Rolsky and Van Houtan2019).
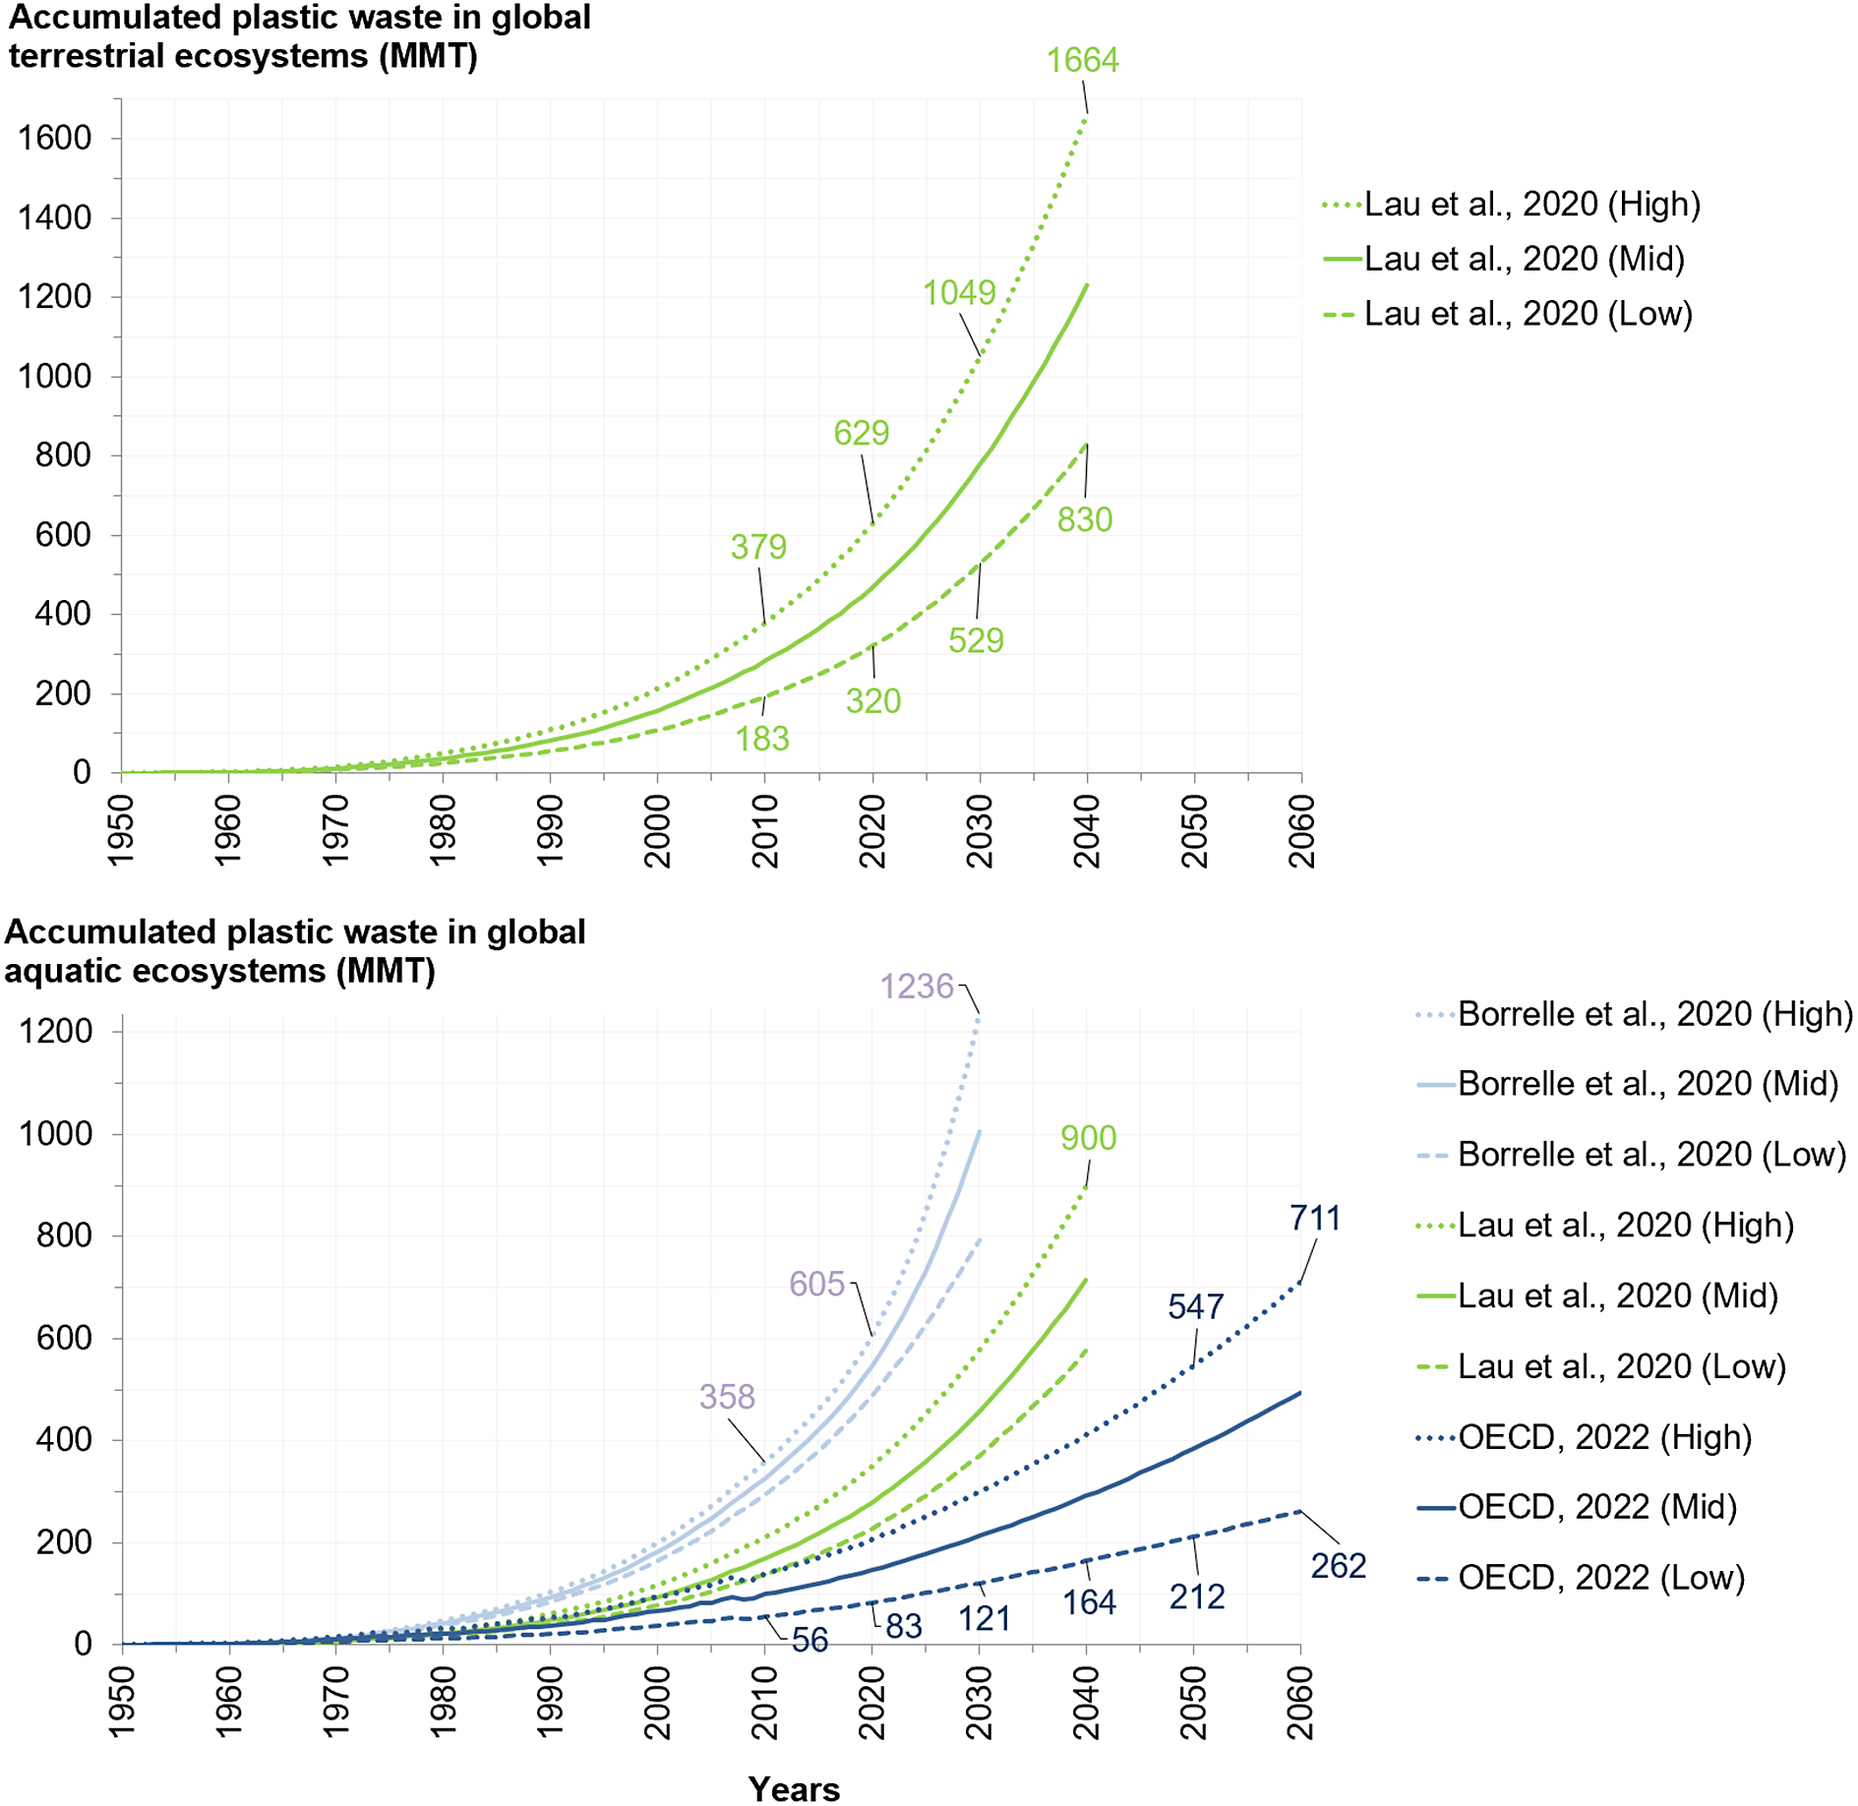
Figure 2. Global plastic debris accumulated over time in terrestrial (upper graph) and aquatic (lower graph) ecosystems over 1950–2060 – BAU scenario. Note: Aquatic ecosystems include lakes, rivers and oceans globally. The curves are obtained summing over time annual emissions of plastic waste into the ecosystems (Supplementary Figure S2) provided by Borrelle et al. (Reference Borrelle, Ringma, Law, Monnahan, Lebreton, McGivern, Murphy, Jambeck, Leonard, Eriksen, Possingham, De Frond, Gerber, Polidoro, Tahir, Bernard, Mallos, Barnes and Rochman2020), Lau et al. (Reference Lau, Shiran, Bailey, Cook, Stuchtey, Koskella, Velis, Godfrey, Boucher, Murphy, Thompson, Jankowska, Castillo Castillo, Pilditch, Dixon, Koerselman, Kosior, Favoino, Gutberlet, Baulch, Atreya, Fischer, He, Petit, Sumaila, Neil, Bernhofen, Lawrence and Palardy2020) and the OECD (2022). The OECD (2022) also provides accumulated values in 2019 and 2060. We used them to cross-check our computation method and make sure we did not make any mistakes.
The accelerated accumulation of plastic debris in the environment since the 2000s raises three questions that can no longer be avoided: (i) should we clean terrestrial and aquatic ecosystems polluted with plastics; (ii) should we stop producing and consuming plastics to avoid future pollution and (iii) is the cost of both options affordable and lower than the cost of inaction? The following sections help answer these questions. Section “Global estimations of plastic debris accumulated in the ecosystems” provides global estimations of the total amount of plastic debris accumulated in aquatic and terrestrial ecosystems. Section “Global cost of actions towards zero plastic debris in ecosystems by 2040” presents strategies to reduce plastic contamination of ecosystems and the cost of action. Section “Global cost of plastic pollution: The cost of inaction” shows the global cost of the impacts that will result from plastic pollution in case of inaction from now to 2040. Section “Global benefits obtained from plastics” provides a calculation of the net benefits (i.e., benefits minus costs) earned from plastic sales. Section “Discussion and conclusion” discusses the results, compares the cost and net benefits of action and inaction, and concludes.
Global estimations of plastic debris accumulated in the ecosystems
The total amount of plastic accumulated in global terrestrial ecosystems since 1950 is estimated to be 320–629 MMT in 2020 and is forecast to multiply by 2.6 by 2040 (Figure 2, upper graph). In aquatic ecosystems, the global amount accumulated since 1950 is estimated to be 83–605 MMT in 2020 and is forecast to multiply by 1.5 or 2 by 2040 (Figure 2, lower graph).
To calculate some of the costs of plastic pollution reduction strategies (Section “Global cost of actions towards zero plastic debris in ecosystems by 2040”), it is important to distinguish the compartments of aquatic ecosystems where plastic debris accumulates since they require distinct removal and cleanup technologies. Global plastic accumulation in the oceans since 1950 is estimated to be 18–385 MMT in 2020 (Figure 3). Once it reaches the ocean, plastic debris may move to different parts of the marine environment. Data from the OECD (2022, p. 126) suggest that 87.8% of plastics reaching the global ocean are floating close to the ocean shoreline, 9.8% sink to the seabed, and 2.4% are transported offshore by marine currents and continue floating on the ocean surface (Figure 3). In rivers, the accumulation of floating plastics is estimated to be 18–45 MMT in 2020. For plastic debris sinking to riverbeds and lakebeds, accumulated amounts are estimated to be 46–114 MMT in 2020 (Figure 3).

Figure 3. Global plastic debris accumulated over time in aquatic ecosystems disaggregated into oceans (upper graph), plastics floating in rivers (middle graph), and plastics sinking on riverbeds and lakebeds (lower graph) – BAU scenario. Note: The curves are obtained summing over time estimations of annual emissions of plastic waste (Supplementary Figure S3) provided by Lebreton et al. (Reference Lebreton, Egger and Slat2019). The other models directly provided accumulated values (Jambeck et al., Reference Jambeck, Geyer, Wilcox, Siegler, Perryman, Andrady, Narayan and Law2015; Cordier and Uehara, Reference Cordier and Uehara2019; OECD, 2022).
Global cost of actions toward zero plastic debris in ecosystems by 2040
Plastic pollution reduction strategies can be organized into three categories (Cordier and Uehara, Reference Cordier and Uehara2019; Lau et al., Reference Lau, Shiran, Bailey, Cook, Stuchtey, Koskella, Velis, Godfrey, Boucher, Murphy, Thompson, Jankowska, Castillo Castillo, Pilditch, Dixon, Koerselman, Kosior, Favoino, Gutberlet, Baulch, Atreya, Fischer, He, Petit, Sumaila, Neil, Bernhofen, Lawrence and Palardy2020): (i) upstream preventive strategies designed to avoid plastics being produced (implemented at pre-consumption stages, e.g., reducing production and demand of plastics); (ii) mid-stream preventive strategies aimed at preventing plastic waste from reaching the environment (implemented at post-consumption stages, e.g., waste collection and recycling) and (iii) downstream curative strategies designed to clean legacy pollution in ecosystems where plastic debris has already accumulated (implemented at post-consumption stages, e.g., ocean cleanup). The costs of several strategies belonging to these three categories are presented below. All costs hereinafter are expressed in US$ at prices for the year 2021 (unless otherwise stated), which explains why the cost data provided in this paper may slightly differ from those in their original publications. Costs estimated over a period of time of several years in this paper are all calculated summing annual costs year-by-year over the period and using a discount rate of 3.5%. Private costs are estimated in Sections “ Upstream solution: Stopping plastic production”–“ Downstream solution: Terrestrial and aquatic ecosystem cleanup”, and external costs and social costs in Section “Global cost of plastic pollution: The cost of inaction” (Table 1 summarizes them). “The idea underlying the notion of social cost is a very simple one. A man initiating an action does not necessarily bear all the costs (or reap all the benefits) himself. Those that he does bear are private costs; those he does not are external costs. The sum of the two constitutes the social cost” (de and Graaff, Reference de and Graaff2018). Private costs are paid by the firm or the consumer and are included in production and consumption decisions. External costs, on the other hand, are not reflected on firms’ income statements or in consumers’ decisions. However, external costs remain costs to society, regardless of who pays for them (Federal Reserve Bank of San Francisco, 2002). Consider a firm or a consumer polluting the marine environment with plastic waste. Because of the firm’s or consumer’s actions, people regularly eating sea food contaminated with plastics (micro- and nanoplastics) might suffer health effects, tourists may find beaches less attractive due to plastic waste, the beauty of littoral landscapes is damaged, marine animals die through plastic ingestion and entanglement and so forth. When external costs like these exist, they must be added to private costs to determine social costs and to ensure that a socially efficient rate of output is generated (i.e., outputs of plastic products and plastic waste).
Table 1. Global cost forecast of plastic pollution impacts (in case of inaction) and plastic pollution reduction strategies (in case of action toward zero plastics in ecosystems by 2040)

Note: All costs are in billion US$ at prices of the year 2021 and are total values calculated over 2016–2040 with a discount rate of 3.5%. This Table is based on data from Sections “Global cost of actions towards zero plastic debris in ecosystems by 2040” and “Global cost of plastic pollution: The cost of inaction”.
* Calculated in Section “Combining upstream, middle, and downstream solutions: system change scenario” for the “system change scenario,” which includes: (i) upstream interventions (reducing plastic production by 47% and substituting plastics with alternative materials), (ii) middle stream interventions (improving plastic waste collection and disposal, increasing plastic recycling), and a downstream solution (beach cleanup).
** Calculated in Section “ Downstream solution: Terrestrial and aquatic ecosystem cleanup” for cleanup of the legacy pollution, that is, plastic debris still remaining in terrestrial and aquatic ecosystems after implementing the “system change scenario.”
+ Calculated in Section “Combining upstream, middle, and downstream solutions: system change scenario” for the BAU scenario.
++ Calculated in Section “Global cost of plastic pollution: The cost of inaction”.
Upstream solution: Stopping plastic production
A solution that would succeed in reducing plastic emissions into the environment by nearly 100% would consist in entirely stopping plastic production. A report from Grand View Research (2022) estimates the global market share of plastics to be US$ 593 billion in 2021. Our own calculation (see Section S3 in Supplementary materials) is based on the world input–output table for 2014 (Timmer et al., Reference Timmer, Dietzenbacher, Los, Stehrer and de Vries2015) and provides results in the same order of magnitude, that is, the global value-added annually produced by the plastic and rubber sector estimated to be US$ 667 billion in 2021. Hence, if all intermediate consumers (industries and businesses) as well as final consumers (investors, households, public sectors and nonprofit organizations) would stop purchasing plastic products, the global value-added loss would range from US$ 593 to 667 billion, that is 0.6–0.7% of the world Gross Domestic Product (GDP) in 2021. This is the direct economic cost of stopping plastic production from 1 day to the next without a transition period. This is a private cost, that is, the cost borne by the producers initiating the action (i.e., shutting down their plastic production activity).
This cost is underestimated since indirect economic costs on suppliers are not considered. Considering them would triple the estimation of the global value-added loss. Indeed, if plastic and rubber production would entirely stop, plastic and rubber industries would have to shut down and their suppliers would no longer be able to sell them energy, raw materials, semi-finished goods and services. Such indirect costs can be taken into account – in addition to direct costs – using Leontief’s input–output equations (Leontief, Reference Leontief1936, Reference Leontief1970; Miller and Blair, Reference Miller and Blair2009, p. 21; Uehara et al., Reference Uehara, Cordier and Hamaide2018, p. 4). Input–output equations provide further economic details reflecting inter-industrial sales of intermediate inputs between economic sectors (intermediate consumers), in addition to sales to final consumers. We simulated direct and indirect costs of stopping plastic production in the world input–output table (Timmer et al., Reference Timmer, Dietzenbacher, Los, Stehrer and de Vries2015), which we modified setting to zero the sales of goods and services from plastic and rubber industries to intermediate and final consumers, as well as the purchases of goods and services by plastic and rubber industries from other economic sectors. By using the modified world input–output table to run Leontief’s input–output equations (see Supplementary materials, Section S3), we estimate the global GDP loss to be 1.9% in 2021, which includes the direct and indirect costs resulting from entirely stopping plastic and rubber production. This represents an annual loss of US$ 1875 billion. Such a scenario is unlikely in 2023, as such a drastic solution would require a transition period of several years for the global economic system to adapt to avoid a huge economic cost as well as unavoidable massive employment losses. Plastics are materials used in virtually every sector of manufacturing and use. If plastics production were to cease entirely, there would be a massive disruption in society (which is not taken into account by the Leontief’s input–output equations we run), well beyond unemployment and lost sales. However, with the international United Nations Treaty on Plastic Pollution planned to be finalized in 2024, the political and legislative context might contribute to creating incentives in that direction.
Combining upstream, middle and downstream solutions: System change scenario
Lau et al. (Reference Lau, Shiran, Bailey, Cook, Stuchtey, Koskella, Velis, Godfrey, Boucher, Murphy, Thompson, Jankowska, Castillo Castillo, Pilditch, Dixon, Koerselman, Kosior, Favoino, Gutberlet, Baulch, Atreya, Fischer, He, Petit, Sumaila, Neil, Bernhofen, Lawrence and Palardy2020) explain that neither upstream preventive interventions nor downstream curative interventions alone are sufficient to address plastic pollution. Combining the maximum foreseen application of preventive and curative interventions, that is at pre- and post-consumption stages, is the only way to achieve significant plastic pollution reduction in the future (Cordier and Uehara, Reference Cordier and Uehara2019; Lau et al., Reference Lau, Shiran, Bailey, Cook, Stuchtey, Koskella, Velis, Godfrey, Boucher, Murphy, Thompson, Jankowska, Castillo Castillo, Pilditch, Dixon, Koerselman, Kosior, Favoino, Gutberlet, Baulch, Atreya, Fischer, He, Petit, Sumaila, Neil, Bernhofen, Lawrence and Palardy2020). Lau et al. (Reference Lau, Shiran, Bailey, Cook, Stuchtey, Koskella, Velis, Godfrey, Boucher, Murphy, Thompson, Jankowska, Castillo Castillo, Pilditch, Dixon, Koerselman, Kosior, Favoino, Gutberlet, Baulch, Atreya, Fischer, He, Petit, Sumaila, Neil, Bernhofen, Lawrence and Palardy2020) simulated such a combined scenario, which they named the “system change scenario” (SCS). This scenario simulates upstream interventions by considering opportunities to reduce the total plastic quantity produced globally (e.g., through reuse, eliminations such as bans on single-use plastic bags, eliminating plastic overpackaging etc.) and to substitute plastics with alternative materials (i.e., paper, coated paper and compostable materials). They did not include in the “SCS” substitute materials that would result in higher life-cycle greenhouse gas emissions compared to plastics (e.g., single-use glass, aluminum and laminated cartons). They also excluded substitute materials with unacceptable health or performance risks (Lau et al., Reference Lau, Shiran, Bailey, Cook, Stuchtey, Koskella, Velis, Godfrey, Boucher, Murphy, Thompson, Jankowska, Castillo Castillo, Pilditch, Dixon, Koerselman, Kosior, Favoino, Gutberlet, Baulch, Atreya, Fischer, He, Petit, Sumaila, Neil, Bernhofen, Lawrence and Palardy2020, pp. S18–S22 and Supplementary Table S20). They assessed the applicability of each reduction and substitution lever to different categories of plastic based on existing businesses, policies, available technologies, environmental trade-offs and consumer trends observed to date.
Lau et al. (Reference Lau, Shiran, Bailey, Cook, Stuchtey, Koskella, Velis, Godfrey, Boucher, Murphy, Thompson, Jankowska, Castillo Castillo, Pilditch, Dixon, Koerselman, Kosior, Favoino, Gutberlet, Baulch, Atreya, Fischer, He, Petit, Sumaila, Neil, Bernhofen, Lawrence and Palardy2020) also include mid-stream interventions by simulating improvements to plastic waste collection and disposal systems in order to substantially reduce plastic waste mismanagement (e.g., investments required to replace open dumps by controlled landfills, to increase plastic recycling etc.). A downstream curative solution is also taken into account in the scenario: beach cleanups to remove plastic debris found in the sand. The full set of their intervention measures is available in Lau et al. (Reference Lau, Shiran, Bailey, Cook, Stuchtey, Koskella, Velis, Godfrey, Boucher, Murphy, Thompson, Jankowska, Castillo Castillo, Pilditch, Dixon, Koerselman, Kosior, Favoino, Gutberlet, Baulch, Atreya, Fischer, He, Petit, Sumaila, Neil, Bernhofen, Lawrence and Palardy2020, Supplementary materials, pp. 71 and 126).
Their results show that annual plastic emissions into the global ecosystem – terrestrial and aquatic together (see Section S1 in Supplementary materials for annual values) – could be decreased by 75–84% in 2040 with the “SCS” relative to the business-as-usual scenario (BAU) (the BAU level is the one that would be achieved if no plastic pollution abatement strategies are undertaken other than those already implemented before 2020). However, when summing annual emissions year-by-year over 1950–2040 to compute accumulated values (using the same calculation method as explained below Figure 2, and Supplementary Figures S1 and S2), the reduction is much lower. Accumulated emissions of plastic debris over 1950–2040 in the “SCS” (not shown in Figure 2) amount to 368–574 MMT in aquatic ecosystems and 547–1,148 MMT in terrestrial ecosystems, whereas in the BAU scenario they amount to 576–900 MMT and 830–1,664 MMT (Figure 2, Lau et al., curves), respectively. This represents a decrease of only 31–36% compared to BAU accumulated levels.
Lau et al. (Reference Lau, Shiran, Bailey, Cook, Stuchtey, Koskella, Velis, Godfrey, Boucher, Murphy, Thompson, Jankowska, Castillo Castillo, Pilditch, Dixon, Koerselman, Kosior, Favoino, Gutberlet, Baulch, Atreya, Fischer, He, Petit, Sumaila, Neil, Bernhofen, Lawrence and Palardy2020) estimate that from 2016 to 2040, the total cost of implementing the “SCS” would be US$ 470–892 billion (low and high estimate) with a best estimate of US$ 778 billion. In that scenario, plastic pollution reduction strategies start in 2020 and end in 2040. In the BAU scenario, the total net cost is estimated to be US$ 953 billion (best estimate) with a low and high estimate of US$ 643–1,077 billion (Lau et al., Reference Lau, Shiran, Bailey, Cook, Stuchtey, Koskella, Velis, Godfrey, Boucher, Murphy, Thompson, Jankowska, Castillo Castillo, Pilditch, Dixon, Koerselman, Kosior, Favoino, Gutberlet, Baulch, Atreya, Fischer, He, Petit, Sumaila, Neil, Bernhofen, Lawrence and Palardy2020). The cost estimations in both scenarios cover the cost of collecting, sorting, recycling and disposing of plastic municipal solid waste and are net of revenues associated with the sale of recycled plastic feedstock and electricity generated from plastic incineration with energy recovery (Lau et al., Reference Lau, Shiran, Bailey, Cook, Stuchtey, Koskella, Velis, Godfrey, Boucher, Murphy, Thompson, Jankowska, Castillo Castillo, Pilditch, Dixon, Koerselman, Kosior, Favoino, Gutberlet, Baulch, Atreya, Fischer, He, Petit, Sumaila, Neil, Bernhofen, Lawrence and Palardy2020, p. 9). These estimations are private costs, that is, the cost borne by the municipality (financed by taxpayers) or sometimes a private company contracted by the municipality to handle household waste. All these costs are net present value displayed on graphs published in Lau et al. (Reference Lau, Shiran, Bailey, Cook, Stuchtey, Koskella, Velis, Godfrey, Boucher, Murphy, Thompson, Jankowska, Castillo Castillo, Pilditch, Dixon, Koerselman, Kosior, Favoino, Gutberlet, Baulch, Atreya, Fischer, He, Petit, Sumaila, Neil, Bernhofen, Lawrence and Palardy2020) as well as in their Excel files available in Zenodo (downloadable from this link: https://zenodo.org/record/3929470).Footnote 1
These cost estimates correspond with the level of global discards of inadequately managed plastic waste estimated by Lau et al. (Reference Lau, Shiran, Bailey, Cook, Stuchtey, Koskella, Velis, Godfrey, Boucher, Murphy, Thompson, Jankowska, Castillo Castillo, Pilditch, Dixon, Koerselman, Kosior, Favoino, Gutberlet, Baulch, Atreya, Fischer, He, Petit, Sumaila, Neil, Bernhofen, Lawrence and Palardy2020)‘s model (Figure 1 and Supplementary Figure S1). However, among all models from Figure 1 and Supplementary Figure S1, Lau et al. (Reference Lau, Shiran, Bailey, Cook, Stuchtey, Koskella, Velis, Godfrey, Boucher, Murphy, Thompson, Jankowska, Castillo Castillo, Pilditch, Dixon, Koerselman, Kosior, Favoino, Gutberlet, Baulch, Atreya, Fischer, He, Petit, Sumaila, Neil, Bernhofen, Lawrence and Palardy2020) provide estimates that are among the low and middle curves. Therefore, it might be interesting to consider also high estimates of inadequately managed plastic waste in the estimation of costs in order to reflect the full range of model estimations. If we consider the highest curve in Figure 1, computed based on Lebreton and Andrady (Reference Lebreton and Andrady2019), and assuming a direct proportionality between waste management costs and the discard of inadequately managed plastic waste, the net cost of Lau et al.’s scenarios would reach US$ 643–1,612 billion for the BAU scenario (“Inaction scenario” in Table 1) and US$ 470–1,335 billion for the “SCS” (“Action scenario” in Table 1). This means the “SCS” is actually US$ 174–277 billion cheaper than the BAU scenario. In other words, changing the system toward less plastics brings about a benefit, not a cost. This is because although some waste management costs increase in the “SCS” compared to the BAU scenario, these additional costs are offset by: (i) revenues from increased quantities of recycled plastic sold by municipalities to the private sector as a raw material (it is usually municipalities that are responsible for collecting and managing household waste) and (ii) savings earned by municipalities from reduced plastic production (because it leads to lower waste production and therefore implies that less waste has to be managed by municipalities, thus reducing plastic waste disposal costs) (Lau et al., 2020, p. 3).
However, other private costs might arise in the private sector, for example, involving corporate engagement, through improved product design, alternative material development and new business models that will be necessary to implement the “SCS” (Lau et al., Reference Lau, Shiran, Bailey, Cook, Stuchtey, Koskella, Velis, Godfrey, Boucher, Murphy, Thompson, Jankowska, Castillo Castillo, Pilditch, Dixon, Koerselman, Kosior, Favoino, Gutberlet, Baulch, Atreya, Fischer, He, Petit, Sumaila, Neil, Bernhofen, Lawrence and Palardy2020, p. 3). This engagement will require a significant shift in private sector investment through a transition period. The transition cost for the private sector is not estimated in Lau et al. (Reference Lau, Shiran, Bailey, Cook, Stuchtey, Koskella, Velis, Godfrey, Boucher, Murphy, Thompson, Jankowska, Castillo Castillo, Pilditch, Dixon, Koerselman, Kosior, Favoino, Gutberlet, Baulch, Atreya, Fischer, He, Petit, Sumaila, Neil, Bernhofen, Lawrence and Palardy2020) since their estimate covers only waste management costs, which are generally borne by taxpayers. However, they estimate that in the “SCS,” progressively reducing plastic production and substituting plastics with alternative materials would lead to decreasing plastic production by 47% in 2040. They simulated this scenario assuming a gradual reduction of production through a transition period of 20 years starting in 2021 and ending in 2040. Hence, in the “Action scenario” (Table 1), we reflect that transition period by gradually increasing the reduction by 2.35 percentage points each year compared to the 2021 production level in the BAU scenario. It starts with a reduction percentage of 2.35% in 2021, 4.70% in 2022, 7.05% in 2023, …, 44.65% in 2039 and 47% in 2040 compared to the BAU production level in 2021. Based on these percentages, we estimated a part of the transition cost for the private sector. If such a production decrease would occur in the plastic industry at the global scale, taking into account the direct effects on plastic industries as well as indirect effects on their suppliers, it would generate a global GDP loss going from 0.05% in 2021 to up to 1.00% in 2040, which represents an annual loss going from US$ 52.3 billion in 2021 to US$ 963.5 billion in 2040. We computed this estimation with the world input–output model mentioned in Section “Upstream solution: Stopping plastic production” (see also Sections S3 and S6 in Supplementary materials). The 20-year transition period allows plastic businesses to take the time required for restructuring and adapting their activity to a low plastic economy. This transition time is also needed for alternative materials markets to grow and replace the vast array of market applications of plastics (offsetting the losses in the traditional plastics industry). Our estimation gives a total cost of transition for the private sector amounting to US$ 4,847–5,317 billion (Table 1). This is the total present value estimated with a discount rate of 3.5% over 2021–2040. Some industries will be able to rapidly produce alternative materials and replace plastic materials across the 20-year transition period, which will create positive economic growth opportunities for new businesses. Other businesses will take more time but in any case, annual production of substitute materials are expected to grow every year under the SCS from 2.0 million to 62.1 million tons per year across 2021–2040 (low estimate) or from 2.6 million tons/year to 81.1 million tons/year (high estimate) – low and high estimates are provided by Lau et al. (Reference Lau, Shiran, Bailey, Cook, Stuchtey, Koskella, Velis, Godfrey, Boucher, Murphy, Thompson, Jankowska, Castillo Castillo, Pilditch, Dixon, Koerselman, Kosior, Favoino, Gutberlet, Baulch, Atreya, Fischer, He, Petit, Sumaila, Neil, Bernhofen, Lawrence and Palardy2020) in Zenodo (available here: https://zenodo.org/record/3929470). This will generate benefits that are considered in our estimations of the 20-year transition cost. The low and the high estimates of the transition period cost displayed in Table 1 (which are calculated in Supplementary materials, Section S6.1) assume that annual production of substitute materials will grow following the low and high estimate ranges provided by Lau et al. (Reference Lau, Shiran, Bailey, Cook, Stuchtey, Koskella, Velis, Godfrey, Boucher, Murphy, Thompson, Jankowska, Castillo Castillo, Pilditch, Dixon, Koerselman, Kosior, Favoino, Gutberlet, Baulch, Atreya, Fischer, He, Petit, Sumaila, Neil, Bernhofen, Lawrence and Palardy2020), respectively (i.e., 2.0–62.1 million tons/year and 2.6–81.1 million tons/year across 2021–2040, respectively).
Downstream solution: Terrestrial and aquatic ecosystem cleanup
Cost estimations from Lau et al. (Reference Lau, Shiran, Bailey, Cook, Stuchtey, Koskella, Velis, Godfrey, Boucher, Murphy, Thompson, Jankowska, Castillo Castillo, Pilditch, Dixon, Koerselman, Kosior, Favoino, Gutberlet, Baulch, Atreya, Fischer, He, Petit, Sumaila, Neil, Bernhofen, Lawrence and Palardy2020) presented in Section “Combining upstream, middle, and downstream solutions: system change scenario” do not include cleanup interventions in aquatic ecosystems. The same for terrestrial ecosystems (only beach cleanups are considered in Lau et al.). However, under the “SCS,” a large amount of plastic debris still remains in ecosystems due to the legacy pollution. It must be removed if we want damages caused to living organisms (humans included) to stop. Figure 2 shows that the total amount of plastics accumulated at the global scale over 1950–2040 is expected to reach 830–1,664 MMT in terrestrial ecosystems (Figure 2 upper graph) and 164–900 MMT in aquatic ecosystems (Figure 2 lower graph) under the BAU scenario. Under the “SCS,” this amount is expected to drop by 31.0–34.1% in terrestrial ecosystems and by 36.1–36.2% in aquatic ecosystems (Section “Combining upstream, middle, and downstream solutions: system change scenario”). Applying these reduction percentages to the BAU values displayed in Figures 2 and 3 gives an amount of plastic debris accumulated from 1950–2040 under the “SCS” of 547–1,148 MMT for plastic accumulated on terrestrial ecosystems, 0.6–9 MMT for plastics floating in the ocean offshore, 21–331 MMT for plastics floating in the ocean close to the shoreline, 2–37 MMT for plastics sinking to the seabed, 22–56 MMT for plastics floating in rivers and 49–122 MMT for plastics sinking to lake- and riverbeds. The resulting cleanup cost are calculated in the following paragraphs.
Assuming that beach cleanup practices can be applied to remove plastic debris in all terrestrial ecosystems, we multiply the total amount of plastic accumulated in terrestrial ecosystems under the “SCS” (calculated in previous paragraph) by the beach cleanup unit cost, which is estimated to be US$ 1.26–2.06 per kg of plastic collected – unit cost provided by Cruz et al. (Reference Cruz, Muñoz-Perez, Carrasco-Braganza, Poullet, Lopez-Garcia, Contreras and Silva2020, p. 7) for achieving a degree of cleanliness ranging from clean to very clean. This gives a total present value of US$ 507–1739 billion (Table 1), which is the private cost to remove the total amount of plastic debris accumulated over 1950–2040 in terrestrial ecosystems at the global scale under the “SCS” (starting cleanup activities in 2020 and ending in 2040 as in Lau et al.’s scenario).
Figure 3 (upper graph) shows that plastic debris accumulated in the global ocean will reach 38–590 MMT in 2040 under the BAU scenario. The box on the graph shows that 87.8% of these plastics are floating close to the shoreline and 2.4% are floating offshore. This represents a total amount of 33–518 MMT for plastic debris floating close to the shoreline and of 0.9–14 MMT for plastic debris floating offshore under the BAU scenario. Under the “SCS,” these amounts are expected to drop to 21–331 MMT for plastic debris floating close to the shoreline and to 0.6–9 MMT for plastic debris floating offshore. The unit cost of the technology developed by The Ocean Cleanup to remove plastics floating offshore is estimated between US$ 26.6 and US$ 37.3 per kg of plastic (The Ocean Cleanup, 2021; Tjallema, Reference Tjallema2022). The lower margin is the cost The Ocean Cleanup foundation expects to achieve in the short-term based on scaled current technology (System 03), and the higher margin is the cost of the current technology (System 02). To estimate the removal cost of plastics floating offshore, we use this range US$ 26.6–37.3 per kg. To estimate the removal costs of plastics floating close to the shoreline, we did not find any data. However, we assume this cost to be cheaper than offshore costs since transporting collected plastic debris back to land (to be sent to waste treatment facilities) operates over a much shorter distance than offshore plastics, reducing fuel costs. Therefore, we used the lower unit cost estimated by The Ocean Cleanup foundation, US$ 16.0 per kg, which is the cost they expect to achieve in the period after optimization (System 04). Based on these unit costs, starting ocean cleanup activities in 2020 and ending in 2040, we estimate US$ 11–248 billion to be the total present value of the private cost required to remove the total amount of plastic debris floating offshore in the global ocean accumulated over the period of 1950–2040 under the “SCS.” The total present value of the removal cost for plastics floating close to the shoreline is estimated to be US$ 251–3,895 billion (Table 1).
Here, we do not consider the cleanup cost for plastic debris on the seabed (9.8% of plastics accumulated in the ocean – box in Figure 3, upper graph) since the depth and the costs are probably too high to be considered as a serious option. Cleanup of accumulated plastic debris on lake- and riverbeds is not considered either because of lack of robust unit cost data per kg. Figure 3 (lower graph) shows plastic pollution in these environments will reach 76–192 MMT in 2040 under the BAU scenario, twice the amount of plastic floating in rivers (Figure 3, middle graph). This should be considered in a further study.
Figure 3 (middle graph) shows that floating plastic debris accumulated in rivers globally will reach 35–88 MMT in 2040 under the BAU scenario. Under the “SCS,” this is expected to drop to 22–56 MMT. We multiplied this range by the unit costs of floating plastic removal technologies in rivers (sea bins, trash racks and booms), which is estimated to be US$ 1.4–33.3 per kg of plastic removed (Nikiema and Asiedu, Reference Nikiema and Asiedu2022, p. 24568). The multiplication gives a total present value of US$ 23–1,373 billion (starting cleanup activities in 2020 and ending in 2040) as the private cost to remove the total amount of floating plastic debris accumulated in rivers from 1950 to 2040 under the “SCS.”
All these private costs are summarized in Table 1 and Figure 4 and compared to the cost of inaction, which is estimated in Section “Global cost of plastic pollution: The cost of inaction”.

Figure 4. Comparison of global total cost of action (left bars) and inaction (right bars) over 2016–2040. Note: The graph is based on data from Table 1. The lower estimates suggest the cost of inaction (US$ 13,711 billion) is slightly cheaper than the one of action (US$ 18,318 billion). However, given the costs and benefits calculated and the missing data (discussed in Section “Discussion and conclusion”), it is not clear that the total cost of action is substantially higher than the one of inaction. Given the incomplete nature of this analysis, it is possible that the total cost of inaction is substantially higher as suggested by the high estimate (inaction cost: US$ 281,802 billion, which is significantly more expensive than action cost: US$ 158,418 billion).
Global cost of plastic pollution: The cost of inaction
Although there is little question about the negative and persistent impacts of plastic pollution on the environment (MacLeod et al., Reference MacLeod, Arp, Tekman and Jahnke2021), “how much does it cost” is a question not well investigated yet. A few studies have estimated the global annual cost of plastic pollution in terms of its negative impact on the environment. UNEP (2014) was the first to calculate the global cost of plastic pollution, which was estimated to be US$ 89 billion per year. This cost includes plastic-derived environmental damages to natural capital through greenhouse gas emissions, water extraction, air, water and land pollution during the extraction of natural resources and their conversion into plastic feedstock as well as during plastic product end-of-life stages during waste collection and treatment. UNEP (2014) also estimates the downstream impact caused by plastic litter leakages into the marine environment, including economic losses incurred by fisheries and tourism due to plastic litter (e.g., vessel damage caused by plastic waste snarled in a ship’s propellers), loss of amenity caused by litter, time and money spent cleaning up beaches, and the ecological cost linked to the loss of species based on monetary valuation approaches, which use surveys to estimate how much society would be willing to pay to prevent species loss through plastic ingestion and entanglement. They estimate the global cost of plastic litter leakages into marine environments to be US$ 15 billion per year.
However, UNEP (2014) calculated these costs before the first estimations of global plastic emissions into the ecosystems were provided by scientists, that is, Jambeck et al. (Reference Jambeck, Geyer, Wilcox, Siegler, Perryman, Andrady, Narayan and Law2015), Lebreton et al. (Reference Lebreton, Egger and Slat2019), Borrelle et al. (Reference Borrelle, Ringma, Law, Monnahan, Lebreton, McGivern, Murphy, Jambeck, Leonard, Eriksen, Possingham, De Frond, Gerber, Polidoro, Tahir, Bernard, Mallos, Barnes and Rochman2020), Lau et al. (Reference Lau, Shiran, Bailey, Cook, Stuchtey, Koskella, Velis, Godfrey, Boucher, Murphy, Thompson, Jankowska, Castillo Castillo, Pilditch, Dixon, Koerselman, Kosior, Favoino, Gutberlet, Baulch, Atreya, Fischer, He, Petit, Sumaila, Neil, Bernhofen, Lawrence and Palardy2020) and the OECD (2022). As a result, we decided not to rely on UNEP (2014), which recognizes in its report that their cost estimations suffer severe limitations: “while the upstream impacts of producing plastic feedstock are included, the impacts of the manufacturing stage are excluded due to their diversity. Downstream impacts, in particular of plastic waste reaching the ocean when littered, are likely to be underestimated due to the absence of robust data and scientific research (…)” (UNEP, 2014, pp. 10 and 24).
A WWF report authored by de Wit et al. (Reference de Wit, Burns, Guinchard and Ahmed2021) provides another estimate of the global cost of plastic pollution in the marine environment caused by plastic produced in 2019. They estimated this cost to be US$ 2,226–4,346 billion, with a mid-estimate of US$ 3,286 billion. However, as explained by de Wit et al. (Reference de Wit, Burns, Guinchard and Ahmed2021, p. 38), the WWF report’s estimation relies on and extrapolates from a scientific article published by Beaumont et al. (Reference Beaumont, Aanesen, Austen, Börger, Clark, Cole, Hooper, Lindeque, Pascoe and Wyles2019). Thereby, we decided to rely directly and exclusively on Beaumont et al. (Reference Beaumont, Aanesen, Austen, Börger, Clark, Cole, Hooper, Lindeque, Pascoe and Wyles2019) in our paper.
Beaumont et al. (Reference Beaumont, Aanesen, Austen, Börger, Clark, Cole, Hooper, Lindeque, Pascoe and Wyles2019) estimated the global annual cost of plastic pollution in the marine environment to be US$ 3,975–39,753 per ton of marine plastic. (This global cost slightly differs from the original data provided in Beaumont et al. (Reference Beaumont, Aanesen, Austen, Börger, Clark, Cole, Hooper, Lindeque, Pascoe and Wyles2019) because, as mentioned in Section “Global cost of actions towards zero plastic debris in ecosystems by 2040”, all costs in our paper are expressed in US$ at prices for the year 2021 unless otherwise stated). Their estimations are external costs (see definition in first paragraph of Section “Global cost of actions towards zero plastic debris in ecosystems by 2040”) related to non-market ecosystem services. They exclusively considered the depreciation of marine natural capital – marine ecosystem services – caused by plastic pollution. The estimation from Beaumont et al. (Reference Beaumont, Aanesen, Austen, Börger, Clark, Cole, Hooper, Lindeque, Pascoe and Wyles2019) relies on a semi-systematic literature review of 1,191 data points, which they used to compute the impact scores of plastic pollution on marine ecosystem services by subject type (e.g., turtles, birds, fish etc.). The ecosystem services they considered cover three categories: provisioning, regulatory and cultural services following CICES’s classification (CICES, 2013). However, the fourth category, supporting services (Millennium Ecosystem Assessment, 2005), is lacking in Beaumont et al.’s estimation. The impact scores were translated into monetary values in 2011 by using the global database for ecosystem services values based on benefit transfer techniques (Costanza et al., Reference Costanza, de Groot, Sutton, van der Ploeg, Anderson, Kubiszewski, Farber and Turner2014). Benefit transfer is a well-known monetary valuation technique used in environmental economics to estimate the economic value of ecosystem services for which no money is exchanged on a market (Pearce et al., Reference Pearce, Atkinson and Mourato2006). For comparison with plastic reduction strategies estimated in Section “Global cost of actions towards zero plastic debris in ecosystems by 2040”, we multiplied year-by-year the total amount of plastic debris accumulated in the ocean with the global annual cost per ton of marine plastics across 25 years over the 2016–2040 period (using a discount rate of 3.5%, as for all other costs calculated over a period of time of several years in this paper). In the multiplication, for the amount of plastic debris accumulated over years, we used the highest estimation from Lebreton et al. (Reference Lebreton, Egger and Slat2019) and the lowest one from the OECD (2022) (Figure 3, upper graph). It gives a total global cost over the 2016–2040 period ranging from US$ 1862 billion to US$ 268,498 billion for the “Inaction scenario” and from US$ 1,003 billion to US$ 132,819 billion for the “Action scenario” (Table 1). The “Action scenario” causes damages to the ecosystems too (although its environmental cost is reduced by half compared to the “Inaction scenario”) because preventive and clean-up operations described in Section “Global cost of actions towards zero plastic debris in ecosystems by 2040” take time. They are implemented progressively on an annual basis. Meanwhile although plastic pollution is gradually reduced, plastic debris approaches the zero level in ecosystems by 2040 (see Supplementary Figure S4). And since plastic sinking on sea-, lake- and riverbeds are not cleaned up in the “Action scenario,” a residual amount remains present in the ecosystems by 2040 (between 3 and 36 MMT in the global ocean in 2040 under the “Action scenario” – Supplementary Figure S4). Moreover, the “Action scenario” strongly reduces annual emissions of plastic debris to ecosystems (by 75–84% compared to BAU scenario levels, see Section “Combining upstream, middle, and downstream solutions: system change scenario”) but it does not completely stop them. The “tap” of plastic pollution is not completely turned off.
Plastics also have important effects on public health due to endocrine-disrupting chemicals found as additives in plastic products, which are suspected to cause several diseases: IQ loss and intellectual disability, adult diabetes, endometriosis, obesity, cryptorchidism (undescended testicle in the scrotum), male infertility, low birth weight, pneumonia, kidney cancer, hypothyroidism, polycystic ovarian syndrome, breast cancer and low testosterone resulting in increased early mortality. Diseases due to chemicals used in plastic materials is substantial, costing US$ 384–403 billion each year in the United States, US$ 44 billion per year in the European Union (United Kingdom included) and US$ 18 billion per year in Canada. These three estimates are external costs for diseases that occurred in 2010 and are expressed in US$ at the price of the year 2010 (see more information in Supplementary materials in Section S5 compiled by the Endocrine Society based on Trasande et al., Reference Trasande, Zoeller, Hass, Kortenkamp, Grandjean, Myers, DiGangi, Bellanger, Hauser, Legler, Skakkebaek and Heindel2015, Reference Trasande, Zoeller, Hass, Kortenkamp, Grandjean, Myers, DiGangi, Hunt, Rudel, Sathyanarayana, Bellanger, Hauser, Legler, Skakkebaek and Heindel2016, Reference Trasande, Liu and Bao2022, Gore et al., Reference Gore, Chappell, Fenton, Flaws, Nadal, Prins, Toppari and Zoeller2015, Attina et al., Reference Attina, Hauser, Sathyanarayana, Hunt, Bourguignon, Myers, DiGangi, Thomas Zoeller and Trasande2016, Malits et al., Reference Malits, Naidu and Trasande2022, Obsekov et al., Reference Obsekov, Kahn and Trasande2022, Trasande, Reference Trasande2022). Converted into US$ at 2021 pricesFootnote 2 and summed across United States, EU and Canada, gives a total annual cost of US$ 553–577 billion. Assuming this total annual cost is constant and summed year-by-year over 2016–2040 gives a total present value of that cost as US$ 11,206–11,692 billion. This estimation is conservative given the annual cost is likely not constant. Population growth and plastic production growth probably will lead to increases in the annual number of people affected by plastic-related diseases and annual public health costs. In addition, such cost estimations should be carried out for all regions of the world to obtain a global human health cost. Due to the lack of studies, we had to neglect the rest of the world and consider only the United States, the EU (United Kingdom included) and Canada. In the report from UNEP (2023), Landrigan et al. (Reference Landrigan, Raps, Cropper, Bald, Brunner, Canonizado, Charles, Chiles, Donohue, Enck, Fenichel, Fleming, Ferrier-Pages, Fordham, Gozt, Griffin, Hahn, Haryanto, Hixson, Ianelli, James, Kumar, Laborde, KL, Martin, Mu, Mulders, Mustapha, Niu, Pahl, Park, Pedrotti, Pitt, Ruchirawat, Seewoo, Spring, Stegeman, Suk, Symeonides, Takada, Thompson, Vicini, Wang, Whitman, Wirth, Wolff, Yousuf and Dunlop2023, p. 100) provide other estimates of public health costs related to plastic additives. Most of them are based on the same publications as those we use from the Endocrine Society. For this reason, we decided to rely directly and exclusively on Endocrine Society data (in Supplementary materials, Section S5). Merkl and Charles’s (Reference Merkl and Charles2022), Landrigan et al. (Reference Landrigan, Raps, Cropper, Bald, Brunner, Canonizado, Charles, Chiles, Donohue, Enck, Fenichel, Fleming, Ferrier-Pages, Fordham, Gozt, Griffin, Hahn, Haryanto, Hixson, Ianelli, James, Kumar, Laborde, KL, Martin, Mu, Mulders, Mustapha, Niu, Pahl, Park, Pedrotti, Pitt, Ruchirawat, Seewoo, Spring, Stegeman, Suk, Symeonides, Takada, Thompson, Vicini, Wang, Whitman, Wirth, Wolff, Yousuf and Dunlop2023, pp. 99 and 102) and UNEP (2023, p. 6) estimated other health costs related to plastics: the economic costs of deaths of workers attributable to ambient particulate matter air pollution (PM2.5) and to occupational exposure resulting from plastics production. Merkl and Charles (Reference Merkl and Charles2022) also estimated the social cost of carbon emitted during plastic production. These estimations are not taken into account in our paper but could be considered in further research.
The total health cost estimation mentioned in the previous paragraph (US$ 11,206–11,692 billion) is taken into account in the “Inaction scenario” and the “Action scenario” as well (Table 1). We made this choice because in the “Action scenario,” plastic pollutants do not tend to zero before 2040. As explained above, plastic (pollution and production) reduction strategies are implemented progressively on a year-by-year basis. Thus, people are continuously exposed to plastics, although to a diminishing extent, across the period 2016–2040. In addition, diseases due to exposure to plastics are not caused only by pollutants but also by plastics products (especially food packaging and plastic bottles) to which humans are frequently exposed. And yet, in the “Action scenario,” these plastic products, although their production is reduced by almost half, they are not entirely eliminated. A full epidemiologic-economic study would be required to estimate the potential reduction in human exposure in the “Action scenario” and the effect on health cost. Therefore, this has not been taken into account, which explains why the health cost in the “Action scenario” is probably overestimated.
The last cost we include in the calculation of the global cost of inaction comes from Lau et al. (Reference Lau, Shiran, Bailey, Cook, Stuchtey, Koskella, Velis, Godfrey, Boucher, Murphy, Thompson, Jankowska, Castillo Castillo, Pilditch, Dixon, Koerselman, Kosior, Favoino, Gutberlet, Baulch, Atreya, Fischer, He, Petit, Sumaila, Neil, Bernhofen, Lawrence and Palardy2020). As mentioned in Section “Combining upstream, middle, and downstream solutions: system change scenario”, they estimated waste management costs in the case of inaction between US$ 643 and 1,612 billion, which is greater than in the case of action.
Summing these three categories of costs (marine pollution, public health and waste management) gives a total global cost over the 2016–2040 period ranging from US$ 13,711 billion to US$ 281,802 billion, that is US$ 548–11,272 billion per year when divided by the 25 years of the period. This annual range is wider than the one presented in UNEP (2023, pp. 6 and 8), which is estimated to be US$ 294–1,500 billion per year. The first reason is because we directly use the unit cost of damages (cost per tons of plastic debris) caused to ecosystems estimated by Beaumont et al. (Reference Beaumont, Aanesen, Austen, Börger, Clark, Cole, Hooper, Lindeque, Pascoe and Wyles2019) whereas UNEP (2023, pp. 6 and 8) uses the unit cost from WWF (de Wit et al., Reference de Wit, Burns, Guinchard and Ahmed2021). The WWF study estimated the impact of marine plastic debris caused by plastic produced in 2019, whereas we estimate the impacts caused all years across the 2016–2040 period due to plastic debris accumulated in marine ecosystems since 1950. In addition, for the calculation of the total cost, UNEP (2023, pp. 6 and 8) multiplied the unit costs by the amount of plastic pollution estimated by the Pew Charitable Trusts and Systemiq (2020), which is the report version of the scientific article published in Science by Lau et al. (Reference Lau, Shiran, Bailey, Cook, Stuchtey, Koskella, Velis, Godfrey, Boucher, Murphy, Thompson, Jankowska, Castillo Castillo, Pilditch, Dixon, Koerselman, Kosior, Favoino, Gutberlet, Baulch, Atreya, Fischer, He, Petit, Sumaila, Neil, Bernhofen, Lawrence and Palardy2020). In our paper, we base our calculations on a set of eight global plastic models estimating plastic pollution (Figures 1–3): Jambeck et al. (Reference Jambeck, Geyer, Wilcox, Siegler, Perryman, Andrady, Narayan and Law2015), Cordier and Uehara (Reference Cordier and Uehara2019), Lebreton and Andrady (Reference Lebreton and Andrady2019), Lau et al. (Reference Lau, Shiran, Bailey, Cook, Stuchtey, Koskella, Velis, Godfrey, Boucher, Murphy, Thompson, Jankowska, Castillo Castillo, Pilditch, Dixon, Koerselman, Kosior, Favoino, Gutberlet, Baulch, Atreya, Fischer, He, Petit, Sumaila, Neil, Bernhofen, Lawrence and Palardy2020), Borrelle et al. (Reference Borrelle, Ringma, Law, Monnahan, Lebreton, McGivern, Murphy, Jambeck, Leonard, Eriksen, Possingham, De Frond, Gerber, Polidoro, Tahir, Bernard, Mallos, Barnes and Rochman2020), Cordier et al. (Reference Cordier, Uehara, Baztan, Jorgensen and Yan2021), OECD (2022) and Yan et al. (Reference Yan, Cordier and Uehara2022 and Reference Yan, Cordier and Uehara2024).
Global benefits obtained from plastics
In this section, we compare the costs calculated in Sections “Global cost of actions towards zero plastic debris in ecosystems by 2040” and “Global cost of plastic pollution: The cost of inaction” (summarized in Table 1) to the benefits obtained from plastics in the form of income, that is, wages and salaries for workers, dividends for investors, rents for building owners, taxes for government budgets and so forth. In Section “ Upstream solution: Stopping plastic production”, we calculated the global direct and indirect contribution of the plastic industry on global GDP, which we estimated to be US$ 1875 billion in 2021. This represents the annual benefit plastic products bring about as income to individuals involved in economic activities linked to plastics. Summing this annual benefit across the period 2016–2040 gives a total of US$ 37,985 billion in the case of inaction. Subtracting from this estimation the total cost of transition for the private sector, that is, US$ 4,847–5,317 billion (calculated with the world input–output model mentioned in Section “Combining upstream, middle, and downstream solutions: system change scenario”, last paragraph), yields US$ 32,668–33,138 billion, which is the benefit earned in the case of actions toward zero plastic pollution by 2040. This represents a 13–14% loss compared to the “Inaction scenario.” These amounts are summarized in the three first columns of Table 2.
Table 2. Global benefits earned from plastic production in case of “Inaction” and “Action” scenarios (scenarios described in Table 1)

Note: All benefits are in billion US$ at prices of the year 2021 and are total values calculated over 2016–2040 with a discount rate of 3.5%. Negative values are a cost. This table is based on data from Sections “Global cost of actions towards zero plastic debris in ecosystems by 2040”–“Global benefits obtained from plastics”.
Benefits can be converted into net benefits by subtracting the costs (costs calculated in Section “Global cost of plastic pollution: The cost of inaction” and Table 1) from the benefits (first three columns in Table 2). We made this calculation for the “Action” and the “Inaction” scenarios (using the costs calculated in Sections “Combining upstream, middle, and downstream solutions: System change scenario”, “Downstream solution: Terrestrial and aquatic ecosystem cleanup” and “Global cost of plastic pollution: The cost of inaction”, respectively). This yields the two last columns in Table 2 and shows that in the case of action toward zero plastics by 2040 (including 47% reduction of plastic production by 2040), net benefits might be either negative or positive, ranging from US$ −120,433 billion to US$ 19,667 billion. The positive estimate means action toward zero plastic pollution is a gain for the global community altogether (private sectors, public sector, civil society and ecosystems). The negative estimate represents a cost for the global community. In the case of inaction, we face a similar situation: the net benefit might be either positive or negative and is expected to be between US$ −243,817 billion and US$ 24,274 billion. The high estimate, that is the positive net benefit, means that inaction might bring about benefits that offset the global environmental costs generated by plastic pollution in case of inaction. The low estimate indicates negative net benefit, that is to say, the dramatic costs that may be incurred through inaction.
Discussion and conclusion
Comparison of the cost of action and inaction
Table 1 summarizes the costs that will be incurred if the plastic pollution intervention strategies presented in Section “Global cost of actions towards zero plastic debris in ecosystems by 2040” are implemented between 2020 and 2040. It also displays in the penultimate row the cost of global plastic pollution estimated in Section “Global cost of plastic pollution: The cost of inaction” under the BAU scenario. Table 1 and Figure 4 show the global cost of a combination of actions toward zero plastic pollution undertaken in all countries by 2040 to be US$ 18.3–158.4 trillion (which includes reducing plastic production by 47% in 2040, replacing plastic products with alternative materials, improving waste collection and treatment and cleaning up ecosystems). If no actions are undertaken, the cost of damages caused by plastic pollution from 2016 to 2040 is estimated to be US$ 13.7–281.8 trillion. This suggests inaction could generate a global cost either 1.3 times cheaper than the cost of action or up to 1.8 times more expensive.
Plastic product sales will also generate a global benefit in the form of incomes (salaries, dividends, taxes etc.) estimated to be US$ 37.99 trillion from 2016 to 2040 in case of inaction and US$ 32.67–33.14 trillion in the case of action. Calculating benefit minus costs provides net benefits of US$ −120.43 to 19.67 trillion in the case of action and US$ −243.82 to 24.27 trillion in the case of inaction (Table 2 and Figure 5). This suggests action and inaction will be beneficial only considering the high estimate. The low estimates are both negative (US$ −120.43 trillion and US$ −243.82 trillion for action and inaction, respectively), which means action and inaction might generate a net cost for the entire society. In the case of inaction, it is because benefits obtained from plastic products will not be sufficient to offset costs of plastic pollution impacts; in the case of action, it is because reduced ecosystem damage costs will not be sufficient to offset the cost of actions toward zero plastic pollution.

Figure 5. Comparison of global total net benefit of action (left bars) and inaction (right bars) over 2016–2040. Note: The graph is based on data from Table 2. Net benefit = benefit earned from plastics minus costs. The low estimate of net benefits in the “Action” and “Inaction” scenarios are both negative, which means an economic loss (i.e., a cost). For the “Inaction scenario,” this means that the benefits obtained from the plastic industry are not sufficient to offset costs of plastic pollution impacts caused by inaction. For the “Action scenario,” the economic loss (i.e., the negative net benefit) is significantly lower than in the “Inaction scenario.” This is because every year over 2021–2040, actions are implemented to reduce plastic pollution to approach the zero level in the ecosystems by 2040, which gradually reduces costs of plastic pollution impacts. These calculations should be repeated in further studies, when more data on costs and benefits become available (see missing data listed in Table 1), in order to check whether the low estimate of the net benefit of the “Action scenario” becomes positive. The high estimate of net benefits earned in the “Action” and “Inaction” scenarios are both positive, which represents an economic gain. For the “Action scenario,” this suggests that actions toward zero plastics pollution by 2040 is profitable for society because reduced cost of damages resulting from plastic pollution reduction strategies are sufficient to offset costs of actions. The high estimate of the net benefit in the “Inaction scenario” is slightly higher than in the “Action scenario.” This is because in the calculations of the “Inaction scenario,” production is not reduced and, as a result, the benefits obtained from the plastics industry appear to more than offset the costs of the impacts of plastic pollution caused by inaction. However, given the incomplete nature of this analysis (several cost and benefit data are lacking as discussed in Section “Discussion and conclusion”), it is not clear that the high estimate of the net benefit of inaction is substantially higher than the one of action. On the contrary, when more data will be made available, further studies might show it is possible that the net benefit of inaction is substantially lower than the one of action.
However, the global damage cost estimated in our paper (penultimate row of Table 1) is significantly underestimated. We therefore cannot exclude the possibility that future studies will show a negative value for the higher estimate of the net benefit in the case of inaction (meaning that it would be a net cost and not a net benefit).
Three reasons explain the underestimate of the cost of global environmental damages in case of inaction. First, the estimated cost of global damages caused by plastics exclusively covers marine ecosystems and omits terrestrial ecosystems. There is an urgent need to develop studies on the cost of plastic contamination on land. The cost of global damage caused by plastic pollution to terrestrial ecosystems is likely to be significant given the total amount of plastic debris that will accumulate on land over the 1950–2040 period (830–1,664 MMT, Figure 2 upper graph) is higher than in marine ecosystems (38–590 MMT, Figure 3 upper graph).
Second, the cost of plastics on human health is strongly underestimated in our paper since we had to limit the estimation to three countries for which data were available: the United States, the European Union and Canada. Extrapolating to the rest of the world proportionally to population size is not possible, not even for a restricted set of similar countries such as high-income countries. As underlined by Leonardo Trasande (personal communication by email, June 6, 2023), country-level exposures to plastic additives vary widely by policy context, which explains why the number of people suffering diseases and health costs related to plastic additives are significantly different from one country to another, even within high-income countries.
Third, because of lacking data, except for the model results from Lau et al. (Reference Lau, Shiran, Bailey, Cook, Stuchtey, Koskella, Velis, Godfrey, Boucher, Murphy, Thompson, Jankowska, Castillo Castillo, Pilditch, Dixon, Koerselman, Kosior, Favoino, Gutberlet, Baulch, Atreya, Fischer, He, Petit, Sumaila, Neil, Bernhofen, Lawrence and Palardy2020), the models displayed in Figures 2 and 3 (and Supplementary Figures S2 and S3) do not consider emissions of primary microplastics into the environment (e.g., synthetic textile fibers from washing machines). Further studies should quantify primary microplastic emission to the ecosystem since they are likely to be significant. For example, primary microplastic leakages from tire wear may contribute 5–10% of global ocean plastics loading (Kole et al., Reference Kole, Lohr, van Belleghem and Ragas2017; Hale et al., Reference Hale, Seeley, La Guardia, Mai and Zeng2020). And even if we could count them, technologies to clean up micro- and nanoplastics in ecosystems are lacking anyway. This explains why we could not estimate the cost of cleaning up these small pieces of plastic debris to remove them from contaminated ecosystems.
The global cost of private sector action estimated in Table 1 also suffers from inaccuracies under the “Action scenario.” First, we estimated with an input–output model the transition cost for the private sector adapting to a low plastic society (Section “Combining upstream, middle, and downstream solutions: system change scenario”, and row 9 in Table 1). The issue is that the input–output model we used is static and assume fixed prices and technology. This does not allow for flexibility in the input–output table, which cannot reflect the way the global economic structure will change due to future technological developments of substitutes and substitute approaches to meeting the decreasing demand for plastics over the coming decades under the « Action scenario ». This likely means the transition costs are over-estimated. We must, thereby, acknowledge the limitations of using static input–output models for benefit–cost analyses over multi-decadal timelines (beyond a 10-year period, the technological changes are likely to be significant, which is hardly captured by static input–output models). Further research could solve this drawback by dynamizing input–output technological coefficients (e.g., Uehara et al., Reference Uehara, Cordier and Hamaide2018) or, as recommended by the U.S. Environmental Protection Agency (US EPA, 2014 and 2020, pp. 8–9 to 8–21 and 8–16 to 8–26, respectively), by using a computable general equilibrium model. Second, we estimated the economic impacts of ocean, river and terrestrial cleanups (on the cost side) based on operational cost of removing plastic debris from the ecosystems (Section “ Downstream solution: Terrestrial and aquatic ecosystem cleanup”, and rows 3–6 in Table 1). However, these are the direct costs. Indirect costs have not be taken into consideration, since cleanup costs were not passed through the input–output model to reflect the impact on suppliers, intermediate and final consumers, wages and salaries and so forth. Thereby, cleanup costs are likely understated. These two inaccuracies (on transition and cleanup costs) affect the estimates of benefits in Table 2, which consist in calculating differences from the input–output model.
Cost distribution across countries from the Global South and Global North
The global costs displayed in Table 1 and Figure 4 will not be evenly distributed between Global South and Global North countries. First, as global plastics production continues increasing, this growth is unequally distributed. From 2009 to 2019, annual global plastics production grew from 321 MMT to 460 MMT (OECD, 2022, p. 68). During the same period in Europe, production was comparably stable, increasing from 55 MT in 2009 to 58 MMT in 2019 (PlasticsEurope, 2011, 2020) in response to increasing social and environmental regulation.
Second, plastic waste management also reflects planetary asymmetry in how the benefits and harms of plastics are distributed. For example, prior to 2018, China imported over half of the world’s plastic waste. In 2018, when China began implementing their near total ban on plastic waste imports, the resulting reshuffling of the global plastic waste market resulted in other countries, including some of the world’s poorest, such as Malaysia, Thailand and Indonesia, importing much larger quantities of global plastic waste (Vidal, Reference Vidal2020), and the associated consequences for ecosystems and human health in these countries (Marrs et al., Reference Marrs, Ručevska and Villarrubia-Gómez2019; Trasande, Reference Trasande2022). An estimated 58% of all plastic produced between 1950 and 2017 has been discarded and continues impacting the environment (Geyer, Reference Geyer2020). As plastic production continues increasing, so too do the negative impacts of plastic-derived pollution throughout plastics’ material life cycle. While some countries are introducing plastic-related regulation, so long as plastic production continues increasing, the harmful socioecological consequences of plastics will be displaced to less-regulated countries, such as Turkey or Romania in the case of Europe, and Malaysia, Thailand and Indonesia in Asia, not to mention the globally shared consequences for the Earth’s oceans and climate.
Third, the economic impact of the cost of future mitigation policies will probably be uneven across countries as a recent study by the OECD (2022) shows. The study considers a wide range of policies intended to restrain plastic production and consumption as well as to enhance design for circularity (e.g., plastic tax, eco-design for durability and repair), improve recycling (e.g., recycled content targets) and close leakage pathways (e.g., better plastic waste collection). The degree of effort varies by country’s income level. The “global ambition policy scenario” simulated by the OECD (2022) intends to reduce plastic leakage to the environment to nearly zero by 2060. The costs resulting from this scenario incurred by Global South countries (red bars in Figure 6) will be among the highest (except in China). For example, in Sub-Saharan African countries, GDP is projected to decline by 2.8% below the baseline. The Global North (blue bars in Figure 6) will be much less affected. For example, in OECD EU countries (i.e., high-income countries), GDP is projected to decline by only 0.2% below the baseline, mostly because the economic infrastructure in OECD countries, waste collection and treatment infrastructures included, is fundamentally more extensive than in non-OECD countries). Non-OECD EU countries (labeled “other EU” in Figure 6) are, however, an exception in the Global North since their GDP is projected to decline by 2.1% below the baseline. One of the reasons for sharp GDP declines in Global South and non-OECD EU countries is due to substantial investments still missing that are required to improve waste collection and treatment facilities to achieve the policy targets set in the scenario.

Figure 6. Cost of plastic pollution reduction policies as simulated in the global ambitious policy scenario by the OECD (2022, p. 198). Note: Costs are expressed as a percentage of Gross Domestic Product (GDP). World regions that are part of the Global South are in red and Global North regions are in blue. The black bar shows the world average cost (average calculated across all countries).
What to do now?
Knowing that any plastic production implies pollution in different forms across different scales, and that the producers’ intentions are to increase their own benefits, as demonstrated by the past 50 years of production:
-
– Why would producers agree to reduce their otherwise growing benefits? How will such public policy get implemented against private sector interests? As things stand currently, it is not easy to do so.
-
– The macroeconomic models and global estimates create abstractions far from local, regional and national realities, proposing dialog/s between developed and developing countries as solution/s, when today the questions can be focused more on: “Where do the benefits go?” “Where are the impacts?” and “Who has the capacity to regulate the asymmetry?”
In some regions, producers and recyclers are the same corporate entity, giving them an interest in maintaining growth from both sides (production and recycling). We do not see how they can then be part of the solution on their own. Corporations have committed documented abuses for decades, everything from greenwashing to murder, and continue doing so today. This is well documented for longer-running environmental concerns such as climate change, mining or asbestos (Ladou, Reference LaDou2004; Forbidden stories, 2019; Middeldorp and Le Billon, Reference Middeldorp and Le Billon2019; Le Billon and Lujala, Reference Le Billon and Lujala2020; Bonneuil et al., Reference Bonneuil, Choquet and Franta2021; Supran et al., Reference Supran, Rahmstorf and Oreskes2023). Similar publications on the role of plastic-related corporations (e.g., soft drink industries) are still in their infancy (Dauvergne, Reference Dauvergne2018; Wood et al., Reference Wood, Baker, Scrinis, McCoy, Williams and Sacks2021). However, it is progressing since the scandal of the leaked internal document from Coca-Cola (Coca-Cola Europe, 2016) revealing the company prioritized a “fight back” strategy against EU policies that planned to implement extended producer responsibility schemes, to increase plastic collection and recycling, and to develop deposit return schemes. We must avoid denial about this, keeping in mind a sentence from the trials against the tobacco industry in the 1990s when the U.S. District Judge H. Lee Sarokin said in 1992: “Who are these persons who knowingly and secretly decide to put the buying public at risk solely for the purpose of making profits, and who believe that illness and death of consumers is an appropriate cost of their own prosperity!” (Brownell and Warner, Reference Brownell and Warner2009).
It comes down to this: allowing plastic production, consumption or recycling to continue growing means allowing plastic pollution and its associated costs to continue increasing (Trasande, Reference Trasande2022). While there are gaps in the data, the estimates provided here illustrate the high economic costs of inaction regarding plastic pollution, along with the need to ensure the costs of addressing plastic pollution are not inequitably born by those least responsible, who have benefited least.
Supplementary material
The supplementary material for this article can be found at https://doi.org/10.1017/plc.2024.3.
Open peer review
To view the open peer review materials for this article, please visit http://doi.org/10.1017/plc.2024.3.
Acknowledgment
The authors are grateful to the anonymous reviewers who helped to considerably improve this paper.
Author contribution
Conceptualization, data collection, formal analysis, methodology, supervision, validation, visualization, writing – original draft, writing – review and editing: M.C.; Funding acquisition, project administration, validation, writing – original draft, writing – review and editing: T.U.; Validation, writing – original draft, writing – review and editing: B.J.; Context, writing and review: J.B.
Financial support
This research received support from the JSPS KAKENHI (Japan Society for the Promotion of Science), grant number 19KK0271.
Competing interest
The authors declare none.


 Open access
Comments
Dear Professor Fletcher (Editor-in-Chief),
Dear Editors,
I submit an overview review article for publication in Cambridge Prisms: Plastics, titled “Reduction in plastic production: Economic loss or environmental gain?”.
With my co-authors, we have been reviewing the literature on costs of plastic pollution reduction interventions and costs of global damages caused by plastics. However several costs of plastic pollution reduction interventions were missing and we had to make additional computations, based on existing data. For example, we developed a global macroeconomic model to simulate the economic impact of reducing global plastic production by 47% as suggested by Lau et al. (2020) in their article published in Science in which they evaluate scenarios toward zero plastic pollution. This allowed us to estimate the ecological transition cost for the private sector. This is why we submit and overview review article, which allows manuscripts of 5000-10000 words. This amount of words is needed to describe the additional computations we did. We also had to calculate the amount of accumulated plastic debris since 1950 in the ecosystems since only annual emissions have been provided in most publications we reviewed. And yet, calculating costs of ecosystem clean up requires accumulated amounts.
Our overview review suggests that reducing plastic production by 47%, replacing plastic products with alternative materials, improving waste collection and treatment, and cleaning up the ecosystems, will certainly produce an environmental gain, but could also result in an economic gain, not an economic loss. Implementing all these interventions globally would cost between US$ 12.1 and US$ 21.9 trillion over 2016-2040, meaning that the cost of action is roughly between the GDP of the EU and the US in 2020. This may seem like a lot. However, if we do nothing to address plastic pollution, the cost of global environmental damages could be up to 11 times the cost of action.
We are looking forward to hearing from you and receiving your comments.
Sincerely,
Mateo Cordier