


INTRODUCTION
The East Mediterranean–Levant region, fringing the semiarid subtropical Sahara–Arabian desert belt, is predicted by climate modelers to become a hot spot of severe droughts and intense flooding events with devastating effects on human societies (Held and Soden, Reference Held and Soden2006; Kelley et al., Reference Kelley, Ting, Seager and Kushnir2012, Reference Kelley, Mohtadi, Cane, Seager and Kushnir2015; IPCC, 2014; Donat et al., Reference Donat, Angélil and Ukkola2019). The reliability of these climate predictions depends on the knowledge of natural climatic patterns that are in turn reconstructed from the geological records of relevant periods. Extensive efforts have been made by the paleohydroclimate community using archives such as the Dead Sea lacustrine records (e.g., Enzel et al., Reference Enzel, Bookman (Ken Tor), Sharon, Gvirtzman, Dayan, Ziv and Stein2003; Migowski et al., Reference Migowski, Stein, Prasad, Negendank and Agnon2006; Kushnir and Stein, Reference Kushnir and Stein2010, 2019), speleothems (Bar-Matthews et al., Reference Bar-Matthews, Ayalon, Gilmour, Matthews and Hawkesworth2003), and deep-sea cores (Schilman et al., Reference Schilman, Bar-Matthews, Almogi-Labin and Luz2001, Reference Schilman, Ayalon, Bar-Matthews, Kagan and Almogi-Labin2002; Bookman et al., Reference Bookman, Mor-Federman, Herut, Harlavan, Taha, Stein and Almogi-Labin2021) to reconstruct Late Holocene hydroclimate of the East Mediterranean–Levant region, which spans the subtropical Mediterranean and the desert climatic zones (Fig. 1).

Figure 1. (a) The catchment of the modern Dead Sea, Sea of Galilee (Lake Kinneret), Lake Hula, and the last glacial Lake Lisan that during its highest stand (~28–24 ka BP) extended from the northern shores of the Sea of Galilee to south of the modern Dead Sea (Stein, Reference Stein, Zohary, Sukemik, Berman and Nishri2014). (b) The Sea of Galilee and Upper Galilee with soil sample sites in the catchments of Nahal Amud and Nahal Tzalmon and location of Core LK12-22. Boundaries of Nahal Amud and Nahal Tzalmon catchments are outlined. Two open squares next to the core site indicate the locations of the surface sediments LK159 and LK161. The black rectangle indicates the location of surface sediment LK1 near the mouth of Jordan River. The locations of other core sites discussed in the text are indicated by red filled triangles with their names near the symbols. The Jordan River and other streams that flow to the lake are shown. Also marked are Station A at the deepest part of the lake, where drilling (Schiebel and Litt, Reference Schiebel and Litt2018; Miebach et al., Reference Miebach, Chen, Schwab, Stein and Litt2017) recovered the entire Holocene; the older section, Ohalo shore (Ohalo II), where drilling (KIN2) recovered the last glacial sedimentary section; and the drilling locations of SOG2 and SOG3 (Hazan et al., Reference Hazan, Stein, Agnon, Marco, Nadel, Negendank, Schwab and Neev2005; Lev et al., 2014, Reference Lev, Stein, Ito, Ben-Avraham and Almogi-Labin2019). The distribution of three basic soil types (Terra rossa and Rendzina, basaltic Grumosols and Protogrumosols, and colluvial–alluvial soils around the Sea of Galilee are also indicated (Dan et al., Reference Dan, Yaalon, Koyumdjiski and Raz1976; Dan and Koyumdjiski, Reference Dan and Koyumdjiski1979; IUSS Working Group WRB, 2015).
The Sea of Galilee (Lake Kinneret) is primarily fed by the Jordan River, which originates in Mount Hermon. The lake also receives water and sediments from streams originating in the Golan Heights and Upper and East Galilee Mountains. As such, the sediments that are deposited in the lake mainly reflect the hydroclimatic conditions in the Mediterranean climate zone, areas that are predominantly affected by Mediterranean rainstorms (e.g., Dayan and Morin, Reference Dayan, Morin, Enzel, Agnon and Stein2006). Paleoenvironmental studies that relate to the Sea of Galilee focused on topics such as the precipitation of endogenic calcite associated with algal blooms and geochemical studies of Melanopsis shells (e.g., Katz and Nishri, Reference Katz and Nishri2013; Zaarur et al., Reference Zaarur, Affek and Stein2016; Fruchter et al., Reference Fruchter, Lazar, Nishri, Almogi-Labin, Eisenhauer, Beeri-Shlevin and Stein2017; Lev et al., Reference Lev, Stein, Ito, Ben-Avraham and Almogi-Labin2019); nutrient cycling and mobilization; accumulation of eolian deposits (e.g., Singer et al., Reference Singer, Gal and Banin1972; Serruya, Reference Serruya and Serruya1978; Ganor et al., Reference Ganor, Deutsch and Foner2000; Koren and Klein, Reference Koren and Klein2000; Gross et al., Reference Gross, Nishri and Angert2013); pollen studies (e.g., Langgut et al., Reference Langgut, Finkelstein and Litt2013; Miebach et al., Reference Miebach, Chen, Schwab, Stein and Litt2017); and lake-level reconstruction (Hazan et al., Reference Hazan, Stein and Marco2004, 2005; Lev et al., Reference Lev, Stein, Ito, Ben-Avraham and Almogi-Labin2019).
Here, we explore the mobilization of fine-grained sediments that comprise surface cover material of the Ginosar valley catchment (Fig. 1) to the lake and discuss the hydroclimatic conditions that controlled the erosion of these surface cover materials during the Late Holocene. For this, we determined the sedimentological and geochemical properties of allogenic sediments that were deposited in the lake, including sediments of Core LK12-22 that was collected offshore of the Ginosar valley (Fig. 1), recovering a sedimentary record of the past ~4 ka. We use the Nd and Sr isotopes of the non-carbonate fraction of the cored sediments to reconstruct the sources and history of surface cover soil formation, erosion, and mobilization in the catchment area of the Ginosar valley (the depositional area of the Nahal Tzalmon and Nahal Amud (nahal = stream; Fig. 1). The Nd and Sr isotope ratios allow us to discern the sources of the fine-grained detrital particles and to detect the temporal variations in the origins of the non-carbonate material that accumulated on the lake floor. Then, we expand our sediment-source tracing for fine-grained detrital particles that accumulated in the different sectors of the lake floor and discuss the origin and conditions of surface cover formation, erosion, and mobilization in the various catchment areas around the lake.
The Sea of Galilee region has a long history of human activity. Many outstanding prehistoric sites such as the early Pleistocene Ubeidiya site (Tchernov, Reference Tchernov1987) and the late Pleistocene (~22 cal ka BP) Ohalo II site (Nadel, Reference Nadel1990) exist along the lake's ancient shores and nearby areas. The lakeshore areas were occupied by flourishing cities and smaller settlements, including farming-fishing villages of the Roman period where early Christianity was becoming established. These historical developments occurred within the background of regional and local environmental conditions such as aridity changes and seismic activity. Thus, understanding the hydroclimate of the region during these Late Holocene cultural and historical changes provides useful information as we contemplate the future.
GEOLOGICAL SETTING AND BACKGROUND INFORMATION
The Sea of Galilee, the only freshwater reservoir in Israel, fills one of the morphotectonic depressions along the Dead Sea Transform (Ben-Avraham et al., Reference Ben-Avraham, Rosenthal, Tibor, Navon, Wust-Bloch, Hofstetter, Rybakov, Zohary, Sukemik, Berman and Nishri2014; Stein, Reference Stein, Zohary, Sukemik, Berman and Nishri2014). The lake lies at the northern extension of the tectonic Kinnarot basin (Fig. 1a), which has a gentle basin morphology without deep-cutting valleys or depressions. The sediments filling the lake are flat-lying, and seismic profiles show deepening toward the north-central location (near Station A; Fig. 1b; Ben-Gai, Reference Ben-Gai2009). Most of the streams that feed the lake run through the marginal flat valleys, such as the Beit Tsaida valley at its north-northeastern side or the Ginosar valley at its northwestern side, depositing most of their sediment loads within these marginal valleys. Suspended materials arrive with low energy into the lake. The Jordan River, the main inflow to the Sea of Galilee, meanders through the Beit Tsaida valley before gently discharging into the lake.
In addition to the Jordan River, a few other nahals drain the central Golan Heights, and saline springs discharge into the lake mainly along the western edge of the lake (Kolodny et al., Reference Kolodny, Katz, Starinsky and Moise1999; Flexer et al., Reference Flexer, Yellin-Dror, Kronfeld, Rosenthal, Ben-Avraham, Artsztein and Davidson2000; Fruchter et al., Reference Fruchter, Lazar, Nishri, Almogi-Labin, Eisenhauer, Beeri-Shlevin and Stein2017; Lev et al., Reference Lev, Stein, Ito, Ben-Avraham and Almogi-Labin2019). Streams that originate in Upper and East Galilee (Fig. 1b), such as Nahal Amud and Nahal Tzalmon, are dry or nearly dry by the time they reach Ginosar valley (Israel Hydrological Survey database, Israel Water Authority, Jerusalem) because their water has been appropriated for irrigation. The Hula basin marshes, north of the Sea of Galilee, used to trap most of the sediment being carried by Jordan River and its tributaries before being drained in the 1950s for agricultural purposes (Gophen et al., Reference Gophen, Tsipris, Meron and Bar-Ilan2003), so the Jordan River was not a major source of detrital sediments delivered to the Sea of Galilee (Lev et al., Reference Lev, Stein, Ito, Ben-Avraham and Almogi-Labin2019). In the 1960s, some of the saline spring waters were diverted to reduce the salinity of lake water.
The Ginosar valley, the focus of this study, consists of alluvial fans of two streams: Nahal Amud and Nahal Tzalmon (Fig. 1b). The alluvial fans merge at the Sea of Galilee and comprise a broad and morphologically flat depositional plain ~5 km wide where the fan intersects the lake and ~2 km long from the coast to the apex of the fan. Today, the extension of the Ginosar valley lies under ~10 m of lake water when the lake level stands at 209 m below mean sea level (m bmsl). In 1999, when the lake was at a low stand of 214 m bmsl, the lake receded from the Ginosar valley, and a significant part of the currently submerged plain was exposed, displaying its gently sloping and smooth morphology. The same gently sloping morphology was observed in other nearshore parts of the lake that were exposed during the 1999 low stand. This indicates that Ginosar valley streams do not carry high-energy discharges that can carve out canyons or gullies underwater, having lost most of their energies when they emerge at the top of alluvial fans.
The central region of the Upper Galilee Mountains consists mainly of Mesozoic and Cenozoic marine limestone and dolostone that are covered by soils and in places by Late Cenozoic basalt flows. Of the two streams that flow through the Ginosar valley, the Nahal Tzalmon catchment area currently receives annual precipitation of 400–600 mm, and Nahal Amud drains the higher-elevation areas of the Upper Galilee Mountains (e.g., Mt. Meron, 1208 m above sea level) and their eastern slopes with annual precipitation of 400–900 mm. The surface cover of the Galilee Mountains is composed mainly of Terra rossa (mainly Rhodic, Chromic, and Leptic Cambisols according to IUSS Working Group WRB [2015]; Supplementary Table 1), Pale Rendzina (mainly Calcaric and Leptic Cambisols), and Brown Rendzina (mainly Leptic Cambisols) soils. In this paper, we refer to Terra rossa and Rendzina soils as “mountain soils.” Some Grumosols (mainly Pellic, Haplic, and Leptic Vertisols) and Protogrumosols (mainly Protogrumic Regosols) develop on basalts, and we refer to them as “basaltic soils.” A simplified soils map, based on the Soil Association Map of Israel (Dan et al., Reference Dan, Yaalon, Koyumdjiski and Raz1976; Dan and Koyumdjiski, Reference Dan and Koyumdjiski1979) is shown in Figure 1b. Because the Beit Tsaida valley at the northeastern side of the lake (Fig. 1) and the Lower Jordan valley at the southern and southwestern sides of the lake were covered during the last glacial period by paleo-Lake Lisan, which deposited fine-grained sediments (Hazan et al., Reference Hazan, Stein, Agnon, Marco, Nadel, Negendank, Schwab and Neev2005), these areas represent another source of fine detritus to the lake today.
MATERIALS AND METHODS
Core acquisition
Core LK12-22 (32.83861°N, 35.53373°E), measuring 143 cm long, was collected with a UWITEC hammer corer fitted with a PVC liner tube at a water depth of 12 m in January 2012 at the extension of the alluvial fan of the Ginosar valley. The lake level was at 213.3 m bmsl, thus the top of the core was at ~225 m bmsl. Immediately after core acquisition, to prevent the sediment from being disturbed during transport, the empty space at the top and bottom of the liner tube was filled with blocks of floral foam. The core was shipped to the Free University of Berlin for a detailed ostracod study (Kalanke, Reference Kalanke2015). Before being transported to Berlin, the core was cut into two segments at 65 cm, which created a 1-cm loss of the core material just above and below this depth so that the upper segment is from 0 to 64 cm, and the lower half is from 66 to 143 cm. The detached sediment from 64 to 65 cm and another from 65 to 66 cm were retained. The core sections were split at the Free University. One half of the core remained in Berlin and the other half was later shipped to the Continental Scientific Drilling Facility (CSD Facility) at the University of Minnesota for core processing, initial core description, and archiving.
Surface-sediment samples
Surface-sediment samples were collected using an Ekman dredge and stored in Whirl-Pak bags. Two samples, LK159 and LK161, were collected offshore of the Ginosar valley. LK1 was collected from the mouth of the Jordan River and nine other samples were collected from different locations across the lake bottom (Table 1; Supplementary Fig. 1).
Table 1. Surface-sediment samples from the Sea of Galilee.

Soil samples
Surface-soil samples were collected from the catchment area of the Ginosar valley at several sites along or near the Nahal Tzalmon and Nahal Amud (Fig. 1b; Table 2). Approximately 100 g of surface soil was collected using a trowel and stored in a plastic bag under ambient temperature.
Table 2. Soil samples from the Amud and Tzalmon catchments.

Core processing
At the CSD Facility, split cores were analyzed for point magnetic susceptibility (MS) measured every 5 mm along the center of the split core surface with the Geotek MSCL-XYZ scanner and imaged with the Geotek Geoscan-III. The Geoscan-III uses a line-scan CCD camera with polarizing filters to prevent any glare from the wet sediment. Images were scanned at 20 pixels/mm. The split core surface was already oxidized when it arrived at the CSD Facility, and the color description is that of oxidized sediment. During visual lithologic description, some smear slides were made and examined under a 100× petrographic microscope using plane- and cross-polarized lights. Smear slides were made from visually distinct portions of the cores to examine minerals, aquatic organism and terrestrial plant remains, and any other material contained in the sediment.
XRF and X-radiography
A COX Analytical Systems ITRAX XRF (X-ray fluorescence) Core Scanner with a Mo source at the Large Lakes Observatory, University of Minnesota, Duluth, was used to obtain elemental composition and X-radiographic images on split cores. For XRF, a 1-cm-wide central swath of the split core section was scanned, and measurements were taken every 1 cm. In addition, the core interval between 127 and 141 cm depths was scanned at 1 mm resolution. The elements focused on for this study are K, Ca, Ti, and Fe. Calcium was chosen as the most likely indicator of carbonate, which may be endogenic or detrital. Potassium, Ti, and Fe were chosen as likely proxy evidence of detrital inputs from the Galilee Mountains, whether in situ–produced mountain soils or settled desert dusts. The X-radiographic images were taken at 200 μm resolution (5 pixels/mm) after the XRF scan on the same 1-cm-wide swath.
X-ray diffraction (XRD) analysis
Ten sediment samples were chosen from portions of Core LK12-22 representing a different lithology and analyzed with a Rigaku Miniflex X-ray diffractometer at the University of Minnesota. The sediment was ground to a fine powder (<63 μm) with distilled deionized water in an agate mortar and pestle, and after a corundum spike was added, the slurry was pipetted onto a slide before analysis. Scanning conditions were 20°–56° 2θ range and a step size of 0.02°. The Jade program was used to identify the minerals and their qualitative abundance. The soil samples were analyzed at the Geological Survey of Israel (GSI) using a Panalytical X'Pert3 Powder diffractometer equipped with a PIXcel detector. Scanning conditions were: 3°–70° 2θ range, step size 0.013°, and equivalent time per step of 30.6 s, ending up with total time of ~11 min.
Radiocarbon analysis
The chronology of the core was established by radiocarbon analysis of charcoal picked from nine depths throughout the core. We screened 85 samples of ~20 g each but did not find any terrestrial plant material in the core. However, previous chronological studies at the shores of the Sea of Galilee demonstrated that the charcoal ages are reliable and consistent with radiocarbon ages that were measured on twigs or seeds from the same stratigraphic horizon (e.g., at the Ohalo II trench; Hazan et al., Reference Hazan, Stein, Agnon, Marco, Nadel, Negendank, Schwab and Neev2005).
We extracted ~1 cm3 of sediment from a thickness of 0.5 cm and washed this aliquot through a 125 μm sieve using doubly deionized (DDI) water. The material remaining in the sieve was suspended in DDI water in a picking tray. The wet charcoal was picked using a binocular microscope and tweezers and stored in a 2 dram (7.4 mL) glass vial, which had previously been burned for 4 hours at 550°C to ensure that the vial was free of any modern organic carbon. The vial was partially filled with DDI water and several drops of 10% HCl to prevent the growth of mold and preserve the integrity of the charcoal. If the amount of charcoal from the initial picking was insufficient, an additional ~1 cm3 of sediment from the original sample depth was processed. If there was not enough sediment left from the original depth, additional samples were taken from above and below the original interval. The overall sampled interval never exceeded 2 cm in thickness in order to maintain the precision of the age determination.
The charcoal samples (Table 3) were sent to the Lawrence Livermore National Laboratory's Center for Accelerator Mass Spectrometry. The results were calibrated using OxCal 4.4 (Bronk Ramsey, Reference Ramsey2009), which uses INTCAL20 (Reimer et al., Reference Reimer, Austin, Bard, Bayliss, Blackwell, Bronk Ramsey, Butzin, Cheng, Edwards and Friedrich2020). An age–depth model was constructed based on Bayesian statistics with the rbacon package 2.5.7 (https://cran.r-project.org/web/packages/rbacon/index.html, accessed January 20, 2022; Blaauw and Christen, Reference Blaauw and Christen2011; Blaauw et al., Reference Blaauw, Christen, Aquino Lopez, Esquivel Vazquez, Gonzalez, Belding, Theiler, Gough and Karney2021) The age at the top of the core was constrained as −62 cal yr BP (2012 CE), the year the core was collected. The calibrated age probability distributions are also calculated by rbacon. We report the calibrated ages as cal yr BP or cal ka BP.
Table 3. 14C ages, OxCal 4.4 ages, and modeled ages (rbacon 2.5.7) of LK12-22 samples.

Grain-size analyses
Core LK12-22 was subsampled in 2- to 2.5-cm-thick segments (~5 cm3) for grain-size analysis. Different colored bands, segments that appeared coarse with shell fragments, and sediments that appeared fine-grained were sampled to obtain some idea of grain-size range. Fifteen samples were processed and analyzed at the University of Minnesota using a Horiba Grain-Size Analyzer LA-920. The sample processing procedure consisted of removal of shell fragments and any grains larger than 2 mm in diameter, removal of organic matter with 30% H2O2, dissolution of biogenic silica with 1 M NaOH, and the dissolution of carbonate minerals with 0.5 N HCl. The treated samples were centrifuged at 3500 rpm for 5 min and rinsed with deionized water. The centrifuge and rinse procedures were repeated three times. Each sample was introduced into an analysis chamber with a sodium hexametaphosphate solution (5 g Na-HMP to 1 L DDI water). The Horiba autosampler holds 12 samples, and 4 samples were selected at random for a duplicate analysis to check for consistency throughout each run. Alumina powder of known grain-size distribution was used at the start and end of each day to check the calibration of the instrument.
Sr and Nd isotope analyses
Sr and Nd isotope ratios of fine sediment (<63 μm) of the core, surface sediment from the lake, and soil samples were analyzed. Samples from the core were taken approximately every 10 cm, except where lithologic changes dictated taking additional samples (Table 4). The isotope analyses were performed on two dissolution fractions: a carbonate fraction that was leached by weak acetic acid and a non-carbonate fraction dissolved in HF + HNO3. The extraction procedure and the mass spectrometric measurement follow the methods described by Palchan et al. (Reference Palchan, Stein, Almogi-Labin, Erel and Goldstein2013). Analyses were performed at the GSI using a Nu Instruments MC-ICP-MS and at the Hebrew University of Jerusalem using a Neptune MC-ICP-MS. Sr and Nd isotopic ratios were corrected using NIST SRM 987 standard for Sr (87|Sr/86Sr = 0.71025; Ehrlich et al., Reference Ehrlich, Gavrieli, Dor and Halicz2001) and JNdi standard for Nd (143|Nd/144Nd = 0.512115; Tanaka et al., Reference Tanaka, Togashi, Kamioka, Amakawa, Kagami, Hamamoto, Yuhara, Orihashi, Yoneda and Shimizu2000). Repeated measurements of the standards yielded 87Sr/86Sr (NIST SRM 987) = 0.71029 ± 0.0005 (2σ; n = 37) and 143Nd/144Nd (JNdi) = 0.51209 ± 0.00001 (2σ; n = 27). 143Nd/144Nd ratios are reported as ɛNd values, where CHondritic Uniform Reservoir (CHUR; 143Nd/144Nd) = 0.512638.
Table 4. 87Sr/86Sr and ɛNd results for Core LK12-22 sediment, lake surface-sediment, and soil.

aSample lost.
Microfossils
Bulk samples from every other centimeter-thick slice of the core were washed through a 63 μm sieve for microfaunal identification. The ostracods in these samples were identified, their abundance was recorded, and the presence of detrital foraminifera was also recorded.
RESULTS
Radiocarbon ages
Uncalibrated radiocarbon ages of the samples range from 3605 ± 80 (2σ) to 200 ± 60 14C yr BP (Table 3). No charcoal was recovered between 100 and 57 cm. Samples LK1 (18.5–19.0 cm) and LK5 (51.0–52.5 cm) yielded age reversals (Table 3). Calibrated (and modeled) ages range from 4141 ± 17 to 168 ± 155 (3788 to 186) cal yr BP (Table 3). The age–depth model is shown in Figure 2.

Figure 2. Age–depth chronological models for Core LK12-22 based on radiocarbon ages. The age–depth models were constructed using rbacon, the Bayesian P-sequence sedimentary deposition model (Blaauw and Christen, Reference Blaauw and Christen2011; Blaauw et al., Reference Blaauw, Christen, Aquino Lopez, Esquivel Vazquez, Gonzalez, Belding, Theiler, Gough and Karney2021). The red dashed line shows median modeled ages. Gray dashed lines indicate 2σ ranges on either side of median ages. Probable calibrated age distribution is shown for each radiocarbon sample.
Grain size of the core sediments
The grain-size range of non-carbonate sediments of the core is from clay to fine sand, with two samples (97 and 82 cm) containing medium sand (Fig. 3). All samples are strongly to weakly bimodal, with the fine fraction centered around 0.5 to 0.8 μm. Two samples (97 and 82 cm) show only a weak secondary peak in the fine fraction. Twelve of the 15 samples have coarse fraction maxima in the range of 15 to 50 μm. One sample from Unit C (97 cm) has a coarse fraction maximum at 60 μm. One Unit D sample (82 cm) with a coarse fraction peak at 80 μm is from the bottom of the unit and contains many shell fragments. A sample from the top of the Unit D (70 cm depth) is dark red and appears very fine-grained. The maximum grain-size range of this sample was 6 to 8 μm. One other sample with a coarse fraction of only ~5 μm is from Unit F (36 cm), with similar visual characteristics. Three samples (Unit A: 123 cm; Unit C: 84 cm; and Unit F: 12 cm) also have finer coarse fractions (peak 15 to 17 μm) and are also dark red in color. Lighter-colored sediments have a significantly higher proportion of coarser grains, with peak abundance around 50 μm.

Figure 3. Silicate and oxide grain-size distribution of selected samples from Core LK12-22. The legend shows the midpoint depth of each 2- or 2.5-cm-thick sediment sample (rounded to one-tenth place). Legend at the top of the graph shows the color code and the depth of each sample. Each lithologic unit is distinguished by different color codes: Unit A, dotted black line; Unit B, not sampled; Unit C, solid dark-gray line; Unit D, solid green line; Unit E, solid yellow ochre line; and Unit F, solid light-gray line. All samples are distinctly to weakly bimodal with the fine fraction centered around 0.5 to 0.8 μm. The peak of coarse fraction varies widely from ~5 to ~80 μm, but most samples show a peak in the range of 15 to 50 μm.
Stratigraphy and lithology of the LK12-22 core
Core LK12-22 was divided into six stratigraphic units based on the degree of lamination, qualitative and quantitative grain size, the XRF data, and mineralogy (Figs. 3–4; Supplementary Fig. 2; Supplementary Tables 2–5). Quartz and calcite are present throughout the core. Common minor minerals are dolomite and clay minerals, and feldspar was identified in some intervals. Most of the silicate minerals have grain sizes of fine silt to fine sand. Smear slides indicate an abundance of fine-grained (<5 μm) endogenic calcite. We identified two major sedimentary facies units: laminated marl and massive marl (Lev et al., Reference Lev, Stein, Ito, Ben-Avraham and Almogi-Labin2019). Most of the core shows no lamination, and only the bottom 21 cm of the core consists of alternating laminae of calcite and fine detritus.
Unit A (143–122 cm) is characterized by subcentimeter laminations gradually decreasing in color contrast up-core. Alternating randomly between dark brown, reddish-taupe, brownish-red, and cream-colored sediment, the lamination thickness ranges from millimeter to centimeter scale with no apparent grain-size gradation throughout the entire section. Between 138 and 137 cm, there is an abundance of broken mollusk fragments. MS increases up-core, while Ca decreases. High-resolution XRF intensity variations generally correspond with visual laminations in this unit (Fig. 4). Ostracod shells are nearly absent in this unit. In general, the darker sediment coincides with higher Ti and Fe, and lighter-colored sediment occurs with higher Ca intensities. This may indicate alternations between carbonate-poor and carbonate-rich laminae. XRD analysis of sediment from 130 to 128 cm shows that the major minerals are quartz, clay minerals, and calcite with minor dolomite.
Unit B (122–100.5 cm) is massive reddish taupe–colored marl with fossil foraminifera at 108 and 106 cm. XRF Ti and Fe intensities are anti-correlated with Ca. They show little variation for most of the unit, except at the top and bottom of the unit. Potassium shows little variation. XRD analysis on bulk sediment from 110 to 108 cm shows mineralogy dominated by quartz and calcite with minor dolomite and clay minerals. This mineral assemblage is similar to that described for the depth of 130–128 cm in Unit A.
Unit C (100.5–83 cm) is a red upward-fining segment with continuous presence of fossil foraminifera. The boundary between the Units B and C is marked by an abrupt change in grain size and color, with the base of Unit C being much coarser. The X-radiography shows persistent millimeter-scale laminations not observable by the eye. Mineral grains seen in smear slides generally have angular shape throughout this unit. MS and other properties show a clear division of this unit into two subunits. Between 100.5 and 91.5 cm, MS, K, Ti, and Fe intensities are low, while Ca intensities are high. From 91.5 cm to the top of the unit at 83 cm, MS, K, Ti, and Fe are high, and Ca is low. XRD analyses show that the segment between 98 and 95 cm is mostly composed of quartz and calcite. The interval between 90 and 88 cm is composed of abundant quartz and clay minerals with minor calcite and dolomite. The interval between 86 and 85 cm consists mainly of quartz, calcite, some feldspars and minor dolomite, but no clay minerals.
Unit D (83–60 cm) has a 1.5-cm-thick layer of broken and whole shells of freshwater mollusks at the base of the unit and fossil foraminifera at 76.5 cm (Fig. 4). The boundary between Units C and D has an abrupt change in grain size, lithology, and sediment color. The upper part of Unit C is the commonly observed reddish color, while Unit D is grayer. The remainder of the unit shows little sedimentary fabric such as banding and lamination whether in X-radiography or by visual inspection. It also lacks charcoal (>125 μm), which is found throughout the rest of the core. Overall, the MS and the chemical composition are relatively uniform throughout the unit. XRD results from 83 to 82 cm are primarily quartz and calcite with minor dolomite but no clay minerals.
Unit E (60–42 cm) is a predominantly massive brownish-gray marl with little visible sedimentary fabric. The only noticeable features occur in the form of thin red lamina and a bleb of clay-sized sediment at 58 cm and 56 cm, respectively. Fossil foraminifera are found at 51, 49, and 46 cm. MS and XRF data show slightly higher intensities of K, Ti, and Fe at the bottom of this unit and only minor variation for the rest of the unit. The overall mottled appearance of the sediment is reflected in the X-radiography with no evidence of lamination. XRD analyses indicate quartz and calcite as the major minerals at 56–55 cm and at 52–50 cm.
Unit F (42–0 cm) is brownish-gray with indistinct reddish zones from 35 to 30 cm; an isolated 2-cm-thick red layer at 22–20 cm; a shell-rich layer at 28 cm; and fossil foraminifera at 32, 29, and 20 cm. MS peaks at 23–20 cm and then declines toward the top of the core. XRF intensities of K, Ti, and Fe show a subtle increase around 23 cm, while Ca shows a decrease. XRD results at 32.5–30.8 cm (part of the reddish zone) indicate quartz and calcite as major minerals, with clay minerals and dolomite as minor minerals. XRD on the sediment from 17 to 15 cm shows the major minerals to be quartz and calcite.
87Sr/86Sr and 143Nd/144Nd isotopes
For the most part, the 87Sr/86Sr ratios for the carbonate fraction of the core were uniform, with an average value of 0.70768 ± 0.00013 (2σ; Table 4).
The silicate fraction of the laminated Unit A has 87Sr/86Sr ratios and ɛNd values between 0.7083 and 0.7096 and −5.6 and −3.5, respectively (Figs. 4 and 5). The highest 87Sr/86Sr values and lowest ɛNd values occur in the massive Unit D, ranging between 0.7103 and 0.7113 and −5.3 and −4.5, respectively. In massive Units E and F, 87Sr/86Sr ratios are the lowest, ranging from 0.7068 to 0.7085 and ɛNd values are the highest, between −3.6 and −3.0 (Fig. 5).

Figure 4. Composite of analytical data collected from Core LK12-22. (a) Scanned image of the core; (b) lithologic units A–F; (c) flood units 1–4 are shown as gray intervals; (d) depths at which fossils of Late Cretaceous–Eocene marine foraminifera were found. Gray bands indicate (mollusk) shell-rich layers; (e) magnetic volume susceptibility (dimensionless in SI units); (f–i) show scanner-XRF (Mo source) spectral intensities in units of 103 cps for K (f), Ca (g), Ti (h), and Fe (i); (j) 87Sr/86Sr ratios for silicate sediment; and (k) ɛNd values for the silicate sediment. Note the anti-correlated peaks of Ca vs. Fe, Ti, and K in the laminated lithologic Unit A.

Figure 5. 87Sr/86Sr ratios and ɛNd values in the silicate fractions of LK12-22 core sediments, surface sediments from the lake, and soil samples. Sediment samples of LK12-22 (A to F) lie along an array between the field of Terra rossa (TR) soils and basaltic soils (e.g., Huk-2 sample). Sediment samples from Units A, C and D lie within the 87Sr/86Sr–ɛNd field of Fazael soils (Palchan et al., Reference Palchan, Stein, Goldstein, Almogi-Labin, Tirosh and Erel2018). The 87Sr/86Sr–ɛNd field of Terra rossa (TR) soils encloses all Tzalmon soil samples and partly overlaps the field of the silicate fraction of settled dusts transported from the Sahara Desert (Haliva-Cohen et al., Reference Haliva-Cohen, Stein, Goldstein, Sandler and Starinsky2012; Palchan et al., Reference Palchan, Erel and Stein2019). Amud soil samples define a field that lies between the isotope values of settled desert dusts and the “Valley Loess” (Palchan et al., Reference Palchan, Stein, Goldstein, Almogi-Labin, Tirosh and Erel2018). The lacustrine surface sediments marked as “Lake sediments” lie on various segments of the diagram. Part of them lie on the vertical extension of the Valley Loess between 87Sr/86Sr ratios ~0.7080 ± 1 and ɛNd values ~ −11 to −8 (Palchan et al., Reference Palchan, Stein, Goldstein, Almogi-Labin, Tirosh and Erel2018). The inset (b) shows the field of the 87Sr/86Sr ratios and ɛNd values of the silicate fractions of LK12-22 core samples, emphasizing that they form an array between the isotope fields of the Terra rossa and basaltic soils.
The silicate fraction of the lake surface-sediment samples from the vicinity of the core site (LK159, LK161, labeled as Ginosar sediments) has 87Sr/86Sr ratios of 0.7076 to 0.7084 and ɛNd values of −5.6, similar to the soil samples of the lower part of the Nahal Amud catchment (Amud 1 and Amud 2). Other surface-sediment samples have 87Sr/86Sr ratios of 0.7062 to 0.7071 and ɛNd values of −4.8 to −1.3. The basaltic soil sample (Huk 2) containing basalt fragments, collected above the Nahal Amud valley, has a 87Sr/86Sr ratio of 0.7035 and a ɛNd value of 2.7. Soils collected from the catchments of the Tzalmon and Amud streams (except Amud 1, Amud 2, and Huk 2) have the highest 87Sr/86Sr ratios and lowest ɛNd values, varying between 0.7111 and 0.7128 and between −7.6 and −5.1, respectively.
DISCUSSION
Chronology of Core LK12-22
Using the modeled ages, Unit A approximately corresponds with the Middle to Late Bronze Age (1750–1150 BCE), Unit B with the Iron Age (1150–586 BCE), Units C and D with the Persian–Hellenistic–Roman–Byzantine periods (586 BCE–632 CE), and Units E and F with the Arabic and Ottoman periods (632–1917 CE; Fig. 4). No charcoal was recovered from Units C and D, possibly indicating that wildfires were less frequent during the Persian–Hellenistic–Roman–Byzantine periods. All archaeological periods refer specifically to those applicable to the Levant (Table 5).
Table 5. Archaeological and historical periods of the southern Levant.

Age intervals indicated for different lithologic units (see next section) are median ages for each depth determined with the radiocarbon age–depth model (Blaauw and Christen, Reference Blaauw and Christen2011; Blaauw et al., Reference Blaauw, Christen, Aquino Lopez, Esquivel Vazquez, Gonzalez, Belding, Theiler, Gough and Karney2021). The carbon age–depth model suggests that sedimentation rate was 0.35 mm/yr for the interval of 143–50 cm (~2600 yr) and a higher rate of 0.65 mm/yr for the interval of 43–0 cm (~650 yr). These rates are low compared with the sedimentation rate of ~2 mm/yr recorded for the Holocene section reconstructed at the depocenter of the lake near Station A (Schiebel and Litt, Reference Schiebel and Litt2018; Fig. 1). There, mostly endogenic calcite is deposited from the lake water (e.g., Fruchter et al., Reference Fruchter, Lazar, Nishri, Almogi-Labin, Eisenhauer, Beeri-Shlevin and Stein2017), responding to the continuous supply of Ca and bicarbonate ions by the Jordan River (Katz and Nishri, Reference Katz and Nishri2013).
Sediment deposition offshore of the Ginosar valley during the past \sim4 ka
Unit A (143–122 cm, ~3.9 to 3.4 cal ka BP, the Middle to Late Bronze Age) consists of laminae of endogenic calcite deposited from the lake water and fluvial fine-grained sediment. In the modern lake, the deposition of endogenic calcite is associated with the spring to early summer algal bloom (Katz and Nishri, Reference Katz and Nishri2013; Fruchter et al., Reference Fruchter, Lazar, Nishri, Almogi-Labin, Eisenhauer, Beeri-Shlevin and Stein2017; Lev et al., Reference Lev, Stein, Ito, Ben-Avraham and Almogi-Labin2019). The preservation of the laminations is likely the result of sediment having been undisturbed by waves and from bioturbation due to hypoxic to anoxic conditions. The near absence of ostracod shells in this unit indicates deposition at a minimum water depth of ~15 m, which is the shallowest upper boundary of oxic to hypoxic bottom waters today. Fifteen meters is the greatest depth where ostracods live in the lake today (Kalanke, Reference Kalanke2015; Lev et al., Reference Lev, Stein, Ito, Ben-Avraham and Almogi-Labin2019).
Laminations on a similar scale are not found in any other part of the core. A laminated sequence of a coeval period, barren of ostracods, was documented in Core SOG3 (Figs. 1b and 6) and was correlated to Mid-Holocene high lake stand (Lev et al., Reference Lev, Stein, Ito, Ben-Avraham and Almogi-Labin2019). Core KIN2, which was drilled at Ohalo II archaeological site, shows that ~6 m sequence of continuously laminated sediments was deposited between ~28 and 24 cal ka BP during an earlier high stand when the lake reached its maximum elevation of 170 m bmsl (Hazan et al., Reference Hazan, Stein, Agnon, Marco, Nadel, Negendank, Schwab and Neev2005; Lev, Reference Lev2016; Miebach et al., Reference Miebach, Chen, Schwab, Stein and Litt2017). Thus, the laminated sequence in LK12-22 was likely deposited at times of significant freshwater supply to the lake during a more humid climate, as suggested by Hazan et al. (Reference Hazan, Stein, Agnon, Marco, Nadel, Negendank, Schwab and Neev2005), Langgut et al. (Reference Langgut, Finkelstein and Litt2013), and Lev et al. (Reference Lev, Stein, Ito, Ben-Avraham and Almogi-Labin2019). The deposition of laminated sediments possibly began earlier than ~3.9 cal ka BP (the bottom of Unit A), coinciding with Mid-Holocene high lake stand (~200 m bmsl) documented at Tel Bet Yerah above the Ohalo shore (Hazan et al., Reference Hazan, Stein, Agnon, Marco, Nadel, Negendank, Schwab and Neev2005; Lev et al., Reference Lev, Stein, Ito, Ben-Avraham and Almogi-Labin2019; Fig. 1) and with the timing of high stand at the hypersaline Dead Sea (Migowski et al., Reference Migowski, Stein, Prasad, Negendank and Agnon2006).

Figure 6. Relevant Sea of Galilee cores (Lev et al., Reference Lev, Stein, Ito, Ben-Avraham and Almogi-Labin2019; and this study). The locations of the cores are shown in Fig. 1. The numbers next to each core indicate the depth of obtained core sediments in meters below mean sea level (m bmsl). The core tops of the Ohalo (OH II) trench and Core KIN2 are very close to the SW shoreline of the last glacial maximum or older age. The top of Core SOG2, from the southern shallower part of the lake (226 m bmsl), is of the Younger Dryas age and that of Core SOG3, located close to Core LK12-22, is of latest Holocene age. Solid red color indicates massive marls, and black and white stripes indicate laminated marls.
Above Unit A, the sediment is largely composed of massive marls. This sedimentary facies characterizes the rest of the core, except for some small intervals in Units C and D. Nevertheless, there are some significant differences in the mineralogy, grain size, and other properties of sediments comprising various massive marl sections in the rest of the core.
Unit B (122–100.5 cm) consists of massive marls that were deposited between ~3.4 and 2.6 cal ka BP, an interval that encompasses the Iron Age. The mineralogy of quartz, calcite, and some feldspars and clays and textural appearance and color similar to Units E and F suggest that the marls are composed mostly of a mix of basaltic soils and mountain soils of Ginosar valley catchments.
Units C and D (100.5–83 cm and 83–60 cm, respectively) were deposited between 2.6 and 1.5 cal ka BP, which encompasses the Persian, Hellenistic, Roman, and Byzantine periods. The lower half of Unit C (100–90 cm) is coarse grained (Fig. 3) with very high Ca (Fig. 4). The minerals comprising the upper half of Unit C and most of Unit D (excluding the 2-cm-thick coarse sediment at the Unit C–D boundary) are mainly quartz, calcite, and clay that resemble the composition of the mountain soils. The lower half of Unit C contains broken and corroded fossil foraminifera that were likely weathered out of the Cretaceous–Eocene carbonate bedrock of the Galilee Mountains, and it is especially rich in Ca, but the XRD results of a sample from 98 to 95 cm only indicated quartz and calcite with little else (Supplementary Table 2), suggesting high Ca detected by XRF is mostly due to fossils. The presence of fossil remains is consistent with enhanced erosion due to rare strong rains and resulting massive floods during the dry Persian and Hellenistic periods. A sample from the upper half of Unit C (86–85 cm) indicated abundant quartz and clays with minor calcite and dolomite (Supplementary Table 2). The 2-cm-thick sandy sediment at the boundary between Units C and D is composed of calcite and quartz with minor dolomite (Supplementary Table 2) and may also represent a result of rare flood events with significant erosion typically occurring during dry periods.
Sediments of the upper half of Units C and most of Unit D suggest a hydroclimatic condition that was wetter than the period represented by Unit B and the lower half of Unit C, which contain a higher proportion of basaltic soils and a lower proportion of mountain soils. Archaeological records of the Levant indicate that the Persian and Hellenistic periods were generally dry and Roman and Byzantine periods were wet (Langgut et al., Reference Langgut, Finkelstein, Litt, Neumann and Stein2015; Schiebel and Litt, Reference Schiebel and Litt2018). The modeled age of ~2.6 cal ka BP for the base of Unit C is inconsistent with an assumed transition from the Hellenistic to the Roman period. However, the age–depth model has the largest uncertainty in this part of the core, with large ranges between modeled minimum and maximum ages (Fig. 2). Thus, it is difficult to determine the age of the lithologic change between Units B and C. Based on the mineralogy and grain-size distribution and the agreement in 87Sr/86Sr ratios of mountain soil samples from the Nahal Tzalmon catchment and core samples (88, 87, and 68 cm), we interpret the 90–60 cm interval to correspond with the Roman–Byzantine period.
Units E and F (60–42 cm and 42–0 cm, respectively), deposited between 1.5 cal ka BP and the present, consist of massive marls with some broken fossil foraminifera and mollusk fragments. Unit E has a radiocarbon age reversal (LK5). The reason for the apparent age reversal could be a slope failure event, a sudden translocation of older lake sediment that had been deposited higher on the lake-basin slope and settled at the core site (Bonnecaze et al., Reference Bonnecaze, Huppert and Lister1993; Francke et al., Reference Francke, Wennrich, Sauerbrey, Juschus, Melles and Brigham-Grette2013). In addition to the age reversal, an angular mud chip of fine-grained sediment at 58 cm and an isolated clay-rich layer at 56 cm can be suggested as further pieces of evidence of sediment remobilization. The angular mud chip of red clayey sediment could have been reworked during the slope-failure event from fine-grained sediment that had been deposited upslope from the core site when the lake level was higher and redeposited with the silt-sized sediment. The isolated layer of clay-sized sediment is also dark brownish red and is thinner on one side. It could be that this layer is another “rip-up clast,” like the angular mud chip, but it remained more or less intact during transport.
A slope-failure event at the core site would result in the loss of sediment to a deeper lake zone that would show up as a hiatus or unconformity. The very low sediment accumulation rate between 50 and 40 cm depths (between radiocarbon samples LK4 and LK5) is consistent with this scenario. A slope failure originating upslope from the core site may place older sediment on top of younger sediment that stayed in place. Taken at face value, such a scenario suggests that the sediment package that includes the LK5 radiocarbon sample came from upslope and settled on in situ sediment that includes the LK6 radiocarbon sample. However, this scenario does not explain the lower sedimentation rate between 50 and 40 cm. A bigger slope-failure event that encompassed a larger area in which sediment is both lost from the core site and gained from an upslope location is a possibility.
The slope failure may reflect a large surge of sediment-laden water coming from Nahal Amud and/or Nahal Tzalmon or a seismic event. We propose that the slope failure was possibly triggered by the major earthquake of January 18, 749 CE (1201 cal yr BP), termed “the “Sabbatical Earthquake,” that occurred around 32°N and 35.5°E (NGDC/WDS, n.d.; Ferry et al., Reference Ferry, Meghraoui, Abou Karaki, Al-Taj and Khalil2011). The age–depth model indicates that sediments of Unit E were deposited between ~1.5 and 0.6 cal ka BP. Although other earthquakes are known from this time interval in the vicinity of the Jordan valley and Dead Sea Transform (Migowski et al., Reference Migowski, Agnon, Bookman, Negendank and Stein2004; Salamon, Reference Salamon2010), we think that the sediment disruption can be identified with the Sabbatical Earthquake, which caused severe damage along the Dead Sea Transform. Marco et al. (Reference Marco, Hartal, Hazan, Lev and Stein2003) documented the damage in the nearby Galei Kinneret site (e.g., Herod stadium), linking it to the event documented north of the Dead Sea (~130 km south of Ginosar), arguing that its magnitude was ~7. The earthquake caused damage in Capernaum (6 km north of Ginosar), seiche in the Dead Sea, and a tsunami in the Mediterranean Sea (Ben-Menahem, Reference Ben-Menahem1991) and was also identified as disturbed layers in Dead Sea cores (Migowski et al., Reference Migowski, Agnon, Bookman, Negendank and Stein2004; Kagan et al., Reference Kagan, Stein, Agnon and Neumann2011). However, we cannot rule out that a slope failure may have been caused by an exceptionally large flood discharged by Nahal Amud or Nahal Tzalmon or by some other earthquake, such as the December 5, 1033 (912 cal yr BP) event that is estimated to have occurred near Jericho or Nablus, Israel (Salamon, Reference Salamon2010).
The hydroclimatic regime during the past ~1500 yr was generally drier than during the Roman–Byzantine periods, with occasional floods that delivered sediments that accumulated as massive marls. This time interval includes the Arabic and Ottoman periods, which were also described as arid periods in the Dead Sea catchment (Kushnir and Stein, Reference Kushnir and Stein2019; Weber et al., Reference Weber, Lazar, Gavrieli, Yechieli and Stein2021).
The Sr-Nd isotope values of main soil types in the Sea of Galilee catchment
By correlating the core sediments with catchment soil types, we can deduce the changes in the source of core sediments over time (Fig. 1b). Soil provenance reconstruction requires an accurate identification of the sources of fine-grained detrital sediments that were likely transported from the catchment of the Ginosar valley to the site of Core LK12-22 during the past ~4 ka. The main soil types of the Upper and East Galilee are: (1) Terra rossa, Pale Rendzina, and Brown Rendzina (mountain soils) and (2) Grumosols and Protogrumosols on basalts (basaltic soils). Colluvial–alluvial soils occupy low-lying areas near the lakeshore and interior valleys (Fig. 1b; see comparison to WRB classification in Supplementary Table 1). Mountain soils develop on the surface of the Judea–Samaria–Galilee mountain backbone of Israel under Mediterranean climate conditions. The source material of Terra rossa and Brown Rendzina is mainly dust, whereas that of Pale Rendzina is both dust and weathered bedrock (Yaalon, Reference Yaalon1997; Sandler et al., Reference Sandler, Meunier and Velde2015). The Cyprus low-pressure system, the Mediterranean cyclones, brings rain and dust particles to the East Mediterranean–Levant region (Dayan and Morin, Reference Dayan, Morin, Enzel, Agnon and Stein2006; Kalderon-Asael et al., Reference Kalderon-Asael, Erel, Sandler and Dayan2009). The dust particles, consisting mostly of quartz and calcite grains, the latter termed “desert dust calcites” (Haliva-Cohen et al., Reference Haliva-Cohen, Stein, Goldstein, Sandler and Starinsky2012), minor clay minerals, and some feldspars eventually settle on the surface of the southern Levant such as the Negev Desert and the Judea, Samaria, and Galilee Mountains (Sandler et al., Reference Sandler, Meunier and Velde2015; Palchan et al., Reference Palchan, Stein, Goldstein, Almogi-Labin, Tirosh and Erel2018, 2019). There, chemical weathering and pedogenic processes of desert dust calcites transform the settled dust into various types of soil. The Terra rossa, whose pedogenic processes include complete dissolution of desert dust calcites, is mainly composed of silt-size quartz grains and clay minerals and shows 87Sr/86Sr ratios of ~0.709–0.713 (e.g., Palchan et al., Reference Palchan, Stein, Goldstein, Almogi-Labin, Tirosh and Erel2018, 2019). The complete dissolution of the desert dust calcite causes the higher 87Sr/86Sr ratios of the residual feldspar and clay minerals to characterize Terra rossa (Palchan et al., Reference Palchan, Stein, Goldstein, Almogi-Labin, Tirosh and Erel2018, 2019). Overviews of the development of the mountain soils are given by Yaalon (Reference Yaalon1997), Singer (Reference Singer2007), and Sandler et al. (Reference Sandler, Meunier and Velde2015).
Calcium and bicarbonate ions from the dissolution of the desert dust calcite can partly form pedogenic carbonates; can be transported by runoff and groundwater to caves forming speleothems; or can be transported to the Mediterranean, the Sea of Galilee, or the Dead Sea, where they form endogenic carbonate minerals, such as aragonite in the last glacial Lake Lisan or the Holocene Dead Sea or calcite in the modern Sea of Galilee (Stein et al., Reference Stein, Starinsky, Katz, Goldstein, Machlus and Schramm1997; Fruchter et al., Reference Fruchter, Lazar, Nishri, Almogi-Labin, Eisenhauer, Beeri-Shlevin and Stein2017; Palchan et al., Reference Palchan, Stein, Goldstein, Almogi-Labin, Tirosh and Erel2018; Belmaker et al., Reference Belmaker, Lazar, Stein, Taha and Bookman2019; Lev et al., Reference Lev, Stein, Ito, Ben-Avraham and Almogi-Labin2019). The mountain soils are also transported by runoff to the same destinations, providing detrital minerals to the water bodies (Haliva-Cohen et al., Reference Haliva-Cohen, Stein, Goldstein, Sandler and Starinsky2012; Palchan et al., Reference Palchan, Stein, Goldstein, Almogi-Labin, Tirosh and Erel2018).
The modern surface cover materials of Nahal Tzalmon and Nahal Amud occupy two distinct fields in the Nd-Sr isotope diagram (Fig. 5). The Nahal Tzalmon soils have 87Sr/86Sr–ɛNd values that are typical of mountain soils. The soils from the Nahal Amud catchment have ɛNd values similar to those of the Tzalmon soils but 87Sr/86Sr ratios that converge toward the composition of a type of loessial soils found in the Judean Desert and topographic lows of the northern Negev Desert. These “low-topography” loessial soils are characterized by 87Sr/86Sr ratios of ~0.7080 and were termed “Valley Loess” by Palchan et al. (Reference Palchan, Stein, Goldstein, Almogi-Labin, Tirosh and Erel2018, Reference Palchan, Erel and Stein2019). The Sr in these Valley Loess soils is inherited from the calcite grains comprising the original desert dusts. The similarity between the 87Sr/86Sr isotope ratios of the Nahal Amud soils and those of the Valley Loess (and the desert dust calcites) probably indicates that the Nahal Amud soils were subjected to similar pedogenic processes that led to the formation of the Valley Loess.
87Sr/86Sr–ɛNd values in Core LK12-22 as tracers of surface cover of the Ginosar valley catchment
The surface cover materials, such as mountain and basaltic soils of the catchment area, were transported by Nahal Tzalmon and Nahal Amud to the lake. The silicate fraction of Core LK12-22 sediment lies on the 87Sr/86Sr–ɛNd diagram between the mountain soils that dominate the surface cover of Nahal Tzalmon catchment today and less radiogenic surface cover material that contains basaltic soils (Fig. 5). The silicate fraction of sediments of Unit A, the upper half of Unit C, and most of Unit D lies closer to the mountain soils field, while those of Units E and F are closer to the field of the basaltic soils (Fig. 5). Today, basaltic soils comprise the surface cover of the Ginosar valley close to the lake, while mountain soils extend more to the west in the higher reaches of Nahal Tzalmon and Nahal Amud (Fig. 1b). Core sediments that represent wetter periods in the Upper and East Galilee, such as Units A, C, and D of Middle to Late Bronze, Roman, and Byzantine periods, contain mobilized mountain soils, while those that were deposited during drier periods (e.g., Units E and F, the Arabic and Ottoman periods) contain more basaltic soils. This difference between the Nd-Sr isotope compositions of wetter and drier time periods may be related to increased production rates of the mountain soils during wetter time intervals or to increased erosion and mobilization of mountain soils that accumulated earlier in topographically low areas of the Nahal Tzalmon and Nahal Amud catchments to the Ginosar valley and the lake. The second scenario appears more likely, because it does not require that mountain soils form very quickly.
We note that the Nd-Sr isotope data of the LK 12-22 core samples from the wet intervals represented by Units A, C, and D lie in the field of the Fazael soils (e.g., Palchan et al., Reference Palchan, Erel and Stein2019). The reddish Fazael soils fill topographic lows along the Jordan valley and the eastern flanks of the Samaria Hills (e.g., the Fazael area) and were transported to those valleys from the Judea and Samaria Mountains during the Early Holocene (Palchan et al., Reference Palchan, Erel and Stein2019). We think that similar type of soils formed and accumulated in the Tzalmon catchment in the Upper Galilee, possibly during the last glacial period, and were later mobilized to Ginosar valley and the Sea of Galilee during the wet periods of the Middle to Late Bronze and Roman–Byzantine times. Pollen data from the Holocene cores are consistent with higher precipitation on the Galilee Mountains during the Middle to Late Bronze Age and during the Roman–Byzantine period and drier conditions during the Iron Age and Arabic–Ottoman periods (Langgut et al., Reference Langgut, Finkelstein, Litt, Neumann and Stein2015; Schiebel and Litt, Reference Schiebel and Litt2018). Yet the low sedimentation rates during all intervals of the core and the preservation of the last glacial soils in the Tzalmon catchment in the Upper Galilee suggest that the erosion, removal, and mobilization of soils from their sources in the Galilee to the lake were not significant. Otherwise, we would expect to see emptying of the soil sources. In other words, the landscape and the surface cover are nearly unchanged during most of the post glacial periods. Yet, while the last glacial period was most conducive for soil production, short-lived pedogenesis may have occurred during later periods, such as ~5 ka BP (Crouvi et al., Reference Crouvi, Barzilai, Goldsmith, Amit, Matskevich, Porat and Enzel2018), and possibly during the relatively wet periods of Middle to Late Bronze and Roman–Byzantine.
Sources of non-carbonate detrital sediments to the Sea of Galilee
While Core LK12-22 captures the detrital particles delivered from the catchments of the Nahal Amud and Nahal Tzalmon, inclusion of data from cores that were acquired at other areas of the lake (Fig. 1b) and surface sediments that we collected from various locations across the lake (Fig. 7a) provide a more comprehensive understanding of the type and mode of formation of sources of fine detrital particles that were mobilized from the entire catchment of the lake. There is no tight constraint on the ages of the lake's surface sediments. The tops of the cores that were drilled in the southern shallow area of the basin (OH II and KIN2; Fig. 6) yielded ages of the last glacial period, during which Lake Lisan rose to its highest stand and merged with the Sea of Galilee (Hazan et al., Reference Hazan, Stein, Agnon, Marco, Nadel, Negendank, Schwab and Neev2005; Lev et al., Reference Lev, Stein, Ito, Ben-Avraham and Almogi-Labin2019). The top of a core from the deeper northern area (Core SOG3; Fig. 6) of the basin yielded Late Holocene to modern ages.
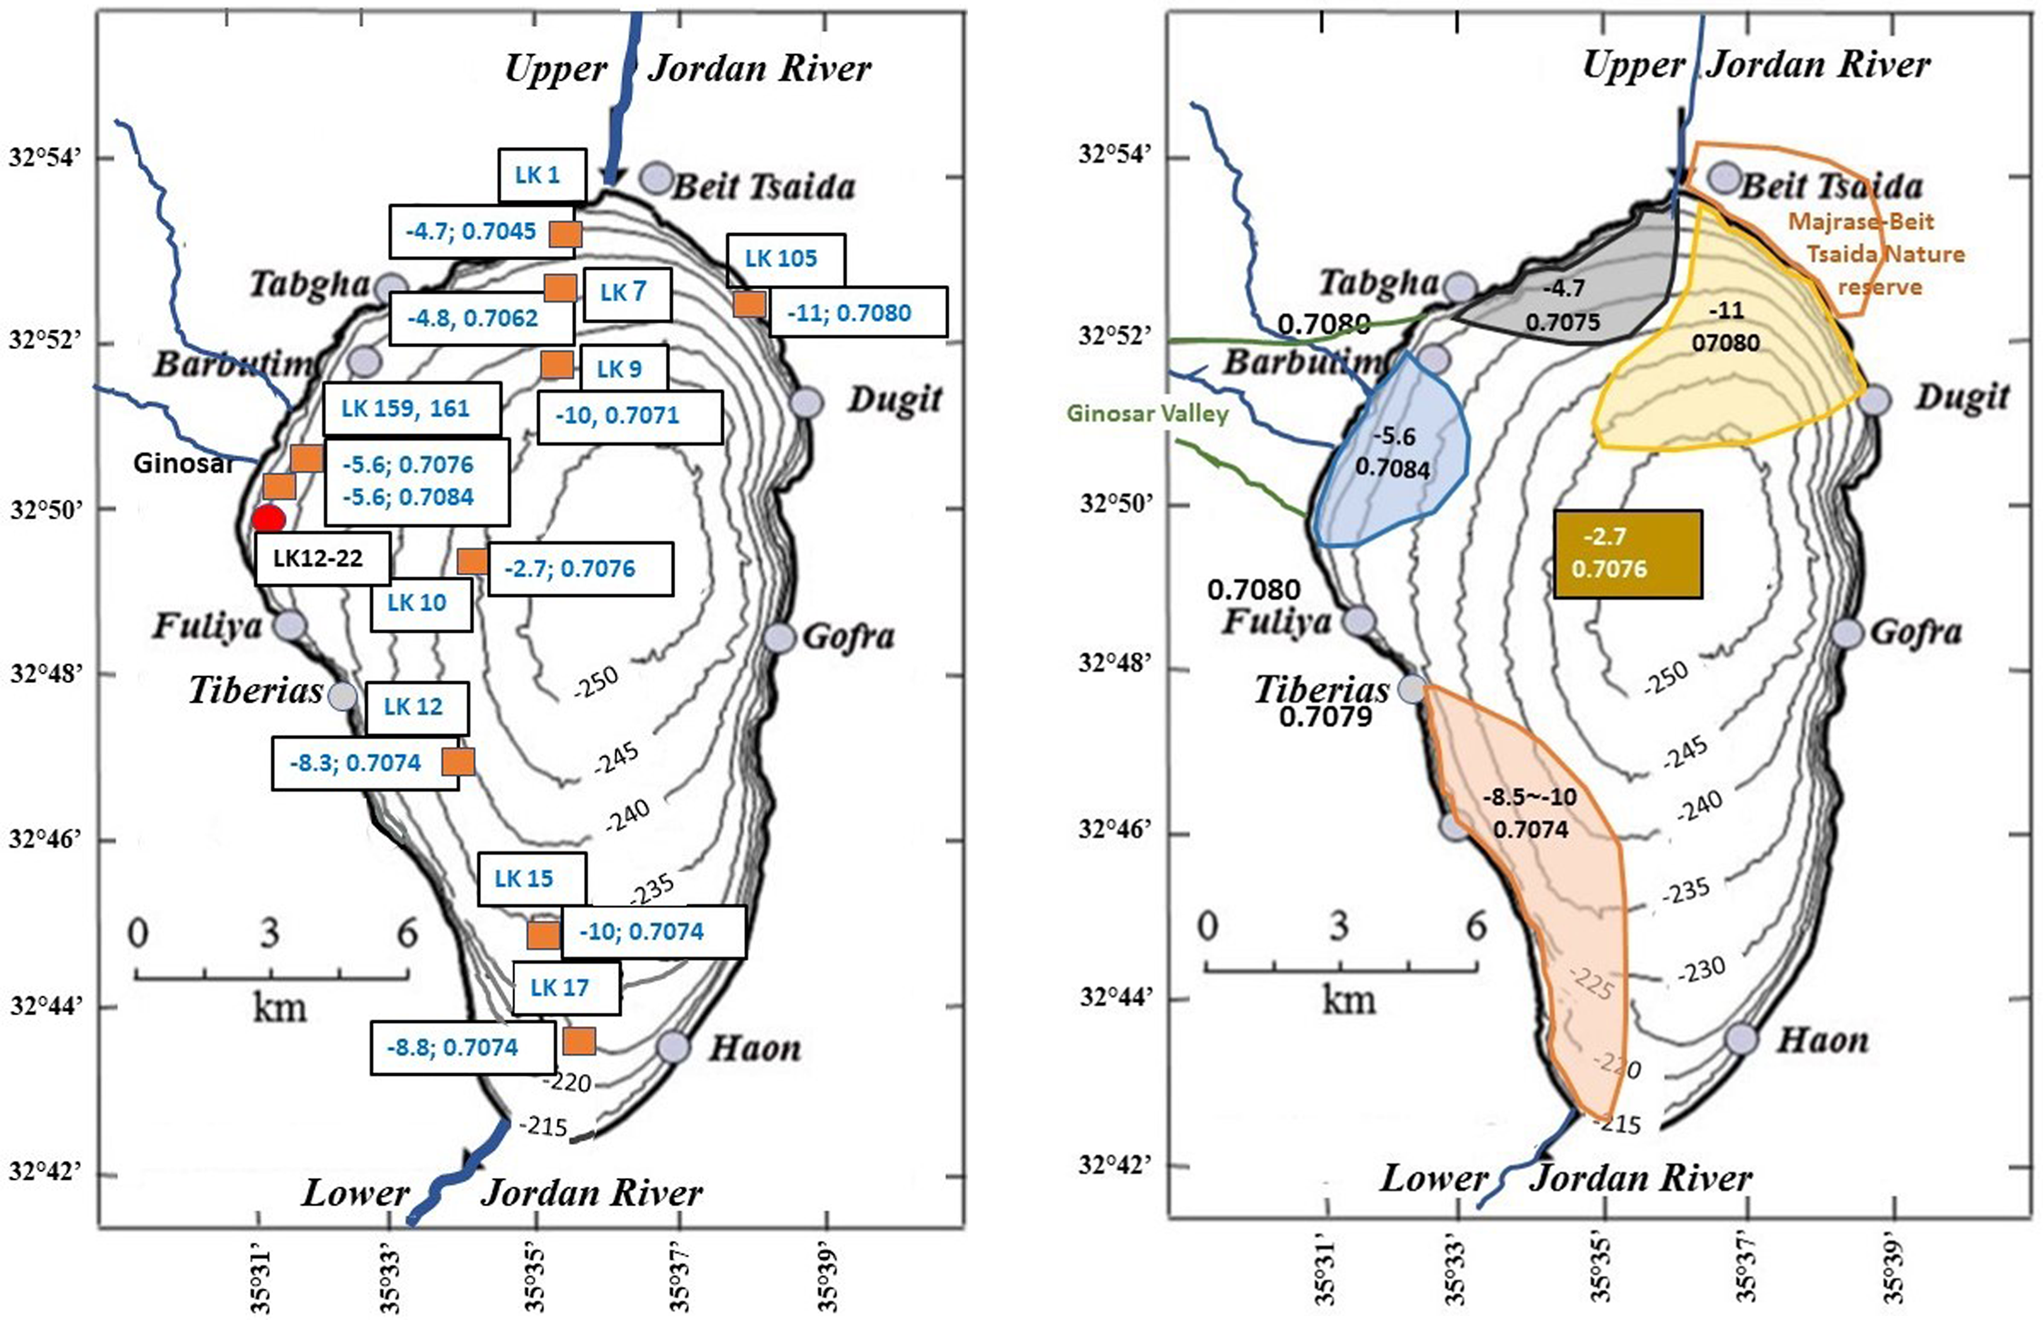
Figure 7. (a) ɛNd values and 87Sr/86Sr ratios in the silicate fraction of surface sediments collected from the Sea of Galilee. The contour lines indicate depths in meters below mean sea level (m bmsl) with shoreline elevation of 213 m bmsl. (b) ɛNd-87Sr/86Sr “regions” based on non-carbonate fraction of modern surface sediments. The Nd and Sr isotope values indicate the type of surface cover soil material that was transported by various streams to the lake. The northwestern sector (gray-shaded area) consists of sediments from the Jordan River, and the area offshore of the Ginosar valley (blue-shaded area) reflects soils of the Nahal Amud and Nahal Tzalmon catchments. The southwestern (orange-shaded area) and northeastern (yellow-shaded area) regions are characterized by very low ɛNd values reaching ~ −10 to −8.5 and −11 and 87Sr/86Sr ratios of ~0.7074 and 0.7077, respectively. The sediments of the yellow-shaded area get their Sr and Nd from the streams draining the Majrase-Beit Tsaida Nature Reserve wetland area. In the orange-shaded area, the surface sediments show somewhat less negative ɛNd values and lower 87Sr/86Sr ratios than those of the northeastern sector of the lake floor.
The surface sediments from the vicinity of LK12-22 (LK159 and 161; Fig. 7a; Table 4) show 87Sr/86Sr ratios and ɛNd values that are nearly identical to the basaltic Grumosols (Amud 1 and Amud 2 soil samples; Table 4), reflecting the drier climate also recorded in Unit F of LK12-22 (Figs. 5 and 7a). Thus, the surface sediments provide a snapshot of the composition of the surface cover of the regional catchment areas (Fig. 7b). The 87Sr/86Sr ratios and ɛNd values of the silicate fraction of surface sediments in the northern sector of the lake bottom reflect Jordan River input (Fig. 7a). The 87Sr/86Sr ratios of the silicate fractions of other surface sediments plot close to ~0.7080. This ratio characterizes desert dust calcites comprising the settled desert dusts that blew in from the Sahara Desert (Haliva-Cohen et al., Reference Haliva-Cohen, Stein, Goldstein, Sandler and Starinsky2012). Non-carbonate authigenic minerals in the lake's surface sediments formed in soils derived mainly from settled dusts inherited the Sr from the dissolved calcites, as was described for the formation of the Valley Loess in areas of topographic lows in the Judean Desert (Palchan et al., Reference Palchan, Stein, Goldstein, Almogi-Labin, Tirosh and Erel2018). The Nd isotope values of surface sediments from the southwestern and northeastern sectors have very negative ɛNd values between −11 and −8 (Fig. 7a). These very negative ɛNd values reflect the contribution of Nd to authigenic minerals from the dissolved desert dust calcites that show ɛNd values between −16 and −11 (Palchan et al., Reference Palchan, Stein, Goldstein, Almogi-Labin, Tirosh and Erel2018, 2019) with possible additional contribution of Nd from silicates in the original desert dusts. During that last glacial period, basaltic soils could have formed in the northern areas of Israel—the Galilee and Golan Heights—where basaltic flows form part of the surface cover. Thus, the Nd-Sr isotopes of the lake floor surface-sediment samples and the LK12-22 core samples indicate that fine particles were eroded from areas where the surface cover comprises a mixture of basaltic and mountain soils, such as in the Ginosar valley catchment or from areas that are dominated by Valley Loess–type soils.
Overall, the preservation of these soils formed during the last glacial period in the Galilee and Golan Heights corroborate the conclusion based on LK12-22 sediment analyses that significant soil mobilization did not occur during the Holocene period. Yet the accumulation and preservation of eroded mountain soils within the fluvial soils in the lowlands around the Sea of Galilee support the prosperity of the settlements in the areas surrounding the west, north, and northwest of the Sea of Galilee, such as the Ginosar valley and the sites of Capernaum and Tabha during the Roman–Byzantine period.
SUMMARY AND CONCLUSIONS
The Late Holocene history of erosion and mobilization of soils from the Galilee Mountains to the Sea of Galilee is deciphered and used to determine the regional hydroclimatic conditions. This reconstruction is based on the mineralogical and chemical compositions and on Nd-Sr isotope ratios of sediments of LK12-22, which was cored offshore of the Ginosar valley, and of sediments collected from the several sites across the lake.
The core sediments span the past ~4 ka in the lake's history. The sediments are mostly composed of detrital silt-size quartz, calcite, and some clay minerals. Endogenic calcites also appear at the lower laminated section of the core during the Middle to Late Bronze time interval. The mountain soils were predominantly formed under the wetter conditions in the region during the last glacial period. The soils were later remobilized to the core site off the Ginosar valley in the Sea of Galilee by Nahal Tzalmon and Nahal Amud, reflecting the hydroclimatic conditions in the catchments.
The sources of the detrital materials that reached the core site off the Ginosar valley during the past 4 ka are traced by the mineralogy, grain size, and particularly the 87Sr/86Sr–ɛNd isotope values of the core sediments.
While mostly mountain soils were mobilized to the lake during the wetter Middle to Late Bronze Age (Unit A in the core) and Roman–Byzantine periods (the upper half of Unit C and all of Unit D), the drier Arabic–Ottoman periods (Units E and F) and possibly the Persian–Hellenistic time (Unit B) were characterized by mobilization of soils that contain more basaltic material. Thus, we conclude that wetter/drier periods were characterized by enhanced/reduced transport of mountain soils that currently characterize the Upper Galilee and the valleys of the Tzalmon catchment.
Yet the total amount of mobilized material during both wetter and drier periods of the last 4 ka was rather low, as indicated by the low sedimentation rate (average ~0.37 mm/yr). This suggests that most of the mountain soils that formed and accumulated during the wet last glacial period have not been removed. The surface cover still predominantly comprises the mountain soils. If sufficient moisture was available, agriculture could have flourished in the catchment areas of the Sea of Galilee during the drier Holocene.
Overall, the Sea of Galilee captures in its sedimentary records the temporal and spatial changes in the soil erosion and mobilization that reflect the regional hydroclimatic conditions. Our study also provides an environmental framework for the cultural–historical developments in the vicinity of the Sea of Galilee.
Acknowledgments
We thank the following personnel at the GSI: Moti Diamant and Oz Dar Tsabari (surface-sediment sampling), Hadar Elyashiv (grain-size analysis), Michael Kitin (grain-size analysis and fieldwork assistance), and Yaacov Mizrachi (fieldwork assistance). We also thank Michal Ben Israel for assistance to AW in the isotope lab at the Hebrew University of Jerusalem; the Kinneret Limnological Laboratory for providing space to work and sharing data; Jonathan Laronne and Noa Hillel from Ben-Gurion University for obtaining Amud and Tzalmon discharge data; Chris Paola for discussion about sedimentary fabric of the core and, in particular, the flood deposits; Kristina Brady and Jess Heck for assistance in the Continental Scientific Drilling Facility; and Vania Stefanova and Amy Myrbo for assistance exploring the limits of the rbacon age–depth model. Constructive comments by Jay Quade, two anonymous reviewers, and associate editor Peter Langdon and guidance by the Senior Editor Derek Booth significantly improved the article. This study was supported by BSF US-Israel Binational Science Foundation (Award 2010347) to AA-L and EI.
Supplementary material
To view supplementary material for this article, please visit https://doi.org/10.1017/qua.2022.26


 Open access