


Neuropsychological test batteries are commonly used in clinical settings and research to detect cognitive decline and the presence of dementia in older adults (OA). One of the most established test batteries was developed by the Consortium to Establish a Registry for Alzheimer’s disease (CERAD, Morris et al., Reference Morris, Heyman, Mohs, Hughes, van Belle, Fillenbaum and Clark1989) and has since been revised, expanded, and translated into more than 20 different languages (Duke Aging Center, n.d.; Fillenbaum et al., Reference Fillenbaum, van Belle, Morris, Mohs, Mirra, Davis and Welsh-Bohmer2008). The CERAD-Neuropsychological (CERAD-NP) test battery was developed to measure cognitive deficits in patients with Alzheimer’s disease of different stages including the early stages (Morris et al., Reference Morris, Heyman, Mohs, Hughes, van Belle, Fillenbaum and Clark1989). The CERAD-NP has good validity, reliability, and high acceptance among health professionals (Fillenbaum et al., Reference Fillenbaum, van Belle, Morris, Mohs, Mirra, Davis and Welsh-Bohmer2008; Morris et al., Reference Morris, Edland, Clark, Galasko, Koss, Mohs and Heyman1993). It has also been shown to be a suitable tool for detecting mild cognitive impairment (Breton, Casey, & Arnaoutoglou, Reference Breton, Casey and Arnaoutoglou2019).
The detection of mild impairment requires normative data against which individual test scores can be evaluated so that it can be determined whether they differ notably from the performance expected from a healthy individual. The first comprehensive normative data set of healthy OA (50–89 years) for the CERAD-NP clearly showed the influence of age, sex, and education on test performance (Welsh et al., Reference Welsh, Butters, Mohs, Beekly, Edland, Fillenbaum and Heyman1994). In addition, language and cultural background are also considered to be influencing factors (Paajanen et al., Reference Paajanen, Hanninen, Tunnard, Mecocci, Sobow, Tsolaki and AddNeuroMed2010). By now many additional normative data sets have been published (i.e., Kirsebom et al., Reference Kirsebom, Espenes, Hessen, Waterloo, Johnsen, Gundersen and Fladby2019; Liu et al., Reference Liu, Kuo, Tang, Chau, Ho, Kwok and Chu2011; Luck et al., Reference Luck, Pabst, Rodriguez, Schroeter, Witte, Hinz and Thiery2018; O’Bryant et al., Reference O’Bryant, Edwards, Johnson, Hall, Gamboa and O’jile2018).
While most of these data sets span a wide age range, the usefulness for OA beyond the age of 80 is limited because normative data sets for high-agers are often small and not well balanced according to gender or education (Miller et al., Reference Miller, Himali, Beiser, Murabito, Seshadri, Wolf and Au2015). A few studies have tried to combat this bias by studying the CERAD-NP performance of high-agers specifically. Beeri and colleagues (Reference Beeri, Schmeidler, Sano, Wang, Lally, Grossman and Silverman2006) obtained normative data from a sample of 196 healthy individuals 85 years and over in the USA. Additionally, Luck and colleagues (Reference Luck, Riedel-Heller, Wiese, Stein, Weyerer and Werle2009) published data for the age group >75 years in Germany, but only included the memory subtests of the CERAD-NP. Both studies concluded that using norms based on younger cohorts or only small, biased samples of an older age group can lead to more false positives and the subjective interpretation of results (Beeri et al., Reference Beeri, Schmeidler, Sano, Wang, Lally, Grossman and Silverman2006; Luck et al., Reference Luck, Riedel-Heller, Wiese, Stein, Weyerer and Werle2009).
Especially in the German-speaking area, there is a lack of normative data in this age range (>80 years) beyond the memory subtests. The German version of the CERAD-NP (Memory Clinic Basel (2005)) includes two additional tests (Trail Making Test and Verbal Fluency with S-Words) that measure executive functions (Schmid, Ehrensperger, Berres, Beck, & Monsch, Reference Schmid, Ehrensperger, Berres, Beck and Monsch2014). This version was validated (Aebi, Reference Aebi2002), and normative data are available for the original CERAD-NP tests based on a sample of 1100 Swiss healthy OA (49–92 years). The current normative data for the additional CERAD-NP tests are based on 604 Swiss healthy OA (50–88 years). However, the sample sizes of both these data sets are unequally distributed across age groups. For example, only one person was included for highly educated females in the age group >80 years. Luck et al. (Reference Luck, Pabst, Rodriguez, Schroeter, Witte, Hinz and Thiery2018) published an update of the CERAD-NP norms based on data obtained between 2011 and 2014, but only included the age range from 60 to 79 years.
This presents a good basis for applying the CERAD-NP to older samples both in Germany and internationally. Considering the increasing number of individuals older than 80 years in western societies and the concomitant increase of patients with dementia (Deutsche Alzheimer Gesellschaft e.V., 2018; Statistisches Bundesamt (Destatis), 2019), the frequency of and need for neuropsychological testing in this age group will continue to grow. Hence, reliable and comprehensive data sets for neuropsychological tests are required. Furthermore, normative data must be updated regularly to account for cohort effects and socio-environmental changes (Dickinson & Hiscock, Reference Dickinson and Hiscock2011). Thus, the primary objective of this study is to complement already published data by providing a current and comprehensive normative data set for individuals between 80 and 84 years of age that is based on all CERAD-NP subtests. Our sample can be considered part of the old-old age group, which is used as a term to describe adults between 75 and 85 years old (Boyd & Bee, Reference Boyd and Bee2006). As a secondary outcome, we use the same sample to investigate how performance relates to sight and hearing performance.
INFLUENCE OF HEARING AND VISION
Standard cognitive tests almost exclusively use visual and auditory stimuli and oral test instructions. Furthermore, visual impairments like cataracts, glaucoma or macular degeneration, and hearing loss are very common in populations over 80 years of age (Hesse, Eichhorn, & Laubert, Reference Hesse, Eichhorn and Laubert2014; Reitmeir et al., Reference Reitmeir, Linkohr, Heier, Molnos, Strobl, Schulz and Graw2017). Even though treatment and support with aids are routinely available, there is still a portion of individuals that do not regularly use their aids (Oberg, Marcusson, Nagga, & Wressle, Reference Oberg, Marcusson, Nagga and Wressle2012; Tsai, Reference Tsai2009) or who have impairments that cannot be sufficiently corrected or reversed by treatment (Nowak, Reference Nowak2006). Considering this, epidemiological study samples, as well as individuals receiving neuropsychological testing, probably cover a broad range of sensory functioning, and this must be considered when testing them.
As expected, impairments in visual and hearing ability have been shown to result in poorer performance in the Mini-Mental Status Examination (MMSE), part of the CERAD-NP, and other screening tools (Dupuis et al., Reference Dupuis, Pichora-Fuller, Chasteen, Marchuk, Singh and Smith2015; Lim & Loo, Reference Lim and Loo2018). To date, the relationship between hearing or vision and CERAD-NP performance in OA has not been clarified in any known studies. This knowledge is needed to better interpret the performance of OA with sensory impairments. Therefore, the secondary aim of this study is to examine the association between corrected visual acuity and corrected hearing ability and CERAD-NP performance.
Cross-sectional and longitudinal data have suggested that a substantial amount of variance in cognition can be explained by the quality of sensory functions (Li & Lindenberger, Reference Li and Lindenberger2002). This might be because there are reduced resources available for cognitive tasks as additional cognitive effort is required for perceptual success in the presence of sensory deficits (McCoy et al., Reference McCoy, Tun, Cox, Colangelo, Stewart and Wingfield2005; Wood et al., Reference Wood, Chaparro, Anstey, Lacherez, Chidgey, Eisemann and La2010), the so-called effortfullness hypothesis. Alternatively, the common cause hypothesis assumes that common neuropathological processes account for the changes in sensory and cognitive function (Uchida et al., Reference Uchida, Sugiura, Nishita, Saji, Sone and Ueda2019). A mixture of both explanations is most likely responsible for the strong connections between sensory and cognitive functioning during old age (Li & Lindenberger, Reference Li and Lindenberger2002).
METHODS
Sample
The nondemented volunteers were recruited as part of the SENDA (Sensor-based systems for early detection of dementia) study at the Chemnitz University of Technology, Germany. The study was approved by the Ethics Committee of the Chemnitz University of Technology (Faculty of Behavioral and Social Sciences) on December 19, 2017 (V-232–17-KM-SENDA-07112017) and is included on the German Clinical Trials Register (DRKS00013167). Recruitment strategies as well as inclusion and exclusion criteria can be found in Table 1. Among others the following exclusion criteria were applied here: diagnosed psychological disorders (e.g., major depressive episode, anxiety disorder, substance use disorder) and diagnosed neurocognitive disorders (e.g., delirium, dementia due to Alzheimer’s disease, dementia due to vascular disease). Eligibility was determined via telephone interview carried out by a trained study nurse. Furthermore, the face-to-face Montreal Cognitive Assessment (MoCA, Nasreddine et al., Reference Nasreddine, Phillips, Bedirian, Charbonneau, Whitehead, Collin and Chertkow2005) and the MMSE (Folstein, Folstein, & McHugh, Reference Folstein, Folstein and McHugh1975) as part of the CERAD-NP were carried out.
Table 1. Recruitment strategies, inclusion, and exclusion criteria of the SENDA study

a Participants were also included if they turned 80 during the course of the baseline measurements which included 3 separate testing days.
For more information refer to the SENDA study protocol by Müller et al. (Reference Müller, Fröhlich, Germano, Kondragunta, Agoitia Hurtado, Rudisch and Voelcker-Rehage2020).
Between January 2018 and March 2020, 201 volunteers (born between 1933 and 1939, age 80–84 years, M = 81.8, SD = 1.3) were recruited in Chemnitz and its surroundings. This five-year age range was chosen to ensure comparability with other normative data sets (Beeri et al., Reference Beeri, Schmeidler, Sano, Wang, Lally, Grossman and Silverman2006; Luck et al., Reference Luck, Pabst, Rodriguez, Schroeter, Witte, Hinz and Thiery2018) and to prevent biases arising from wide age ranges (Miller et al., Reference Miller, Himali, Beiser, Murabito, Seshadri, Wolf and Au2015). Neither the younger (79 years, n = 8) nor the older (85–91 years, n = 35) participants from the SENDA study were used here because the numbers were deemed too small to be representative. The sample was well balanced according to gender (99 males and 102 females) and included 122 highly educated (>12 years of education) compared to 79 less educated individuals (≤12 years of education). The corrected hearing and visual acuity status of participants were representative of independently living old-old adults. This sample incorporated impairments ranging from normal functioning to moderate, but excluded impairments that would inhibit independent living or activities of daily living. Table 2 contains additional sample characteristics.
Table 2. Sample characteristics for the total sample and subgroups according to gender and years education and results for ANOVAs with factor group

Note. Superscripts a-e denote significant (p < .05) differences between: Male > 12 years and Male ≤ 12 years (a), Females > 12 years and Females ≤ 12 years (b), Males > 12 years and Females > 12 years (c), Males > 12 years and Females ≤ 12 years (d), Males ≤ 12 years and Females > 12 years (e). MMSE =Mini-Mental Status Examination (Folstein et al. Reference Folstein, Folstein and McHugh1975), MoCA = Montreal Cognitive Assessment (Nasreddine et al., Reference Nasreddine, Phillips, Bedirian, Charbonneau, Whitehead, Collin and Chertkow2005), GDS = Geriatric Depression Score (15-item version, Gauggel & Birkner, Reference Gauggel and Birkner1999), SWL = Satisfaction with Life Scale (mean score, Diener, Emmons, Larsen, & Griffin (Reference Diener, Emmons, Larsen and Griffin1985), CCI = Charlson Comorbidity Index (Charlson, Pompei, Ales & MacKenzie, Reference Charlson, Pompei, Ales and MacKenzie1987).
* Health data was only available for n = 189 and all measures were self-reports.
Material
Sociodemographic variables
The sociodemographic variables age, gender, and years of education (including school and further professional education) were obtained via a short, structured interview prior to neuropsychological testing. Education was dichotomized into high level of education (>12 years of education) and low level of education (≤12 years of education) according to Welsh et al.’s (Reference Welsh, Butters, Mohs, Beekly, Edland, Fillenbaum and Heyman1994) classification system.
CERAD-NP
The extended CERAD-NP was carried out by trained staff and strictly followed the manual provided by the Memory Clinic Basel. This included the following tests: Verbal Fluency Animals and S-Words, Boston Naming Test, MMSE, Wordlist Learning, Recall and Recognition, Constructional Praxis Copying and Recall, Trail Making Test (TMT) A and B. Eighteen test scores were calculated from these tests (Table 3). The only change pertained to the presentation of visual stimuli for the Boston Naming Test (pictures) and the Wordlist Learning and Recognition (words). A custom-made LabView 2015 (National Instruments, Austin, TX, USA) script was used to present stimuli in the center of a screen (using the same size and font as the original stimuli) for standardized implementation.
Table 3. List of all CERAD-NP subtests including the name, description, and range of all outcome scores in order of testing (based on information from the German CERAD-NP manual (Memory Clinic Basel, 2005))
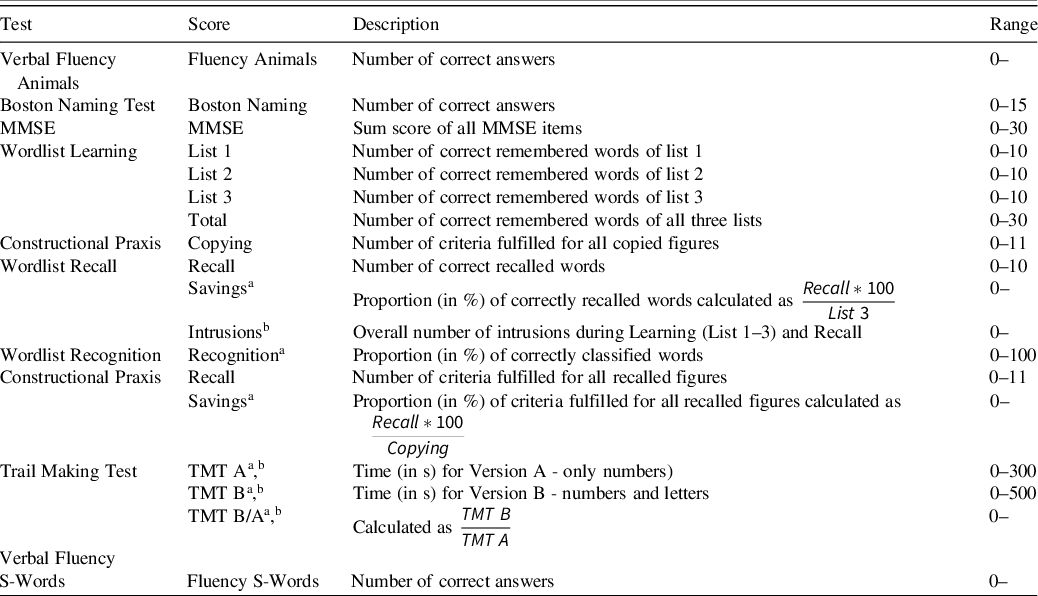
Note. If the upper limit of the range is missing, the test score does not have an explicit upper limit. MMSE = Mini-Mental Status Examination; TMT = Trail Making Test.
a The outcome is a continuous variable. All other scores are discrete variables.
b Greater test scores indicate worse performance. For all other scores greater test scores equal better performance.
Sensory testing
During testing, participants used the same aids (i.e., glasses and/or hearing devices) they normally use during everyday life. Corrected visual acuity was determined by the Freiburg Visual Acuity Test with Landolt C (Bach, Reference Bach1996). Participants sat three meters from the screen and completed 18 trials to obtain the logarithm of the minimum angle of resolution (logMAR). This parameter is a measure of visual acuity loss and logMAR scores from 0 to .5 are considered (near) normal vision, while higher scores are classified as low vision (.6–1.3) or blindness (≥ 1.4) (Colenbrander, Reference Colenbrander2002).
To quantify corrected hearing performance, one practice list (18) and three test lists (4, 14, 20) from the Freiburg monosyllabic test (part of the Freiburg speech test (Hahlbrock, Reference Hahlbrock1953)) were presented at four sound levels (35 dB, 47 dB, 24 dB, 53 dB) without background noise via headphones (SHARK ZONE H10 Gaming Stereo-Headset, Sharkoon Technologies GmbH, Germany). The same order was used for all participants and the number of correctly repeated words (out of 20) was recorded for each test list. The rate of understanding at the 24 dB sound level was calculated as a percentage because this list displayed the widest range (0–20) and greatest variance (SD = 5.17) of the test lists.
Statistical Analysis
The analysis was done with SPSS IBM Statistics Version 27 (IBM Corp., Armonk, NY, USA). For each CERAD-NP score, a 2 × 2 analysis of variance (ANOVA) with between-subject factors sex (male/female) and education (high/low) was used to determine whether normative data should be calculated for the whole sample or subdivided into different groups. The results indicated that only eight scores were not significantly influenced by either gender or level of education (Table 4). Therefore, all further analyses were done separately for the following groups: (1) males with >12 years of education, (2) males with ≤12 years of education, (3) females with >12 years of education, and (4) females with 12 ≤ years of education. Mean, standard deviation, minimum, maximum, skew, and kurtosis were calculated for each score, and distributions were tested for normality with Shapiro-Wilk tests.
Table 4. Results of the analysis of variance for the main effects of sex and education

Note. Test statistics for all Wordlist Learning scores, Wordlist Recall scores, TMT B, and TMT B/A are with (1,196) degrees of freedom. For all other scores, degrees of freedom were (1,197). The direction of the effect was the same for all significant effects. Females performed better than males and the high education group performed better than the less educated.
Percentile ranks (PR) for discrete test scores and percentiles (2.28, 6.68, 10, 15.87, 25, 50, 75, 90) for continuous test scores were calculated because the majority of variables were not normally distributed and therefore did not allow for the calculation of standard norms. Afterward, standard norm equivalents in the form of z-scores were calculated using area transformation (Lienert & Raatz, Reference Lienert and Raatz1998). The detailed steps are explained in the supplement. PR are only ordinal scales but can be easily interpreted for individual diagnostics, because they show how common an individual’s test score is (Crawford, Garthwaite, & Slick, Reference Crawford, Garthwaite and Slick2009). Z-scores are interval scales that can be used for group statistics and the interpretation of differences (Woerner, Müller, & Hasselhorn, Reference Woerner, Müller and Hasselhorn2017). In addition, they can be transformed into all other commonly used scales such as T or IQ scales by linear transformation.
In the final phase of analysis, multiple linear regression analyses for the whole sample were carried out with predictors age, gender, and years of education in a first step to control for these demographic variables. Visual acuity and hearing performance were then included as predictors for each CERAD-NP score in order to test whether they were related to performance beyond the effects of the demographic variables. Results were only reported when a significant R² change was obtained from including sensory predictors. Data from one participant were excluded because no visual acuity test data were available.
RESULTS
The ANOVA (Table 4) revealed that the highly educated group performed better at Fluency Animals, MMSE, Constructional Praxis Copying and Recall. There were trends in the same direction for TMT A and TMT B. In addition, females performed better than males in the Wordlist Learning task (List 2, 3, and Total), Wordlist Recall, TMT B, and Fluency S–words. A trend level effect in the same direction was found for performance in Fluency Animals, Wordlist Learning List 1, and TMT A. The results for females and males did not differ significantly for any other scores. Due to these results norms were reported stratified according to gender and level of education.
An overview of the performance in each test score and the distribution of the data in the normative sample can be obtained from Table 5. Data from one person were missing for TMT B because this person did not want to complete it. Data from another person were retrospectively excluded from the analysis for the tasks Wordlist Learning, Recall, and Recognition because a Wordlist Total score of 2 (the next worst score in the overall sample was 9) indicated a lack of motivation during the learning trials. The normative data (subdivided according to sex and education) are presented in detail for each CERAD-NP score in a separate table in the supplement. The data in each table are presented from worse to better scores for easier interpretation. The discussion includes an example of how to use these reference tables.
Table 5. Descriptive data of all CERAD-NP scores for each of the four norm groups

Note. Only data printed in bold are normally distributed according to Shapiro-Wilk test with α-level 0.05. Skew = Skewness, Kurt = Kurtosis, MMSE = Mini-Mental Status Examination, TMT = Trail Making Test.
a One person was rejected as an outlier for all Wordlist tasks and scores were calculated from N = 23.
b One person did not complete TMT B. The scores TMT B and TMT B/A were calculated from N = 46.
Influence of Hearing and Vision
For the majority of CERAD-NP scores (16 out of 18), performance was not related to either hearing or visual acuity. However, visual acuity predicted performance in TMT A and B (Table 6). In all cases, worse visual acuity (indicated by larger logMAR) was related to worse task performance (more time for TMT A and B). Hearing performance predicted only TMT B. Again, hearing loss (indicated by less correctly repeated words) was associated with deficits in task performance (more time for TMT B). The estimates for the regression coefficients are presented in Table 6 and can be used to derive practical implications. For example, an increase of 1 in the logMAR scale means the time needed for the TMT A increases by approximately 32 s and for TMT B by approximately 86 s.
Table 6. Hierarchical multiple linear regression analysis to show the influence of visual acuity and hearing on cognitive performance

Note. Only models, where inclusion of hearing and visual acuity significantly improved R² are included in this table. TMT = Trail Making Test.
a 0 = male, 1 = female.
b number of years.
DISCUSSION
This study aimed to present normative data for all scores derived from the extended CERAD-NP for a sample of nondemented adults between 80 and 84 years of age. The normative data were presented as PR for discrete scores and as percentiles for continuous test scores and can be used as a reference point for performance of the old-old taking into consideration sex and educational level. Moreover, the effect of visual acuity and hearing on test performance was studied and indicated good robustness towards corrected sensory impairments. Only performance in the TMT was shown to suffer from lower visual acuity.
As shown in many previous studies, the demographic variables education and sex significantly influence CERAD-NP performance (e.g., Beeri et al., Reference Beeri, Schmeidler, Sano, Wang, Lally, Grossman and Silverman2006; Kirsebom et al., Reference Kirsebom, Espenes, Hessen, Waterloo, Johnsen, Gundersen and Fladby2019). Higher levels of education positively bias the performance (D. Y. Lee et al., Reference Lee, Lee, Lee, Kim, Jhoo, Kim and Woo2004; Luck et al., Reference Luck, Pabst, Rodriguez, Schroeter, Witte, Hinz and Thiery2018; Welsh et al., Reference Welsh, Butters, Mohs, Beekly, Edland, Fillenbaum and Heyman1994). This was replicated in our sample and our highly educated group performed significantly better than the less educated group in the Fluency Animals, MMSE, Constructional Praxis Copying and Recall tests. The report of sex differences in CERAD-NP performance is not quite as one-sided, but seems to be more in favor of women performing better than their male counterparts of the same age (Beeri et al., Reference Beeri, Schmeidler, Sano, Wang, Lally, Grossman and Silverman2006; Luck et al., Reference Luck, Pabst, Rodriguez, Schroeter, Witte, Hinz and Thiery2018; McCurry et al., Reference McCurry, Gibbons, Uomoto, Thompson, Graves, Edland and Larson2001). Females in our sample also performed better than males in a number of scores encompassing a wide variety of cognitive functions (language skills, memory, and executive functions). Males did not score significantly better than women in any of the test scores. Taken together these findings support the use of education- and sex-specific norms in neuropsychological testing, which is already common practice.
The validity of the data set was examined by comparing it with other normative data sets. This is only possible to a limited extent as reports often differ with regard to the exact characteristics of the study sample and calculations of norm values (Woerner et al., Reference Woerner, Müller and Hasselhorn2017). Nevertheless, we used data from Luck et al. (Reference Luck, Riedel-Heller, Wiese, Stein, Weyerer and Werle2009) to evaluate our data because age and nationality of both studies matched. In general, good agreement was found between both study samples. Their categorization of educational level with three categories (high, medium, low) differed slightly from our dichotomous categorization (<12 years vs. ≥12 years). This dichotomous variable makes our data set comparable internationally (Beeri et al., Reference Beeri, Schmeidler, Sano, Wang, Lally, Grossman and Silverman2006; Nasreddine et al., Reference Nasreddine, Phillips, Bedirian, Charbonneau, Whitehead, Collin and Chertkow2005; Welsh-Bohmer, Gearing, Saunders, Roses, & Mirra, Reference Welsh-Bohmer, Gearing, Saunders, Roses and Mirra1997; Welsh et al., Reference Welsh, Butters, Mohs, Beekly, Edland, Fillenbaum and Heyman1994). Only the high and low education groups of Luck et al. (Reference Luck, Riedel-Heller, Wiese, Stein, Weyerer and Werle2009) were used for comparison as they had the most overlap with our groups. Scores available for comparison were: Fluency Animals, Wordlist Total, Wordlist Recall, Wordlist Recognition, and Wordlist Savings. Only the lower end of the data distribution was compared as this is decisive for the detection of impairments. Table 7 shows the highest score that is considered at least one standard deviation below the mean. The values were slightly higher in our sample with a 0–2 absolute point difference. One reason for this discrepancy could be the performance advantage of university-based samples compared to community-based samples, as this advantage remains even after controlling for educational level (Andel et al., Reference Andel, McCleary, Murdock, Fiske, Wilcox and Gatz2003). University-based samples include volunteers who sign up for longitudinal studies with multiple visits at the university (comparable to the SENDA study). In contrast, community-based samples are recruited directly in the community at senior centers (Andel et al., Reference Andel, McCleary, Murdock, Fiske, Wilcox and Gatz2003) or from primary care facilities (Luck et al., Reference Luck, Riedel-Heller, Wiese, Stein, Weyerer and Werle2009). Furthermore, these differences might be caused by the quality of education, an influencing factor on late-life cognition and health (Barba et al., Reference Barba, Garcia, Clay, Wadley, Andel, Davila and Crowe2021; Carvalho et al., Reference Carvalho, Tommet, Crane, Thomas, Claxton, Habeck and Romero2015). Although samples with the same educational level were compared, it is unclear whether the quality of education was also comparable. A second reason for this discrepancy might be the restricted age range (80–84 years) in our sample compared to the open-ended (> 80) category used by Luck et al. (Reference Luck, Riedel-Heller, Wiese, Stein, Weyerer and Werle2009), which resulted in a maximum participant age of 98 years. Including only a restricted age range decreases the risk of false-positive results for participants at the upper end of the age range. It has also been shown that even small differences in age can lead to significant differences in average performance (Beeri et al., Reference Beeri, Schmeidler, Sano, Wang, Lally, Grossman and Silverman2006; Miller et al., Reference Miller, Himali, Beiser, Murabito, Seshadri, Wolf and Au2015). For example, a group of 80–84 year-olds performed better than a group of 85–89 year-olds, which again differed from a group of 90–95 year-olds (Miller et al., Reference Miller, Himali, Beiser, Murabito, Seshadri, Wolf and Au2015).
Table 7. Highest score at least 1 SD below the norm for each group (comparison to Luck et al. (Reference Luck, Riedel-Heller, Wiese, Stein, Weyerer and Werle2009))

Note. M = male, F = female, High = educational level > 12 years of education, Low = educational level ≤ 12 years of education.
Comparison with an adjacent younger age group (75–79 years) from a recent population-based study in Germany (Luck et al., Reference Luck, Pabst, Rodriguez, Schroeter, Witte, Hinz and Thiery2018) further supported the validity of our data set. When comparing means and 1 SD cut-offs, the younger group performed better than the present sample (80–84 years) across most scores, which confirms the negative relationship between age and cognitive performance. For Boston Naming, MMSE, Constructional Praxis Copying, Constructional Praxis Recall, and Constructional Praxis Saving, these differences only had a range of one point. In all other scores, the differences were even more pronounced. For example, the performance of a highly educated woman would be considered one standard deviation below the mean in the Fluency Animals score if they named 19 or fewer animals according to Luck et al. (Reference Luck, Pabst, Rodriguez, Schroeter, Witte, Hinz and Thiery2018). In comparison, the age-appropriate data presented here suggest the same cut-off is at 16 points. This further illustrates the increased risk of false positives when a younger reference group is used, even when the age differences (in this case 75–79 vs. 80–84 years) are relatively small (Beeri et al., Reference Beeri, Schmeidler, Sano, Wang, Lally, Grossman and Silverman2006; Luck et al., Reference Luck, Pabst, Rodriguez, Schroeter, Witte, Hinz and Thiery2018; Miller et al., Reference Miller, Himali, Beiser, Murabito, Seshadri, Wolf and Au2015). An exception was the Fluency S-Words score where across all educational levels the older participants achieved slightly higher scores. It has been suggested that verbal fluency might be less affected by age because it reflects crystallized abilities like vocabulary and knowledge (Beeri et al., Reference Beeri, Schmeidler, Sano, Wang, Lally, Grossman and Silverman2006).
Last, the data were compared to norms of nondemented volunteers of the directly following age range (85–89 years) from a US study (Beeri et al., Reference Beeri, Schmeidler, Sano, Wang, Lally, Grossman and Silverman2006). It was expected that our sample would perform similarly or better because of their younger age. Comparing the highest score that was considered at or below the 10th percentile showed that for Boston Naming, MMSE, Wordlist Learning List 1, List 2, List 3, Total and Recall the values were either the same or within one point. For Fluency Animals, Constructional Praxis Copying, TMT A, and TMT B the differences were much more pronounced and always showed worse performance in the older age group. Somewhat surprising is the big drop-off in the Constructional Praxis Copying task (i.e., 10th percentile for highly educated males was ≤ 5 (Beeri et al., Reference Beeri, Schmeidler, Sano, Wang, Lally, Grossman and Silverman2006) vs. ≤8 in the SENDA sample). Considering that the testing of the older sample was carried out at participant’s homes instead of during lab visits, it is possible that more participants with movement restrictions (including fine motor impairments) were included.
Taken together, the comparisons presented above demonstrate that results from the SENDA study fit well into the previously published data. In addition, these findings are a valuable addition to the existing literature because they included all scores, instead of a small selection, and we provide clinically relevant percentiles (related to 1, 1.5, and 2.0 SD).
The following example illustrates how the normative tables provided in the supplement can be used in practice. For the sample case (woman, 83 years old, 14 years of education) the following performances were recorded: Wordlist Learning Total–17, Wordlist Savings–35%. The Wordlist Total score is discrete and, hence, the number of points (17) must be looked up in the first column. In the same row, we find a PR of 21.3% in the column “Female >12 years education,” which means that 21.3% of the reference sample scored the same or fewer points. This is also equal to a z-score of −.8, which indicates that the performance was below average but did not reach the −1.5 SD cut-off usually used to determine mild cognitive impairments. In contrast, the Wordlist Savings score is continuous and must be compared to the numbers given in the column “Female > 12 years education.” Looking for the closest number above the score reached (35%), we find 40%, which is equal to the 6.68th percentile and z = −1.50. From this, we know that less than 6.68% of the reference sample performed worse than the sample case and that this test performance is more than 1.5 SD below the reference average indicating impairment in recall performance.
A further argument for providing this new data set for individuals 80–84 years of age is that neuropsychological reference data are ideally kept up-to-date to deal with cohort effects and socio-environmental changes that can alter typical test performance (Dickinson & Hiscock, Reference Dickinson and Hiscock2011). The Flynn-Effect describes the phenomenon of generational gains in intelligence testing, which means that later-born cohorts typically have higher levels of fluid intelligence (Flynn, Reference Flynn1987; Skirbekk, Stonawski, Bonsang, & Staudinger, Reference Skirbekk, Stonawski, Bonsang and Staudinger2013). Similarly, it has been shown that the performance of OA in processing speed, language, executive function, and verbal memory tasks has improved across birth cohorts and that this trend could be ongoing in the future (Dodge et al., Reference Dodge, Zhu, Hughes, Snitz, Chang, Jacobsen and Ganguli2017; Skirbekk et al., Reference Skirbekk, Stonawski, Bonsang and Staudinger2013). Therefore, it is important to publish data shortly after data collection and to also include information about birth cohorts, as was done here. Using outdated references could potentially lead to missing cases of cognitive impairment or limit us to only being able to detect them later in the transition to disease.
Some limitations of this sample must be considered. Establishing the dementia-free status was based on self-report (no diagnosed dementia) and neuropsychological screening, but did not include a full clinical assessment. Therefore, the inclusion of as yet undetected cases of dementia cannot be completely ruled out. However, the number of such cases should be minimal because, in addition to the participant’s self-report of clinical diagnoses, performance in the MoCA was used to exclude such cases. Another potential limitation may arise because the birth cohort included in the sample (born between 1933 and 1939) grew up in Germany in the aftermath of World War II (1939–1945). This has been shown to have long-lasting effects on health and lifestyle into old age (Conzo & Salustri, Reference Conzo and Salustri2019; Havari & Peracchi, Reference Havari and Peracchi2017). In addition, all participants were current residents of Chemnitz and its surroundings and the vast majority of them lived in eastern Germany all their life. From this follows a very distinct difference in the socialization conditions during their working adulthood in the GDR (German Democratic Republic) compared to people who lived in the FRD (Federal Republic of Germany). This may result in the sample not being representative for the whole German population of this age group. Comparisons between East and West German OA have shown that East German women perform better in memory and fluid intelligence tests compared to their West German counterparts (Rupprecht, Reference Rupprecht, Martin, Ettrich, Lehr, Roether, Martin and Fischer-Cyrulies2000). It is assumed that this effect is caused by the higher rate of employment for women in the GDR (Rupprecht, Reference Rupprecht, Martin, Ettrich, Lehr, Roether, Martin and Fischer-Cyrulies2000). Beyond this, a bias during recruitment cannot be excluded, which probably favored more educated and healthier adults. The final limitation relates to sample size, sample sizes of N = 50–75 are considered a sufficient compromise between costs for data acquisition and generalizability for neuropsychological tests norms (Bridges & Holler, Reference Bridges and Holler2007). The group of men with less than 12 years of education is relatively small (n = 24) compared to the other groups, which all meet this recommendation. Other studies also reported problems finding enough male participants with a low educational level (Beeri et al., Reference Beeri, Schmeidler, Sano, Wang, Lally, Grossman and Silverman2006; Welsh et al., Reference Welsh, Butters, Mohs, Beekly, Edland, Fillenbaum and Heyman1994). As there are no current and complete reference values for this age group, this sample must still be considered a valuable expansion of the existing data.
Influence of Hearing and Vision
As a secondary outcome, we were also interested in whether CERAD-NP performance might be related to hearing ability and/or visual acuity, even in a sample of nondemented participants suffering from an age-typical decline in vision and/or hearing. The results indicate that most CERAD-NP subtests are robust regarding the age-related sensory loss found in an old-old age group. This reinforces the good practical application of the test battery. It should be considered that all participants were asked to use vision and hearing aids during testing. Hence, this does not mean that sensory performance per se is irrelevant for test performance. Rather it suggests that as long as no pathological visual or hearing impairments are present, the tasks can be conducted adequately.
Nevertheless, visual acuity predicted the TMT A, and TMT B scores in our sample. The TMT is a visual search paradigm, where 25 letters (TMT A) or 13 letters and 12 numbers (TMT B) are distributed over a sheet of paper and must be connected in the correct order. Hence, the negative effect of visual acuity loss (even when corrected) on performance time is not surprising. This is also in accordance with findings that patients with glaucoma performed worse in the TMT B (S. S. Lee, Wood, & Black, Reference Lee, Wood and Black2020). Therefore, the time needed to perform TMT A and B must be interpreted with caution. Fortunately, the third score TMT B/A, which is the quotient of both times, showed no relationship to visual acuity. As the visual search demands of both conditions are similar, the slowing in both due to visual impairments seems to cancel out. In addition, the TMT B/A was found to be a purer measure of executive functions (Arbuthnott & Frank, Reference Arbuthnott and Frank2010) and to be less susceptible to effects of demographics (Christidi, Kararizou, Triantafyllou, Anagnostouli, & Zalonis, Reference Christidi, Kararizou, Triantafyllou, Anagnostouli and Zalonis2015). In summary, this supports the utilization of the TMT B/A score.
Only a single score (TMT B) was associated with hearing ability, although less so than with visual acuity. Worse hearing performance was related to longer times needed for the TMT B. This relationship seems counterintuitive, as there is no hearing involved in solving this task. However, the TMT B is known to be one of the more difficult tasks involving a high cognitive load. As a result, a high number of participants with dementia are unable to complete it (Schmid et al., Reference Schmid, Ehrensperger, Berres, Beck and Monsch2014). Therefore, the relationship with hearing ability could be caused by fatigue, which, according to the effortfullness hypothesis, would be more severe in individuals with worse hearing as they would expend a lot more effort across the whole testing session understanding the oral instructions. The common cause hypothesis may also explain the relationship between hearing ability and task performance in tasks with no auditory stimuli (TMT B) indicating that the sensory and cognitive system were affected by the same neuropathological processes. In summary, lower sensory performance seems to be a concern for TMT performance, but the alternative scoring option (TMT B/A) can be used instead. It is noteworthy that all participants used glasses as needed and were, in general, considered to have normal to moderate-low corrected vision. The negative effects were present even though participants did not report any problems with the visual stimuli.
To conclude, this data set of nondemented individuals with an age between 80 and 84 years presents reference data for the application of the CERAD-NP in this age group in Germany and any population similar to the sample described here. The normative tables presented include all information required to easily evaluate test scores in comparison to the typical performance of this age group, while also taking into consideration sex and educational level. This will help improve the diagnostic process of dementia in old-old age because individuals that should be remitted for further diagnostics can be identified. In the future, these references will need to be supplemented by additional normative data sets that include individuals 85 years and older in order to cover the entire age spectrum for neuropsychological testing.
SUPPLEMENTARY MATERIAL
For supplementary material accompanying this paper visit https://doi.org/10.1017/S1355617721001284
FINANCIAL SUPPORT
This work was funded by the European Social Fund for Germany and the Sächsische Aufbaubank-Förderbank (SAB) of the Free State of Saxony (Project-Number: 100310502, address: Pirnaische Straße 9, 01069 Dresden, Germany).
CONFLICT OF INTEREST
The authors report no potential conflicts of interest.


 Open access