


Introduction
Family size – the number of children in the family – is a widely acknowledged but surprisingly little studied driver of child poverty in industrialized countries. Where family size has been the focus of empirical work, larger families are found to face a sharply increased risk of poverty (e.g. Bradshaw et al., Reference Bradshaw, Finch, Mayhew, Ritakallio and Skinner2006; Redmond, Reference Redmond2000). Family size also consistently emerges as a significant factor in studies concentrating on other determinants of poverty (e.g. Bárcena-Martín et al., Reference Bárcena-Martín, Blanco-Arana and Pérez-Moreno2018; Chzhen, Reference Chzhen2017) or on alternative conceptualisations (e.g. Edmiston, Reference Edmiston2021 on ‘deep poverty’).
What is largely missing from existing analysis is an account of how (and why) this additional risk has varied over time. The UK is an especially interesting context in which to explore this question because of the very substantial changes observed in overall child poverty over the last two decades. Child poverty fell from the late 1990s to the early 2010s, roughly converging with poverty among working-age adults in 2012/13, but has risen again since; by 2019/20 children faced a substantially higher poverty risk than either working-age adults or pensioners (IFS, 2021). How have children in larger families – defined here as those with three or more children – fared during this period compared to those in families with only one or two children? This paper fills the gap in evidence on this question by examining the changing risk of poverty through the lens of family size, while also exploring the factors contributing to differential trends. In doing so, it provides new evidence on poverty risk by family size and on the role of policy in altering the poverty risks faced by larger families, and makes a case for more attention to be paid to family size in poverty analyses.
There are three reasons why this is important. First, we contribute to a more fine-grained descriptive picture of the shape of child poverty in the UK. Given variation in average family size by religion and ethnicity, this can also help in understanding drivers of wider horizontal inequalities. Second, interrogating how families of different sizes have fared over time can uncover the consequences of particular policy strategies, with implications for policy debates in the UK and internationally. We focus in this paper on two key policy-related drivers – employment and social security – each of which may have had differential impacts depending on family size.
Third, more detailed and nuanced understanding of the socio-demographics of larger families and their changing poverty risk will inform contested debates about the state’s role in providing financial support for children (see Daly, Reference Daly2020 for a comparative analysis). These debates sometimes position children as a life-style choice, for adults to make if they have sufficient financial means. Alternatively, parenthood is seen as a fundamental part of the lifecourse, with state support essential in helping families smooth incomes over time to provide for children during temporary periods of dependency (Hills, Reference Hills2014). A further standpoint places children’s rights as central, with children’s needs trumping considerations about parental desert (Tidsall, Reference Tidsall2015). The empirical evidence presented in this paper cannot and does not attempt to adjudicate between these different and competing perspectives. But it does show how policies are frequently rooted in one of these perspectives, implicitly or explicitly, and the resultant implications for the poverty risk of different sizes of families.
This is particularly important given the extent to which ‘lifestyle choice’ narratives have increasingly dominated UK discourse around child poverty. Stigmatising representations of larger families as ‘benefit broods’ (Jensen and Tyler, Reference Jensen and Tyler2015) have been mobilised and amplified by politicians and the media to critique a supposed culture of ‘welfare dependency’, with rhetoric repeatedly creating and invoking a division between hard-working families making responsible decisions and ‘shirkers’ who avoid work at the taxpayer’s expense (De Benedictis et al., Reference De Benedictis, Allen and Jensen2017; Hills, Reference Hills2014). The denigration of ‘welfare’ has a long history (Welshman, Reference Welshman2007), but intensified under first the Conservative-Liberal Democrat Coalition (2010 – 2015) and then the Conservative majority government (2015-) (Harkins and Lugo-Ocando, Reference Harkins and Lugo-Ocando2016). By examining trends in demographics, employment and poverty, the paper helps to illuminate the extent to which these characterisations collide with lived realities.
We use data from the Family Resources Survey, a large nationally representative annual household survey of at least 19,000 households, to track trends in poverty and in the composition and characteristics of larger families over a 25-year period from 1994/95 to 2019/20. We ask three central questions: How have trends in poverty differed for larger and smaller families? What are the key factors that appear to explain the differences? And what can this tell us about the impact of different anti-poverty strategies?
We begin by considering the reasons that child poverty may be greater in larger families, detailing recent policy changes and how they may have affected families of different sizes during the period under analysis. We go on to examine trends in poverty rates by family size and then to explore the potential contribution of changes in socio-demographic characteristics, employment status and social security provision. These trends are presented graphically and through more formal decomposition analysis. We conclude with a discussion of the implications of our findings for child poverty reduction policy in the UK and more widely.
Conceptual and policy background
That families with more children face an increased risk of poverty in the UK has long been established. The earliest UK poverty surveys, by Charles Booth in the 1890s in London and Seebohm Rowntree (Reference Rowntree1902) in York, both pointed to the combination of low wages and large families as key to understanding poverty (Piachaud and Webb, Reference Piachaud, Webb, Glennerster, Hills, Piachaud and Webb2004). Rowntree highlighted the ‘life cycle of poverty’: his argument that wages did not take account of the changing consumption needs of families during their lifecourse, and were too low to meet the basic requirements of a family with several dependent children, was later picked up by Eleanor Rathbone (Reference Rathbone1940) as part of her case for family allowances. In the post-war period, Hilary Land (Reference Land1969) concluded that poverty amplified the disadvantages of living in a larger family, which included overcrowding and lower educational achievement. Land’s research was a pilot for early work by Peter Townsend, with his 1979 study finding that 61% of families with four or more children were living in poverty.
Alongside increased consumption needs, greater barriers to employment constitute a second factor potentially contributing to higher poverty risk among larger families; one which grew in relevance in the later part of the twentieth century, as dual-worker families became more common (Hick and Lanau, Reference Hick and Lanau2018). In the absence of accessible and affordable childcare, parents in larger families are temporarily less well-placed to maximise labour market earnings, especially when their children are young. This is both because having more children increases caring demands and because a larger family is more likely (by simple probability) to include a child of pre-school age.
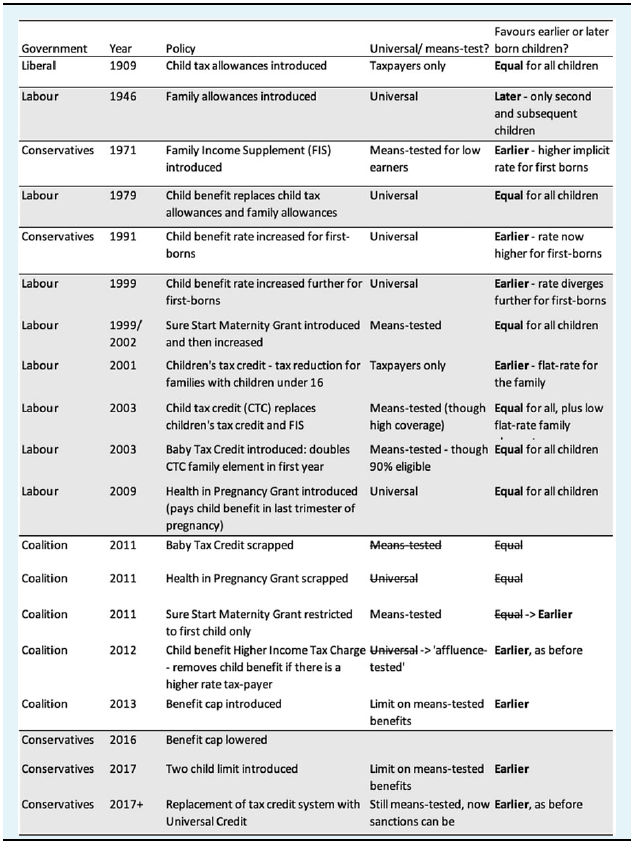
How far governments attempt to compensate for these heightened poverty risks will depend on how the state’s role in providing support for children is seen. Where the state takes a child rights or life-course approach we would expect greater compensatory efforts than if children are seen as a life-style choice to be made by parents at their own cost (Hills, Reference Hills2014). Most obviously, social security benefits can be structured to offer more, equal or less support per child depending on family size. Rathbone’s argument that larger families had greatest need for additional support was picked up in the design of family allowances when introduced in 1946: allowances were paid for second and subsequent children only. Bradshaw et al. (Reference Bradshaw, Finch, Mayhew, Ritakallio and Skinner2006) find this structure – support per child increasing with family size – reproduced in a number of countries including France and Germany. However, in the UK we find that the original family allowances (1946-1979) stand out as the only aspect of child-contingent support across a century that has favoured later-born children within the family, as is shown in Table 1. Some elements of support have been equal for all children in the family – like Child Benefit from the point at which this new universal per-child benefit replaced family allowances in 1979 until 1991. Other elements have been greater for earlier children – like Child Benefit since 1991, when the rate for first-borns was made more generous. But no policies since 1979 have explicitly favoured later-born children.
Table 1. Main changes in social security support affecting families with children under successive governments in the UK
Note:
Child tax allowances were first introduced in 1798 but abolished again in 1805 (Timmins, Reference Timmins2017).
Table 1 reveals a further shift in recent years away from equal per-child support towards policies that favour earlier-born children. The ‘two-child limit’ is the most striking such policy; for new births from April 2017, means-tested support is restricted to the first two children in the family only. The two-child limit is an extreme form of limiting support to larger families, but is reflective of a wider set of policies including the benefit cap as well as other cuts and restrictions that mean more generous support for smaller families.
In addition to the structure of benefits, a second feature is key to understanding how well larger families are supported: how generous the system is to children overall. Families with more children will be better protected where child-contingent support is more generous, even if this is not directly structured in a way that favours later-born children. Overall spending on child-contingent cash benefits doubled under Labour but was cut back again during the subsequent austerity years, especially from 2013 onwards (Lupton et al., Reference Lupton, Burchardt, Hills, Stewart and Vizard2016; De Agostini et al., Reference De Agostini, Hills and Sutherland2018; Cooper and Hills, Reference Cooper and Hills2021). In addition to the expansion and restriction of specific policies shown in Table 1, an important factor was the limited uprating of working-age benefits; in a departure from standard uprating with inflation, these were increased by only 1% from 2013-15 and then frozen in cash terms 2015-20 (De Agostini et al., Reference De Agostini, Hills and Sutherland2018; Bourquin et al., Reference Bourquin, Joyce and Keiller2020).
Third and finally, the policy focus placed on employment, and within that the extent to which policy to support employment takes account of the additional barriers larger families may face, are also relevant to understanding differential poverty risk by family size. Throughout the period covered in this paper, governments have emphasised paid work as the route out of poverty, using a combination of efforts to make work pay (through minimum wages, higher tax allowances and in-work subsidies); to make work easier (through childcare policies); and to make work a requirement (through benefit conditionality) (Gregg et al., Reference Gregg, Harkness and Smith2009; Daguerre and Etherington, Reference Daguerre and Etherington2014; Lupton et al., Reference Lupton, Burchardt, Hills, Stewart and Vizard2016). An emphasis on paid work in its own right need not penalise larger families, but it may do so if policies to increase returns from work replace policies to provide child-contingent benefits, because – as already underlined – wages do not adjust for family size. Further, larger families may be disadvantaged by a focus on paid work if the additional barriers they face are not addressed. While space here is limited, Table 2 briefly summarises key changes since 1997. This serves both to illustrate the extent of policy action in this space, and to show how larger families may be relatively disadvantaged by such efforts. The policy that gets closest to addressing parental barriers to work is childcare subsidies. Yet while free childcare provision for 3- and 4-year olds is available to all children (like school places), targeted childcare subsidies in the UK have consistently been lower for a second child than a first child, with no extra funding for additional children.
Table 2. Key developments in employment-focused policy in the UK since 1997

In sum, benefit policies in the UK have long tended to favour smaller rather than larger families, but this tendency has increased sharply since 2010. There have also been major changes in the overall generosity of benefit policy for children, which is likely to have affected families with more children most of all. And we have seen a consistent focus on employment as the response to child poverty, but without efforts to tackle the additional barriers to work faced by larger families. Our empirical analysis will explore how these changes have played out in terms of employment patterns and poverty rates.
Data and method
We use data from the Family Resources Survey (FRS), a nationally representative cross-sectional annual survey of private households in Great Britain (until 2001/02) and the full UK from 2002/03 (DWP, ONS and NatCen, 2021 and earlier editions). The FRS provides a continuous series back to 1994/95, convenient for this study because it covers both the Labour Government from 1997-2010 and the subsequent decade of Conservative-led administrations. Sample size varied between 24,000 and 29,000 households until 2011/12 and between 19,000 and 22,000 thereafter. Fieldwork for each wave is conducted between April of one year and March of the following year, to match the UK financial year.
The FRS is used to construct the Households Below Average Income (HBAI) dataset, which provides harmonised variables over time with a focus on living standards (DWP, 2021). Most of the analysis in the paper uses HBAI, with additional variables on adults’ education levels and hours worked merged in from the underlying FRS datasets. The income measure is weekly net (disposable) equivalised household income, comprising total income from all sources for all household members including dependants. For analysis of poverty based on market incomes, the measure captures weekly income excluding all state transfers and before direct taxes and national insurance contributions are deducted.
We use the widely accepted poverty threshold of 60% of median equivalised household income. This is consistent with the ‘at risk of poverty’ measure used as standard across EU member states and reflects our view, rooted in Townsend’s (Reference Townsend1979) definition, that poverty is a relative concept that must be measured in relation to living standards in contemporary society. We concentrate on a poverty measure based on income before housing costs are deducted (BHC); this was the headline UK target from 2003 until child poverty targets were scrapped in 2016. To show that the story is not driven by a particular choice of measure, an indicator for poverty after housing costs (AHC) is also shown at the outset, derived by deducting a measure of housing costs from the BHC income measure. An Appendix shows trends using a poverty line of 50% of the median and a fixed income poverty measure (60% of the 2010-11 median, BHC and AHC).
Supplied weights were applied throughout to adjust for non-response bias. For some analyses (identified in the figures), a 3-year or 5-year moving average was constructed to increase sample size and reduce noise. We treat the individual child as the unit of analysis throughout. Family size is measured within the ‘benefit unit’, defined as a single adult or married or cohabiting couple and any dependent children. Dependent children are individuals aged under 16, plus 16-19 year olds who are a) living with parents/a responsible adult; b) not living with a partner; and c) in full-time non-advanced education or unwaged government training. Larger families are those with three or more dependent children. Multi-family households are counted as multiple family units. Composite families are not distinguished from families where children live only with their own parents. Any child maintenance payments are included in pre-tax income. Income is measured before childcare costs, though childcare subsidies paid through the benefit system (through tax credits or Universal Credit, as in Table 2) are included in income. This means in-work poverty rates may be understated. An ‘after childcare costs’ poverty measure is not considered for space reasons and out of reservations about the quality of the relevant data.
The standard modified OECD scale is used for equivalisation. Given our focus on family size, the equivalence scale is important as it encapsulates assumptions about the needs of families of different sizes. The modified OECD scale assigns a value of 1 to the household head, 0.5 to each additional adult or child over 14, and 0.3 to younger children. The implied costs of a child here have been found to be too low when compared against consensual budget standards (Oldfield and Bradshaw, Reference Oldfield and Bradshaw2011; Hirsch et al., Reference Hirsch, Concialdi, Math, Padley, Pereira, Pereirinha and Thornton2021). We stick to the scale for simplicity, but it should be noted that our analysis is likely if anything to under-estimate poverty in larger compared to smaller families.
Much of the paper’s analysis draws on the interpretation of simple graphs but we also conduct some more formal decomposition analysis, following Sutherland et al. (Reference Sutherland, Sefton and Piachaud2003) and Brewer et al. (Reference Brewer, Goodman, Shaw and Sibieta2006). This allows us to decompose changes in the poverty rate over time into compositional changes (e.g. shifts over time in parental employment patterns) and changes in incidence (e.g. changes in the rate of poverty in households with a particular employment pattern), to reach more robust conclusions about the contribution of different factors. More detail on the formula used can be found in Appendix 1.
Results
Changes in child poverty by family size
Figure 1 documents changes in poverty risk by family size over the last 25 years, immediately revealing how far the aggregate child poverty trend has been driven by developments for households with three or more children. Measured BHC, the share of children in larger families living in poverty almost halved from 41% in 1996/97 to 22% in 2012/2013, while the rate of poverty in smaller families showed a more modest decline from 20% to 15%. Since 2013/14, the increase in poverty is concentrated almost entirely among larger families. Measured AHC, the differential trends are even more distinct: the poverty rate for children in smaller families has barely changed in 25 years, and it is hard to spot any difference between the Labour and Conservative-led periods. For larger families this is not the case. Measured either way, we see a converging of poverty rates by family size in the years to 2012/13, such that the risk of poverty for a child in a larger family is not much higher than in a small family at that point (indeed the confidence intervals overlap). Subsequently the gap opens back up, taking the risk of poverty attached to large family status back to where it was 20 years earlier.

Figure 1. Child poverty against a relative poverty line (60% median income) by family size.
Source: Authors’ calculations using HBAI 15th edition (DWP, 2021).
Note: Shaded areas show 95% confidence intervals.
Figures in Appendix 2 show that trends are very similar using a less generous relative poverty line (50% median). Against a fixed income line, held constant in real terms, we also observe convergence to 2012/13 followed by divergence, although in this case divergence is more muted and is driven by smaller increases for larger families alongside continued progress for smaller families.
Table 3 formalises the extent to which trends in overall child poverty over this period are due to changes in poverty among children in larger families. Children in larger families made up between one-quarter and one-third of the population through the time-period – 32% in 1996/97, 26% in 2012/13 and 29% in 2019/20. But nearly two-thirds of the fall in child poverty rate BHC is found to be due to changes in the risk of poverty in these families (5.7 percentage points out of the 9.1 percentage point drop), while over three-quarters of the increase in BHC child poverty since 2012/13 is concentrated in larger families (4.2 percentage points of the overall 5.5 percentage point rise). In comparison, compositional changes – a fall in the share of children living in larger families to 2012/13 and the subsequent rise to 2019/20 – make a very small contribution to overall child poverty change.
Table 3. Decomposing changes in child poverty by family size

Note: For decomposition formula, see Appendix 1. Darker shading highlights the change in the overall child poverty rate in percentage points in each period. Lighter shading shows the contribution to the total change made by changes in the incidence of poverty among larger families, also in percentage points.
Source: Authors’ calculations using the FRS.
As larger families are significantly more likely than smaller families to include a child under five, and as substantial changes in poverty risk have been documented by age of youngest child (Stewart and Reader, Reference Stewart and Reader2021), Figure 2 shows poverty rates split by age of youngest child in the family. The bigger divide appears to be family size rather than age of youngest, with substantial differences in trend by family size within both ‘older’ and ‘younger’ families. Being in a larger family is still the dominant risk factor here. Nonetheless, the steepest changes have been experienced by larger families with a young child: these families benefited most during the Labour decade and have seen the steepest rise since 2012/13. They now face a sharply elevated risk of poverty.

Figure 2. Poverty rates (children below 60% median equivalised income below housing costs) by age of youngest child in the family.
Source: Authors’ calculations using HBAI 15th edition (DWP, 2021).
Given that the first large cuts to social security benefits took effect around 2013 (De Agostini et al., Reference De Agostini, Hills and Sutherland2018), the shape of all the figures points towards social security changes as a plausible key driver of differential poverty trends. Before focusing on social security we consider other potential contributing factors: demographic composition and employment patterns.
Demographic composition
Within larger families there has been little change and no clear trend over time in the share living in families of different sizes. Most children in larger families have two siblings: this share has fluctuated between 66% and 70% of all children in larger families over the period, with 21-25% in families of four children, and 7-12% in families of five or more (Appendix 3). Similarly, there has been little change in patterns of family size by household structure. The share of children in a larger family who live with a lone parent has remained roughly the same as the share of children in smaller families since the late 1990s, between 20-25% (Appendix 4).
In contrast, average levels of parental education have shown substantial change over time. Figure 3 shows the age at which parents in the FRS completed their full-time education, a rough proxy for educational qualifications and the most consistent education measure available back to 1994/95. In 1994/95 the norm across family types was for parents to have left education before 18, with staying on to 21 or beyond the preserve of a small minority (the middle category, leaving at 18-20, is left out for parsimony). By 2019/20 the story is very different. Differences in the educational histories of parents in larger and smaller families are not dramatic, but children in smaller families are somewhat more likely to have parents who have stayed longer in education, and the gap has widened slightly, especially from around 2010. If absolute levels of education represent a route out of poverty, these changes should herald a reduced poverty risk for families of all sizes. But if it is relative education that matters, the figure suggests a slightly increased risk for children in larger families from 2010.

Figure 3. Age at which longest educated parent left full-time education (% children in larger and smaller families).
Source: Authors’ calculations using FRS 2019-20 and earlier editions (DWP, ONS and NatCen, 2021).
Note: ‘Longest educated’ parent refers to benefit units with two resident adults, and means the parent who left school at the greatest age. In lone parent families lone parent’s education is used.
There has also been a notable shift over time in the ethnic composition of children in larger families. Table 4 shows that children from some ethnic groups, notably Bangladeshi, Pakistani and Black children and those of mixed ethnicity, are much more likely to live in larger families than White children, while children of Indian and Chinese ethnicity are less likely to do so. Over time, larger families have become less common among all ethnic groups except the Black African/Caribbean and Mixed groups. But children in larger families are nonetheless increasingly likely to come from minority groups, reflecting the overall changing demographic of families in the UK: there has been an increase of around 75% in the share of all children coming from minority ethnic backgrounds, and this is true both for smaller families (up from 9% of the total in 2001/4 to 16% in 2017/20) and larger families (up from 16% in 2001/4 to 28% in 2017/20). We calculate below how far the changing ethnic make-up of larger families may itself have contributed to poverty trends (the answer is a negligible amount). However, the ethnic composition of larger families does mean that an increased risk of poverty among larger families has a disproportionate effect on children from some minority ethnic backgrounds, with implications for inequalities by ethnicity.
Table 4. Prevalence and composition of larger families by ethnicity

Source: Authors’ calculations using HBAI.
Note: Data goes back to the early 2000s when the ethnic categories collected changed in a way that makes it hard to construct a consistent series. Three-year averages are presented to smooth annual fluctuations. Small sample sizes prevent Black African and Black Caribbean being presented separately.
Changing employment rates
Labour market activation has been a core focus of government policies throughout the period covered in this paper, in part because of a belief in employment as the best route out of poverty (Daguerre and Etherington, Reference Daguerre and Etherington2014; Timmins, Reference Timmins2017). While the increasing phenomenon of in-work poverty has received growing attention (MacInnes et al., Reference MacInnes, Bushe, Tinson and Born2014; Hick and Lanau, Reference Hick and Lanau2018), the risk of poverty remains substantially higher for households with no adult in work than for those in paid employment (Bourquin et al., Reference Bourquin, Joyce and Keiller2020). Differences in labour market activity by family size are likely therefore to contribute to differential poverty risks, and potentially also to changes in risk over time.
We find substantial differences in employment rates and trends by family size. While employment rates have increased in both larger and smaller families, work intensity (the percentage of available hours worked) has generally risen more quickly in smaller than larger families. However, these changes do not map neatly onto changes in poverty, offering a satisfactory explanation for neither the fall in poverty nor the more recent rise.
Figure 4 shows employment patterns in couple and lone-parent households. Among couple families, employment rates have been rising across both family types. Nonetheless, children in smaller couple families remain much more likely to have both parents in work; indeed, two parents working full-time is rapidly becoming the most common working pattern in smaller families. Larger families remain most likely to have one adult in full-time work and one at home; the share where both parents work full-time has risen but remains relatively low. Trends for lone parent families are similar albeit more pronounced. Employment has increased for both groups, but lone parents in larger families remain much less likely to work full-time and more likely not to work at all. Work patterns for larger lone parent families at the end of the 25-year period are in fact not dissimilar to those for smaller lone parent families at the start.

Figure 4. Share of children with parents working particular patterns, by family size, couples (upper panel) and lone parents (lower panel) (3-year moving average).
Source: Authors’ calculations using HBAI 15th edition (DWP, 2021).
These figures inevitably group together families who work very different numbers of hours in practice. Figure 5 presents more granular detail on work intensity and how it has changed. We construct an indicator for each benefit unit capturing the share of available full-time working hours adults spend in paid work. ‘Full-time’ hours are set at 35 hours per adult, meaning a total of 70 hours available for a couple and 35 hours for a lone parent. It is therefore possible (and not uncommon) for families to work more than 100% of ‘full-time’. The figures show the distribution of children according to the amount of time worked by resident adults, from 0 (no paid work) through 1 (all adults full-time) and beyond. For readability, only three years are shown, with the middle year of 2012/13 chosen as the point at which poverty trends reversed.

Figure 5. Work intensity among larger and smaller families with children (hours worked as a share of ‘maximum’ available working hours, understood as 35 hours per adult).
Source: Authors’ calculations using FRS 2019-20 and earlier editions (DWP, ONS and NatCen, 2021).
Both panels show a substantial drop in the share of households where no-one is in work, as observed in Figure 4. But the story in relation to higher levels of work intensity is rather different. Among couple households (top panel) smaller families have pulled further ahead. The ‘shelf’ observed at the 0.57 point on the y-axis corresponds to the equivalent of a couple where one adult works 40 hours per week and one stays home. There have been steady increases in the share of smaller families working more than this amount, while for larger families there has been little change.
For lone parents (bottom panel), the ‘shelf’ corresponds to 16 hours work per week (the threshold for receipt of in-work support until Universal Credit reforms). The share of lone parents working at least this amount has risen in both smaller and larger families, with smaller families initially pulling ahead and larger families subsequently narrowing the gap. But at higher levels of intensity, e.g. three-quarters time, while we see increases across family size, change has been considerably greater among smaller families, as observed for couples.
In sum, while gaps in ‘worklessness’ are closing, larger families are being left relatively further behind in terms of higher levels of work intensity. Among couples, this represents very limited change in higher levels of intensity. For lone parents, gaps are opening up despite increases, especially in recent years, in those working at full intensity and beyond. The size of the remaining gap between smaller and larger families is worth noting. Looking at change over 25 years, and even over the last seven years, it is clear there is a very long way to go for larger families to reach the employment intensity of smaller ones, even were this to be a realistic or an appropriate objective. This is not surprising, of course, given the additional demands of care on these families.
If in recent years both employment and poverty rates have been increasing in larger families, it indicates a changing relationship between the two. That is indeed what we observe in Figure 6, which shows poverty rates by work intensity as well as family size. Children in lone parent and couple households are both included, and work intensity is grouped into four levels.

Figure 6. Poverty rates by family size and parents’ work status (children living below 60% equivalised median income BHC, three-year moving average).
Source: Authors’ calculations using HBAI 15th edition (DWP, 2021).
While work status remains strongly correlated with the risk of poverty, the additional risk attached to working less has not been stable over time. In the earlier period, the ‘good years’ to 2012/13, huge improvements are observed for families without work or working below 50% intensity, particularly for larger families, with poverty also falling for larger families where adults collectively work more than half-time but less than full-time. These mixed employment patterns are very common for larger families, as shown above, so the improvements in associated poverty risks will have contributed to bringing overall child poverty down. However, for larger families where all adults work full-time or more, and for smaller families where adults work at least 50%, the risk of poverty stagnated through the Labour years. After 2012/13, the poverty risk for larger families rose sharply in all parental work categories. Employment rates have risen, but the risk of in-work poverty has risen too.
Changing social security support
The story so far suggests the need to look at the role of social security support to understand trends in larger families’ poverty rates. We turn now to focus on this directly. Figure 7 shows the percentage point difference that taxes and transfers make to relative poverty rates for children in families of different sizes. Poverty rates for working-age adults with no children are also shown for comparison. The changing effectiveness of the tax-benefit system in relation to larger families is strikingly clear. In the late 1990s, taxes and transfers were reducing relative poverty by just over 10 percentage points for all three groups. By the early 2010s, this had increased to nearly 40pp for larger families, compared to around 16pp for smaller families, while for working-age adults without children, the tax-benefit system was making less difference than before. In the most recent six-year period, effectiveness diminished for all three groups, but most sharply for larger families. For both larger and smaller families, the patterns across the period bear a strong resemblance to the changes in poverty rates in Figure 1.

Figure 7. The impact of taxes and transfer on relative poverty rates (BHC) by family size.
Source: Authors’ calculations using HBAI 15th edition (DWP, 2021).
Figure 8 breaks down the impact by parents’ employment status, focusing on children in larger families only. The biggest effects, and changes, are for children in families with no adult in paid work or those where work intensity is low. But the tax-benefit system became steadily more effective up to the early 2010s in reducing poverty within households with higher work intensity too, including (though less rapidly) households where all adults work full-time. This figure suggests that, had other things remained equal, we would have seen a steeper decline in poverty over this period for households working between 50-100% of full-time than observed in Figure 6, as well as a decline in poverty for full-time working households. It seems that widening inequalities in market incomes were leaving even some households with full-time workers further behind, meaning the social security system had to work harder to keep up.

Figure 8. The impact of taxes and transfer on relative BHC poverty rates among larger families by employment status (three-year moving average).
Source: Authors’ calculations using HBAI 15th edition (DWP, 2021).
Note: Three-year moving average shown here to smooth fluctuations due to small sample sizes.
After the early 2010s, the story changed. Benefit cuts from that point affected households with no or limited paid work most severely, but the system also started to become less effective for households working more than 50%, with signs of a turnaround even for households working full-time. As we saw in Figure 6, this weakening of the redistributive power of the tax-benefit system is reflected in rising rates of poverty for working as well as out-of-work households. For most families, the two-child limit plays no part in this, as that policy was implemented only for babies born from April 2017; it is instead the consequence of more general social security cuts, not targeted at larger families.
The significance of tax-benefit changes in driving poverty trends is reinforced by the evidence in Figure 9. Pre-transfer poverty rates are found to have risen quite rapidly in recent years within larger working households, especially those working below full-time intensity. The heavy solid line shows the overall rate of pre-tax and transfer poverty. This has risen for larger families over the period, increasing the effort needed from the tax-transfer system just to keep poverty constant. However, note that this overall line is flat in the earlier years and at the end; looking back to Figure 4 these periods coincide with larger drops in ‘worklessness’ and increases in full-time work. Thus in these years movement into employment and longer hours appear to have offset the rising risk of poverty attached to any given work pattern, but this has not been the case in the years between.

Figure 9. Poverty rates pre-tax and transfers for children in larger and smaller families, by parents’ work status (three-year moving average).
Source: Authors’ calculations using HBAI 15th edition (DWP, 2021).
For smaller families, the picture is rather different. While poverty risk has increased slowly for families working at least 50%, the overall line is stable and even shows a recent fall. This indicates that throughout the period increases in work – movement from no work to a mixed pattern, or from a mixed pattern to full-time – have (at least) balanced out the higher risks associated with each pattern.
In sum, over the course of two decades and despite increases in employment, there has been a steady rise in the amount of lifting needed from the social security system. We know from the analysis above that the scope of the system was expanding in the first part of the period, though not always quickly enough to keep up with need. In the second part of the period, it has been doing less, creating a ‘double whammy’: growth in market income inequality and cuts to social security have been moving in the same direction, both pushing up poverty rates.
Decomposing poverty changes into composition and incidence
In this final section we present a simple decomposition which helps separate changes in poverty into ‘compositional’ and ‘incidence’ effects, following Sutherland et al. (Reference Sutherland, Sefton and Piachaud2003) and Brewer et al. (Reference Brewer, Goodman, Shaw and Sibieta2006). The compositional effect gives us an estimate of the change in the poverty rate which can be attributed to changes in the make-up of the population. For example, an increase in the share of children in larger families who are of Pakistani or Black ethnicity would, other things equal, mean a rise in the larger family poverty rate, as these families have a higher than average poverty risk. The incidence effect shows the contribution of changing risk (or incidence) of poverty within each group. The compositional and incidence effects combined add up to the total change in poverty (in percentage points) over the period. More detail on the calculation of these effects can be found in Appendix 1.
Figure 10 presents the story graphically, with Appendix 5 providing the detailed figures. Supporting the narrative developed in the paper so far, it is clear that only a very tiny share of the changes in poverty observed over the last 25 years can be attributed to compositional changes, with changes in poverty risk heavily dominating. Changes to family structure (i.e. lone parenthood) have been so slight as to be invisible in the figure. Changes in household work status (i.e. increases in employment rates) have made a small contribution towards reducing poverty in both periods, but have been easily outweighed by changes in the risk of poverty within categories, with these changing risks contributing an 18pp fall in the first period and a 17pp rise in the second. A similar story holds for parental education rates. The one type of compositional change that has placed upward pressure on poverty is the changing ethnic make-up of the population of larger families. Again, however, these effects are tiny in comparison to the contribution made by changes in the risk of poverty within particular ethnic groups.

Figure 10. Decomposing changes in child poverty in larger families into compositional and incidence effects (percentage point change).
Source: Authors’ calculations using HBAI 15th edition (DWP, 2021) and FRS 2019-20 and earlier editions (DWP, ONS and NatCen, 2021). Note: The first of the two periods starts in 2001/02 for ethnicity results (and not 1996/97 as for other factors), because of changes in ethnic categories that prevent a consistent series before that point.
Discussion
This paper explored child poverty in the UK over the last quarter century through the lens of family size. It revealed that changes in poverty rates since 1997 – both falling poverty risk to 2012/13 and increases since then – were highly concentrated in larger families. Over three-quarters of the rise in BHC poverty since 2012/13, and all the increase in poverty AHC, was due to increased poverty risk for children in larger families. Our analysis highlights the extent to which larger families’ vulnerability to poverty had grown even before the two-child limit and benefit cap took effect, underlining the need to monitor the effects of these policies in the future. It also shows the importance of bringing family size into poverty analyses to generate a clear picture of changes in poverty over time.
Recent trends also demand attention because of their implications for ethnic inequalities: children from Pakistani, Bangladeshi, Black and Mixed backgrounds are more likely than White children to grow up in a larger family and are therefore disproportionately affected by rising poverty risk.
We find that changes in poverty rates can be attributed overwhelmingly to changes in the generosity of social security support. Larger families were very significant beneficiaries of the expansion of social security provision for children under Labour, much more so than families with only one or two children. The extent to which this is the case might be seen as surprising, given that in the UK child benefits have only rarely explicitly favoured the needs of larger families, and not at all since 1991. However, three aspects of Labour policy worked in the interests of larger families. Policy was increasingly generous to children overall; it offered additional support to households with a very young child; and it targeted low household income, which meant more support was channelled to families working at lower intensity or not at all. Thus without structuring benefits to directly privilege families with more children (that is, without taking the precise measure advocated by Rathbone and incorporated into the original design of family allowances), Labour nonetheless addressed both of the reasons larger families need support – higher consumption needs and lower labour market earnings.
The rise in poverty in larger families that followed the 2010 change of government reflected a sharp change in policy direction. First, there was a steady reduction in the overall generosity of social security support, through low-to-zero uprating of working-age benefits from 2013-2020. Policy aimed at the same time to boost labour market income with higher minimum wages and an increase in the personal tax allowance, but the net effect most negatively affected those with higher needs and greater barriers to employment – larger families. Second, there were particular cuts to support for families with young children. Third, support for larger families was restricted directly, most obviously through the two-child limit and the benefit cap. It is striking that by 2019/20 there were no cash elements of the UK social security system that provided equal support to all children regardless of their position in the family; all remaining benefits were more generous to (or only available to) earlier children.
While these cuts and changes were made in the name of austerity and budget deficit reduction (De Agostini et al., Reference De Agostini, Hills and Sutherland2018), they can also be seen to reflect a difference between the Labour and Conservative-led administrations in the understanding of government’s role in support for children. We suggest they reveal a dominant view of children in current UK policymaking – and in particular the decision to have more than one or two children – as a life-style choice, to be made only by parents who can carry the cost at the time.Footnote 1 This contrasts both with an approach that centres children’s rights (see Daly, Reference Daly2020) and with one that sees parenting dependent children as a fundamental (and temporary) part of the lifecourse, with government financial support essential to help families smooth incomes over time (see Hills, Reference Hills2014). Future work could do more to draw out the changing assumptions underlying the shift in UK policy towards children, situating the UK’s approach in a comparative perspective (for a useful comparative typology, see Daly, Reference Daly2020).
Interrogating these assumptions is particularly important in light of political and public discourses that have routinely stigmatised larger families (Jensen and Tyler, Reference Jensen and Tyler2015; Tyler, Reference Tyler2020), both presenting them as financially dependent on the state and framing such dependence as problematic. Our results undermine the ‘benefit broods’ discourse by showing that parental employment rates are historically high and rising. But at the same time they make it clear that, for a period of the life-cycle, many households with children do indeed require additional support if they are to make ends meet. The framing of the state’s role and linked conceptualisation of what counts as ‘work’ is crucial to whether this is perceived and presented as a problem. Here, arguments for a valuing of care are especially pertinent (see Care Collective, 2020). Indeed, if ideas of contribution are widened to encompass reproductive and caring work (Skeggs and Loveday, Reference Skeggs and Loveday2012), then adults in larger families are potentially making the greatest contribution of all.
Our findings also highlight the limitations of an approach in which the state does less and relies on increases in parental education and employment to reduce poverty. We show that both education and paid work have increased over the last 25 years in larger and smaller families, and yet for larger families pre-tax and transfer poverty rates have also continued to rise, meaning ever more work for the tax-transfer system to do just to keep poverty constant. In part, this indicates structural inequalities in the labour market. But it also reflects changing norms about work-family balance that have implications for everyone in the context of a relative poverty line. Employment patterns in larger families remain a generation ‘behind’ smaller families, no doubt reflecting the greater demands of care where there are more (often younger) children in the family.
Better childcare policies offer part of the answer. Childcare subsidies in the UK do not favour larger families: the maximum means-tested amount available is capped at the same level for two or more children. Yet there are also limits to how far ‘more work’ can be an answer. The trends shown here encapsulate a paradox: while for any individual household, increasing work hours reduces poverty risk, at a macro level rising employment does not in itself reduce poverty overall. Social security transfers remain essential to poverty reduction for families with children, with no evidence that this is likely to change, however far work intensity increases. Our analysis shows that policies that reduce support and leave parents to provide for children on their own mean rising child poverty. It is a point that both Rowntree (Reference Rowntree1902) and Rathbone (Reference Rathbone1940) would have recognised, and one that remains true in the twenty-first century.
Supplementary material
To view supplementary material for this article, please visit https://doi.org/10.1017/S0047279422000952
Acknowledgments
This paper is an output from a wider project on Welfare Reform and Larger Families, funded by the Nuffield Foundation. The Nuffield Foundation is an independent charitable trust with a mission to advance social well-being. It funds research that informs social policy, primarily in Education, Welfare, and Justice. It also funds student programmes that provide opportunities for young people to develop skills in quantitative and scientific methods. The Nuffield Foundation is the founder and co-funder of the Nuffield Council on Bioethics and the Ada Lovelace Institute. The Foundation has funded this project, but the views expressed are those of the authors and not necessarily the Foundation. Visit www.nuffieldfoundation.org.
Competing interests
The author(s) declare none.


 Open access