


I. INTRODUCTION
Meglumine diatrizoate (combined with diatrizoate sodium and sold under the brand name Renografin-60 and Gastrografin, among others) is a common colorless liquid contrast agent used in radiography, commonly of the urinary tract and parts of the digestive system, and is administered orally or intravascularly (Geng et al., Reference Geng, Wu, Hu, Zhao, Fan, Zhao, Liao, Li, Xiang, Ma and Du2018). The systematic name (CAS Registry Number 131-49-7) is (2R,3R,4R,5S)-6-(methylammonium)hexane-1,2,3,4,5-pentol 3,5-diacetamido-2,4,6-triiodobenzoate. For children and adults, 660 mg/ml of meglumine diatrizoate is used with 100 mg/ml diatrizoate sodium as an injection and is named MD-76R by the FDA (Dizendorf et al., Reference Dizendorf, Treyer, Von Schulthess and Hany2002; FDA.gov, 2017). There are a number of possible side effects of MD-76R, including a decrease in urine production or blood in urine, burning sensation and pain during urination, dizziness, increased heart rate, and others (Mayo Clinic, 2022). The effect of nephrotoxicity due to meglumine diatrizoate and other contrast agents has also been presented, particularly in angioplasty and angiography (Berns, Reference Berns1989). A two-dimensional molecular diagram is shown in Figure 1.
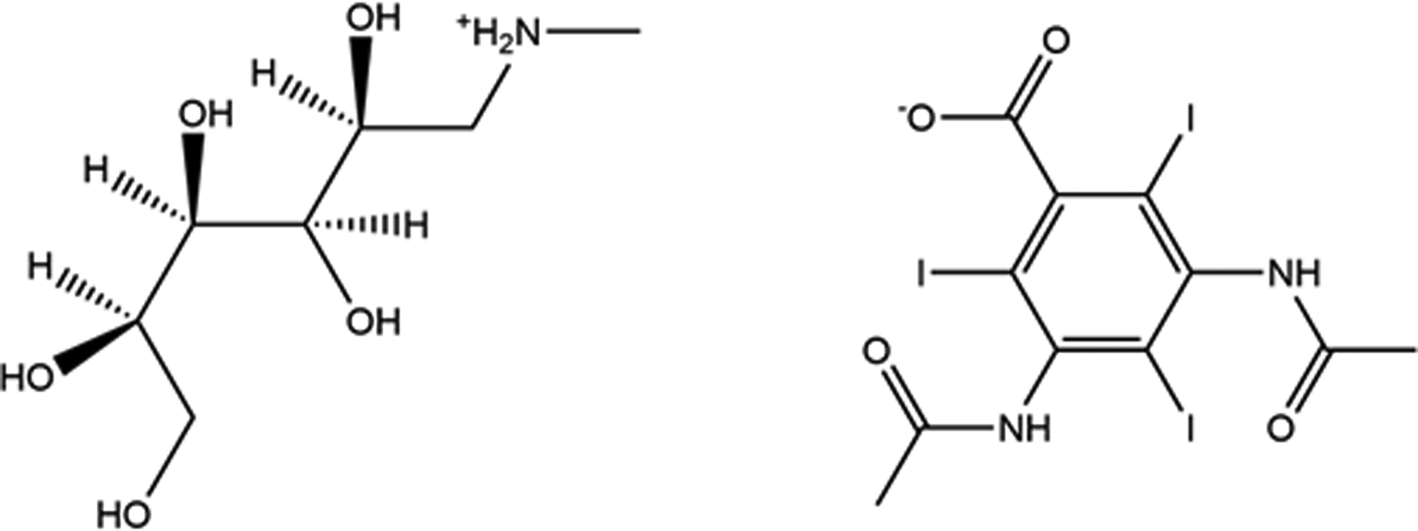
Figure 1. The 2D molecular structure of meglumine diatrizoate.
A connectivity search for the meglumine cation in the Cambridge Structural Database (Groom et al., Reference Groom, Bruno, Lightfoot and Ward2016) yielded two hits: meglumine (2R,4E)-7-chloro-4-(2-oxo-1-phenyl-3-pyrrolidinylidene)-1,2,3,4-tetrahydro-2-quinolinecarboxylic acid (Di Fabio et al., Reference Di Fabio, Alvaro, Bertani, Donati, Giacobbe, Marchioro, Palma and Lynn2002; HUTMAK) and (2S,3R,4R,5R)-2,3,4,5,6-pentahydroxy-N-methyl-1-hexanaminium 2-(2-methyl-3-(trifluoromethyl)anilino)nicotinate (Cao et al., Reference Cao, Sun and Pan2003; ILIQID). Similar searches for diatrizoic acid and its derivatives yielded crystal structures of the free acid (Fucke et al., Reference Fucke, McIntyre, Lemee-Cailleau, Wilkinson, Edwards, Howard and Steed2015; PUFJUX), several hydrates and solvates (Fucke et al., Reference Fucke, Howard and Steed2012; ECEZOD, ECEZUJ, ECIBAV; Fucke et al., Reference Fucke, McIntyre, Lemee-Cailleau, Wilkinson, Edwards, Howard and Steed2015; PUFGUU, PUFGUU01, PUFJIL, PUFJUX, PUFKEI, PUFKOS, PUFLAF, PUFLIN), several hydrated/solvated sodium salts (Najib et al., Reference Najib, Back and Edkins2017; CERRID, CERROJ, CERRUP, CERSAW; Fucke et al., Reference Fucke, McIntyre, Lemee-Cailleau, Wilkinson, Edwards, Howard and Steed2015; PUFHOP, PUFHOP01), and several lanthanide salts.
Meglumine diatrizoate is claimed as a component of oral contrast agents in US Patent 7,384,624 B2 (Raines, Reference Raines2008) and is described as useful in radiosurgery of tumors in US Patent Application 2004/0006254 A1 (Weil and Morris, Reference Weil and Morris2004). We are unaware of any published X-ray powder diffraction data on meglumine diatrizoate.
This work was carried out as part of a project (Kaduk et al., Reference Kaduk, Crowder, Zhong, Fawcett and Suchomel2014) to determine the crystal structures of large-volume commercial pharmaceuticals and include high-quality powder diffraction data for them in the powder diffraction file (PDF) (Gates-Rector and Blanton, Reference Gates-Rector and Blanton2019).
II. EXPERIMENTAL
Meglumine diatrizoate was a commercial reagent, purchased from Sigma (Batch #SLCJ2134), and was used as-received. The white powder was packed into a 1.5 mm diameter Kapton capillary and rotated during the measurement at ~50 Hz. The powder pattern was measured at 295 K at beam line 11-BM (Antao et al., Reference Antao, Hassan, Wang, Lee and Toby2008; Lee et al., Reference Lee, Shu, Ramanathan, Preissner, Wang, Beno, Von Dreele, Ribaud, Kurtz, Antao, Jiao and Toby2008; Wang et al., Reference Wang, Toby, Lee, Ribaud, Antao, Kurtz, Ramanathan, Von Dreele and Beno2008) of the Advanced Photon Source at Argonne National Laboratory using a wavelength of 0.458963(2) Å from 0.5 to 50° 2θ with a step size of 0.001° and a counting time of 0.1 s/step. The high-resolution powder diffraction data were collected using 12 silicon crystal analyzers that allow for high angular resolution, high precision, and accurate peak positions. A mixture of silicon (NIST SRM 640c) and alumina (NIST SRM 676a) standards (ratio Al2O3:Si = 2:1 by weight) was used to calibrate the instrument and refine the monochromatic wavelength used in the experiment. The beamline staff noted that the meglumine diatrizoate specimen changed slightly during the measurement.
The synchrotron diffraction pattern was indexed using N-TREOR (Altomare et al., Reference Altomare, Cuocci, Giacovazzo, Moliterni, Rizzi, Corriero and Falcicchio2013) on a high-quality primitive monoclinic unit cell with a = 10.74782, b = 6.49318, c = 18.53081 Å, β = 90.206°, V = 1293.2 Å3, and Z = 2. A reduced cell search of the Cambridge Structural Database (Groom et al., Reference Groom, Bruno, Lightfoot and Ward2016) with the chemistry C, H, I, N, and O only, yielded no hits.
The meglumine cation was extracted from the previously mentioned HUTMAK crystal structure using Materials Studio (Dassault Systèmes, 2021), and saved as a *.mol2 file. This file was converted to a Fenske–Hall Z-matrix using OpenBabel (O'Boyle et al., Reference O'Boyle, Banck, James, Morley, Vandermeersch and Hutchison2011). The diatrizoate anion was built using Spartan ‘18 (Wavefunction, 2020), saved as a *.mol2 file, and converted using the same tools as for the cation.
The structure was solved using Monte Carlo simulated annealing techniques as implemented in EXPO2014 (Altomare et al., Reference Altomare, Cuocci, Giacovazzo, Moliterni, Rizzi, Corriero and Falcicchio2013) and FOX (Favre-Nicolin and Černý, Reference Favre-Nicolin and Černý2002). Two different structures (structures 1 and 2) were obtained. Both had similar arrangements of heavy (non-H) atoms, but different apparent H-bonding patterns. We refined and optimized both structures. Although both structures refined to similar residuals (Rwp = 0.04566 and 0.04556 and goodness of fit (GOF) = 1.58 and 1.57 for structures 1 and 2, respectively), the (VASP) energy of structure 2 was 123.0 kJ/mol/cell lower in energy than that of structure 1, so is the one primarily discussed here.
Rietveld refinement was carried out using general Structure Analysis System (GSAS)-II (Toby and Von Dreele, Reference Toby and Von Dreele2013). Only the 1.0–30.0° portion of the pattern was included in the refinement (d min = 0.887 Å). All non-H bond distances and angles were subjected to restraints, based on a Mercury/Mogul Geometry check (Bruno et al., Reference Bruno, Cole, Kessler, Luo, Sam Motherwell, Purkis, Smith, Taylor, Cooper, Harris and Guy Orpen2004; Sykes et al., Reference Sykes, McCabe, Allen, Battle, Bruno and Wood2011). The Mogul average and standard deviation for each quantity were used as the restraint parameters. The restraints contributed 1.7% to the final χ 2. The hydrogen atoms were included in calculated positions, which were recalculated during the refinement using Materials Studio (Dassault Systèmes, 2021). The I atoms were refined anisotropically. The Uiso of the heavy atoms was grouped by chemical similarity. The Uiso for the H atoms was fixed at 1.3× the Uiso of the heavy atoms to which they are attached. No preferred orientation model was included in the refinement. The peak profiles were described using the generalized microstrain model (Stephens, Reference Stephens1999). The background was modeled using a six-term shifted Chebyshev polynomial, and a peak at 6.18° 2θ to model the scattering from the Kapton capillary and an amorphous component.
The final refinement of 141 variables using 29,047 observations and 76 restraints yielded the residuals Rwp = 0.0456 and GOF = 1.57. The largest peak (1.65 Å from O48) and hole (1.47 Å from I38) in the difference Fourier map were 0.37(9) and –0.41(9) eÅ−3, respectively. The largest errors in the difference plot (Figure 2) are in the shapes of some of the low-angle peaks, perhaps reflecting the specimen changes noted by the beamline staff.
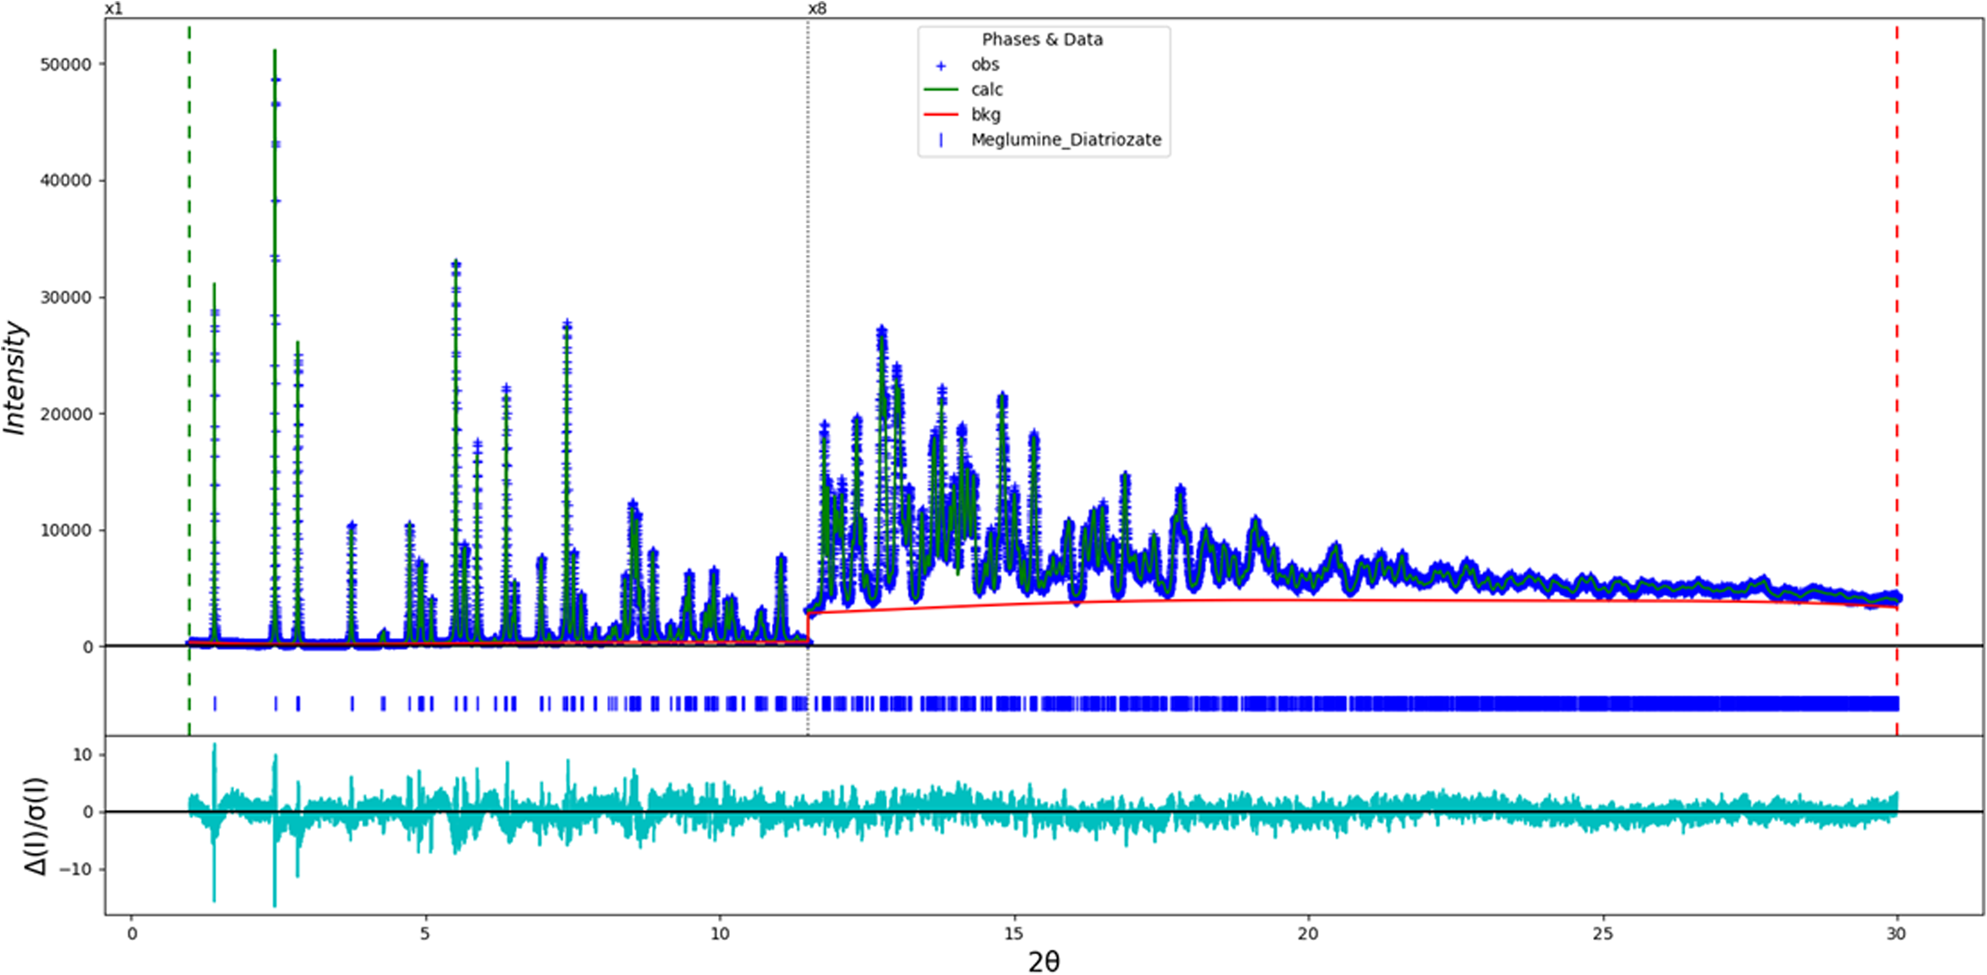
Figure 2. The Rietveld plot for the refinement of meglumine diatrizoate. The blue crosses represent the observed data points, and the green line is the calculated pattern. The cyan curve is the normalized error plot, and the red line is the background curve. The vertical scale has been multiplied by a factor of 8× for 2θ > 12.0°.
Both structures of meglumine diatrizoate were optimized (fixed experimental unit cell) with density functional techniques using VASP (Kresse and Furthmüller, Reference Kresse and Furthmüller1996) through the MedeA graphical interface (Materials Design, 2016). The calculations were carried out on 16 2.4 GHz processors (each with 4 Gb RAM) of a 64-processor HP Proliant DL580 Generation 7 Linux cluster at North Central College. The calculation used the generalized gradient approximation (GGA)-Perdew-Burke-Ernzerhof (PBE) functional, a plane wave cutoff energy of 400.0 eV, and a k-point spacing of 0.5 Å−1 leading to a 2 × 2 × 1 mesh, and took ~19 (structure 1) and 10 (structure 2) hours. Single-point density functional calculations (fixed experimental cell) and population analysis were carried out using CRYSTAL17 (Dovesi et al., Reference Dovesi, Erba, Orlando, Zicovich-Wilson, Civalleri, Maschio, Rérat, Casassa, Baima, Salustro and Kirtman2018). The basis sets for the H, C, N, and O atoms in the calculation were those of Gatti et al. (Reference Gatti, Saunders and Roetti1994), and for I was that of Laun and Bredow (Reference Laun and Bredow2022). The calculations were run on a 3.5 GHz PC using 8 k-points and the B3LYP functional and took ~2.8 h.
III. RESULTS AND DISCUSSION
Two different crystal structures of meglumine diatrizoate, which yielded essentially identical refinement residuals and positions of the non-H atoms, were obtained. The orientations of four of the five hydroxyl groups (O1, O2, O3, and O4) in the meglumine cation differ between the two structures (Figure 3). Some of the atoms have different names in the two structures. There is an additional complication in describing the structures. The chemical connectivity of the anion exhibits two-fold rotational symmetry, but the atom names are arbitrary. Superposition of the anions of the two structures (Figure 4) reveals that the structure solutions oriented the anions differently, so that chemically-equivalent atoms bear different atom numbers in the two structures. The DFT calculations indicated that structure 2 was significantly lower in energy, so is preferred and the one on which this discussion concentrates.
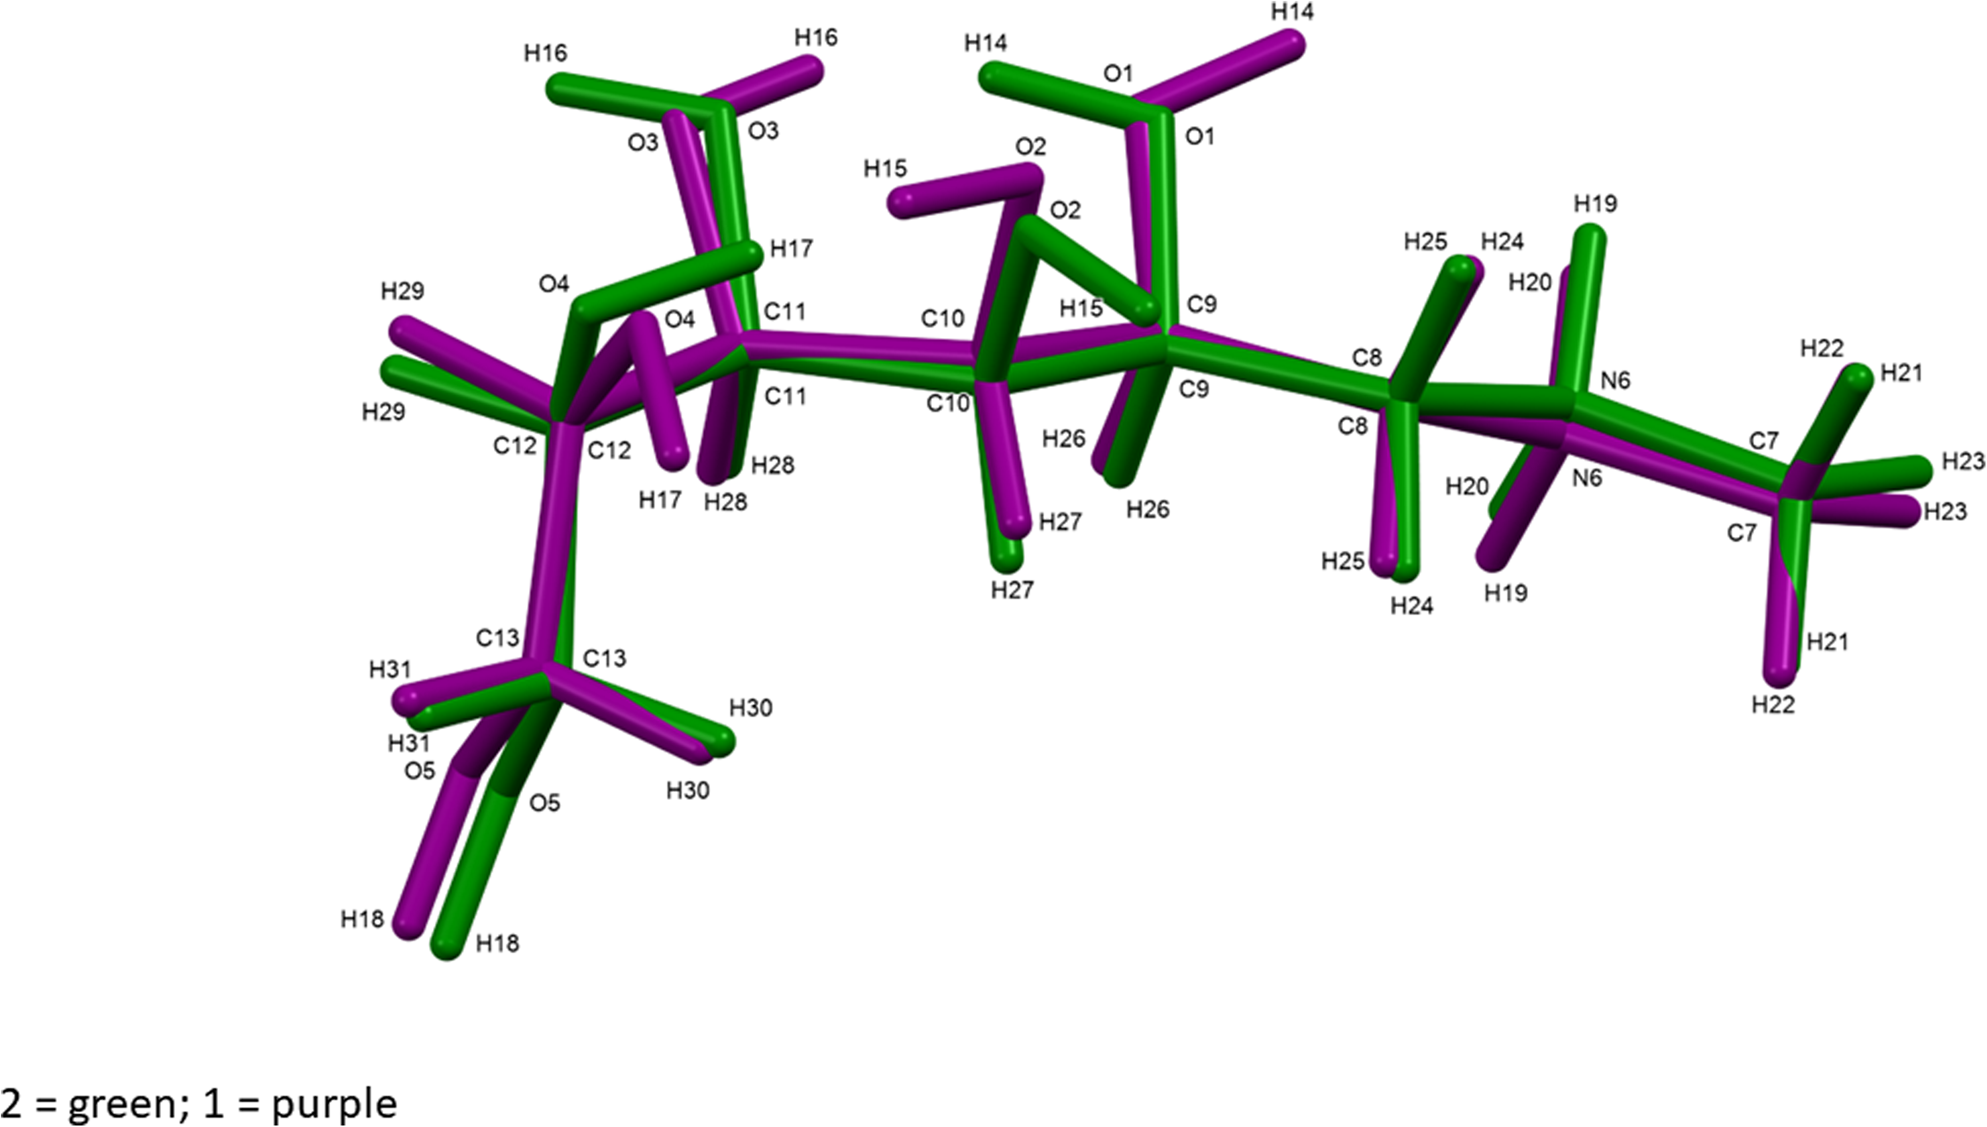
Figure 3. Comparison of the structure of the cation in the correct (low-energy) structure (green) and the incorrect (high-energy) structure (purple). Image generated using Mercury (Macrae et al., Reference Macrae, Sovago, Cottrell, Galek, McCabe, Pidcock, Platings, Shields, Stevens, Towler and Wood2020).
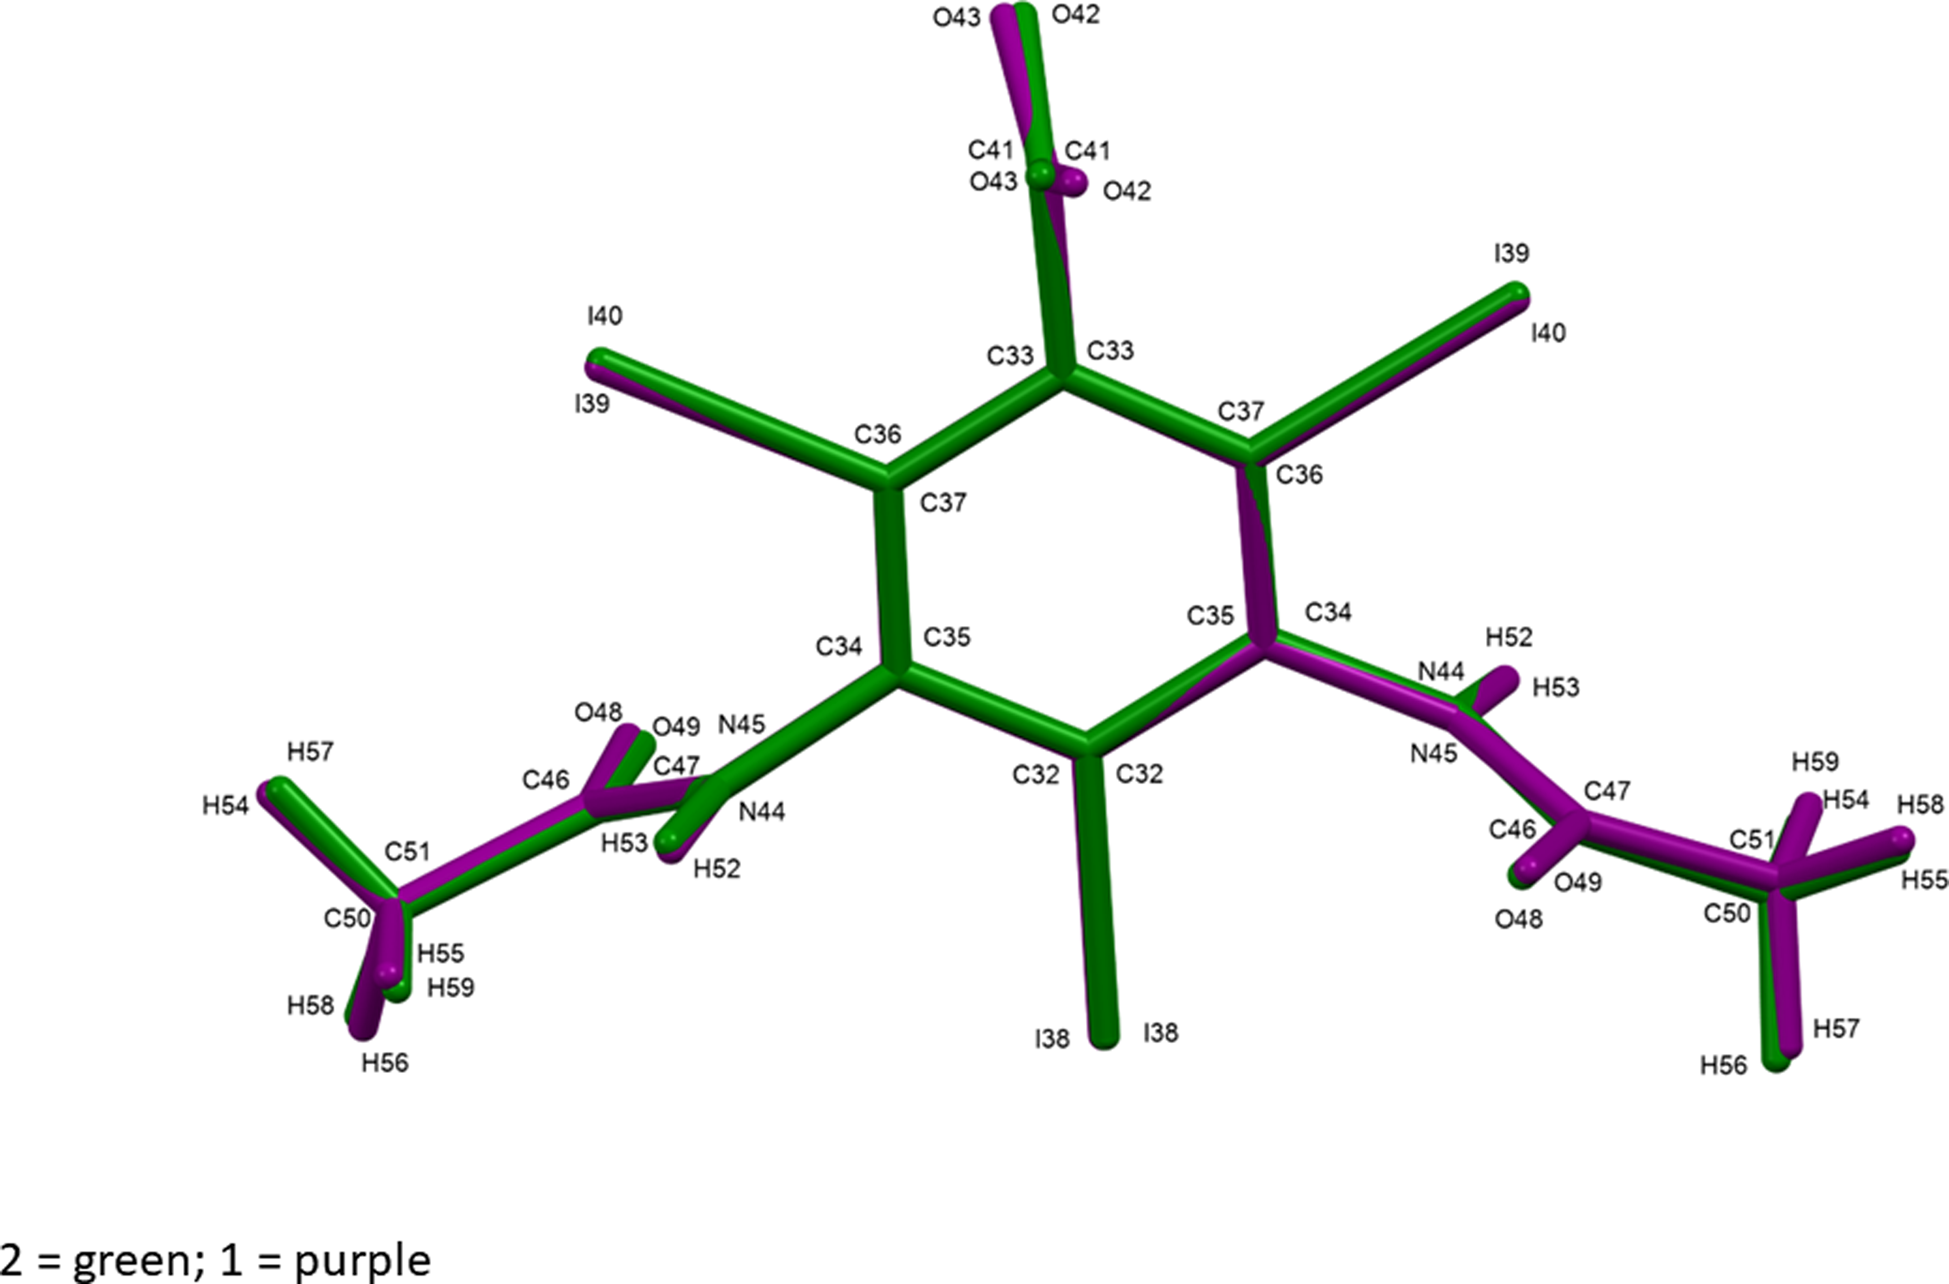
Figure 4. Comparison of the structure of the anion in the correct (low-energy) structure (green) and the incorrect (high-energy) structure (purple). Image generated using Mercury (Macrae et al., Reference Macrae, Sovago, Cottrell, Galek, McCabe, Pidcock, Platings, Shields, Stevens, Towler and Wood2020).
The root-mean-square Cartesian displacement between the Rietveld-refined and DFT-optimized cations is 0.084 Å (Figure 5). The maximum deviation is 0.114 Å, at the methyl group C7. The similar quantities for the anion are 0.053 Å (Figure 6) and 0.100 Å, at C47. The excellent agreement is well within the normal range for correct structures (van de Streek and Neumann, Reference van de Streek and Neumann2014) and provides strong evidence that the refined structure is correct. The asymmetric unit (with atom numbering) is illustrated in Figure 7.
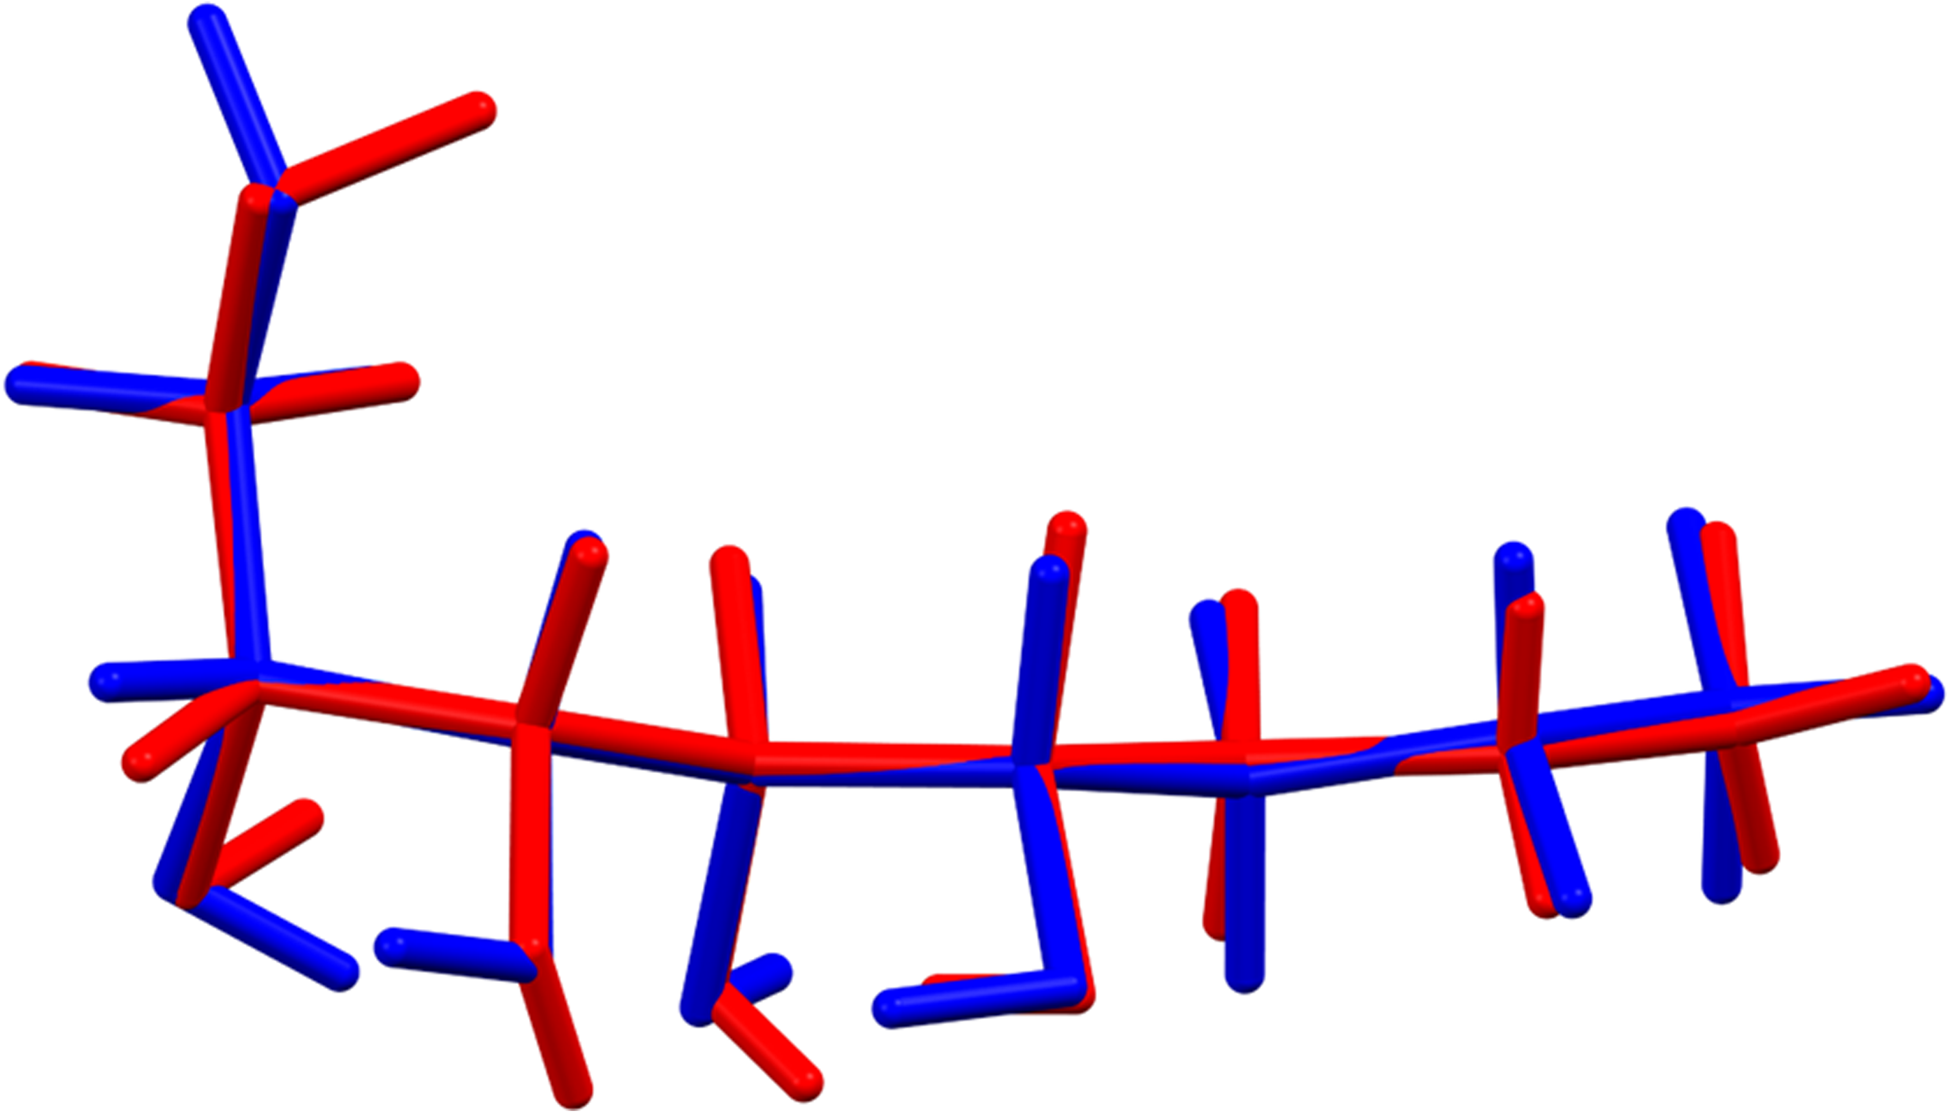
Figure 5. Comparison of the Rietveld-refined (red) and VASP-optimized (blue) structures of the meglumine cation. The rms Cartesian displacement is 0.084 Å. Image generated using Mercury (Macrae et al., Reference Macrae, Sovago, Cottrell, Galek, McCabe, Pidcock, Platings, Shields, Stevens, Towler and Wood2020).
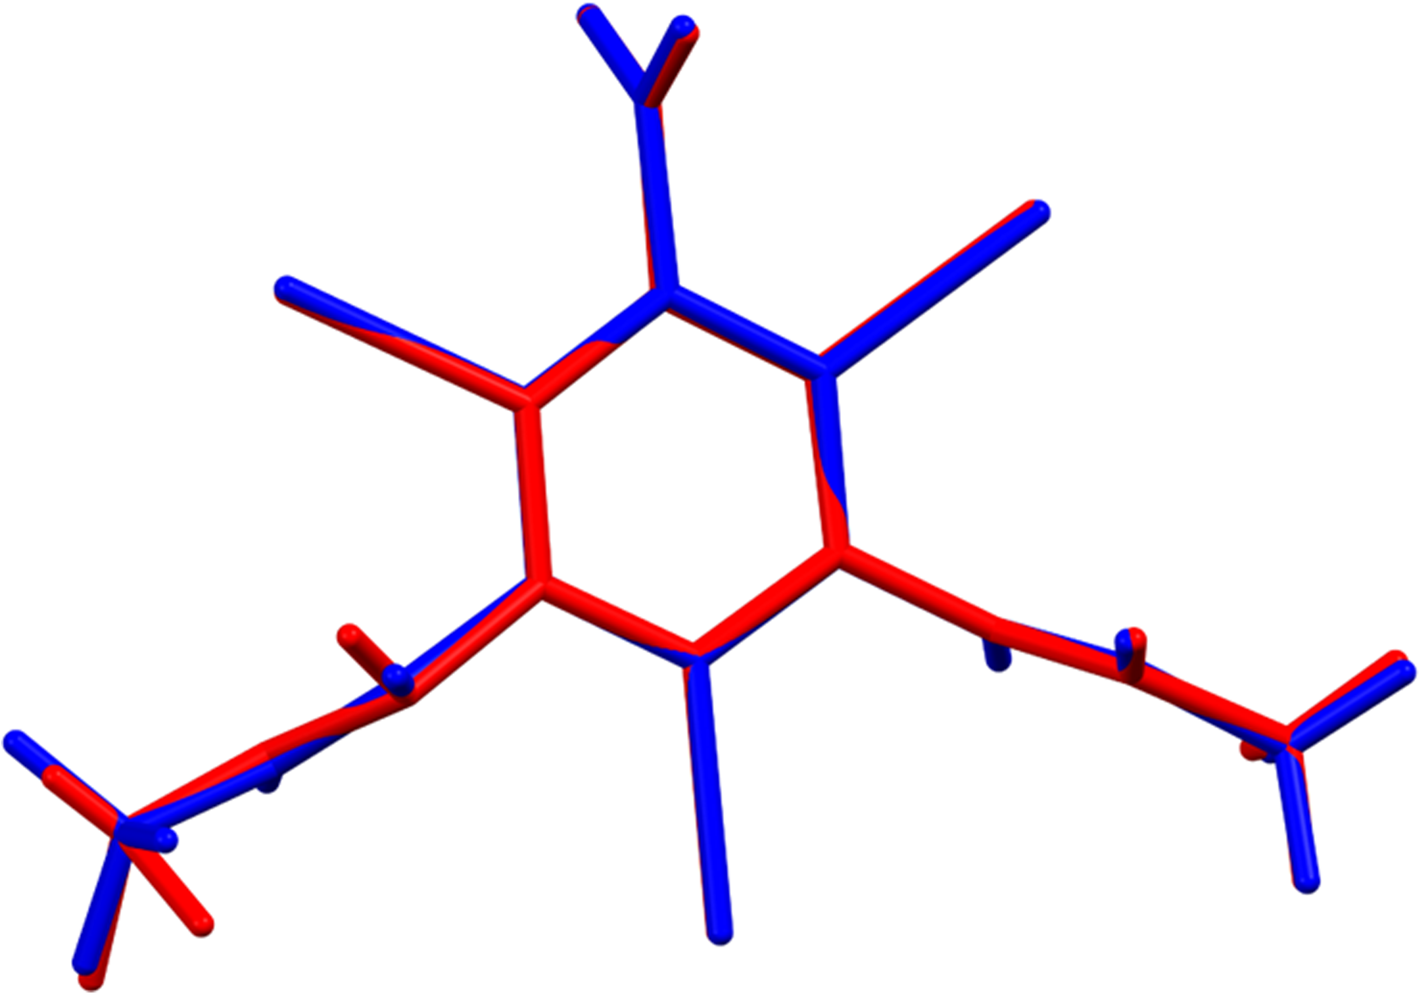
Figure 6. Comparison of the Rietveld-refined (red) and VASP-optimized (blue) structures of the diatrizoate anion. The rms Cartesian displacement is 0.053 Å. Image generated using Mercury (Macrae et al., Reference Macrae, Sovago, Cottrell, Galek, McCabe, Pidcock, Platings, Shields, Stevens, Towler and Wood2020).
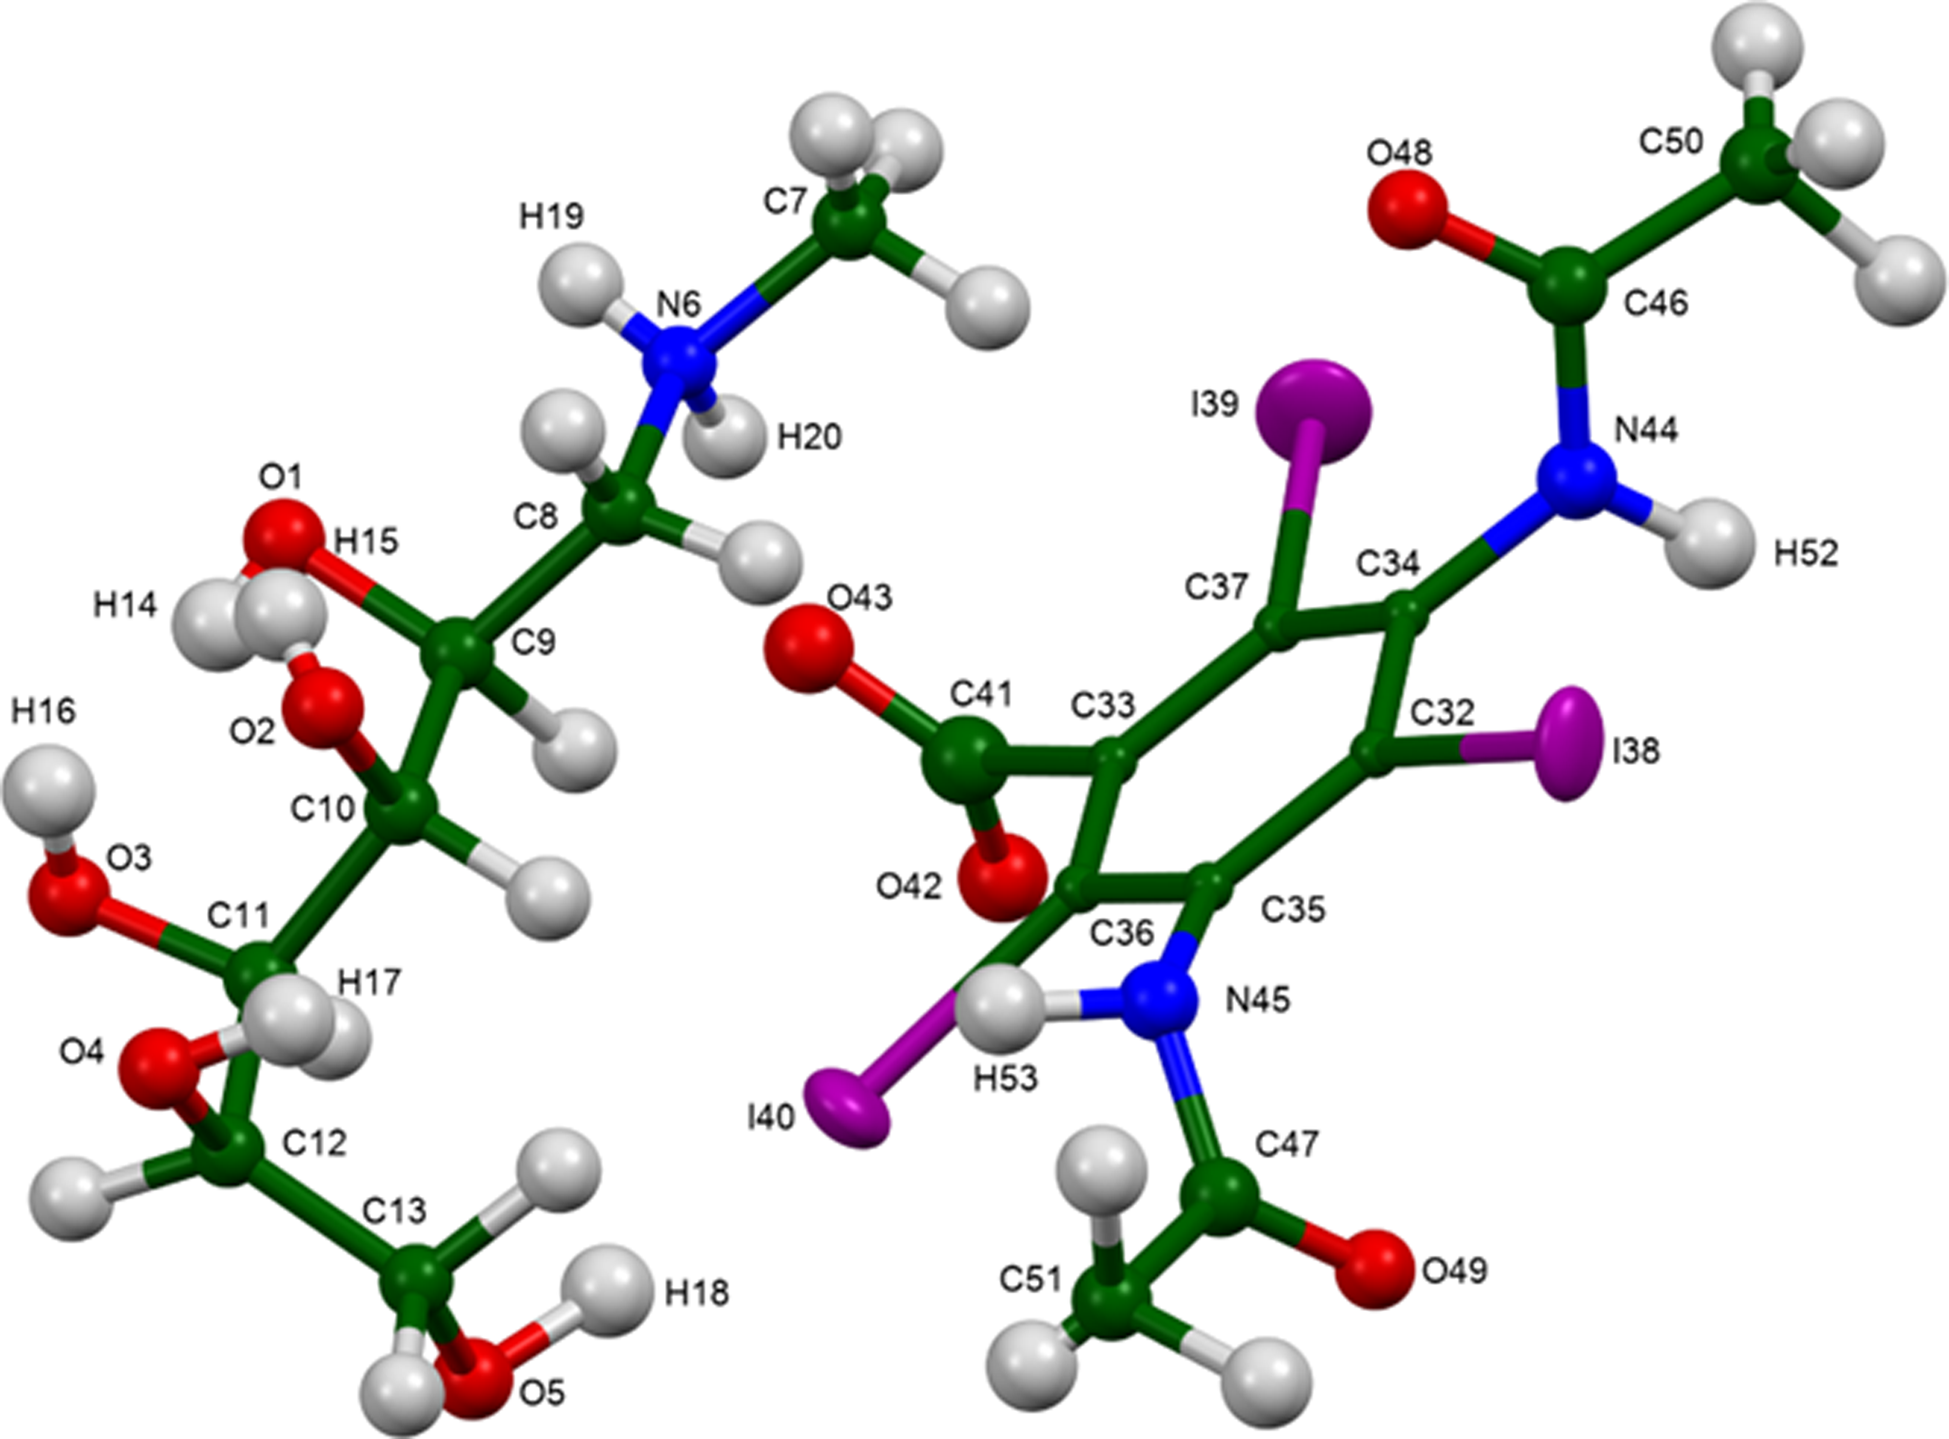
Figure 7. The asymmetric unit of meglumine diatrizoate, with the atom numbering. The atoms are represented by 50% probability spheroids/ellipsoids. Image generated using Mercury (Macrae et al., Reference Macrae, Sovago, Cottrell, Galek, McCabe, Pidcock, Platings, Shields, Stevens, Towler and Wood2020).
The best view of the crystal structure is down the short b-axis (Figure 8). The crystal structure consists of alternating double layers of cations and anions along the c-axis. The hydrogen bonds (discussed below) link the cations and anions into a three-dimensional framework. The mean planes of the phenyl rings in the two anions in the unit cell are 3,3,10 and 3,-3,10. The Mercury Aromatics Analyser indicates only two weak interactions with distances of 6.49 and 7.14 Å between the phenyl rings of the anions.
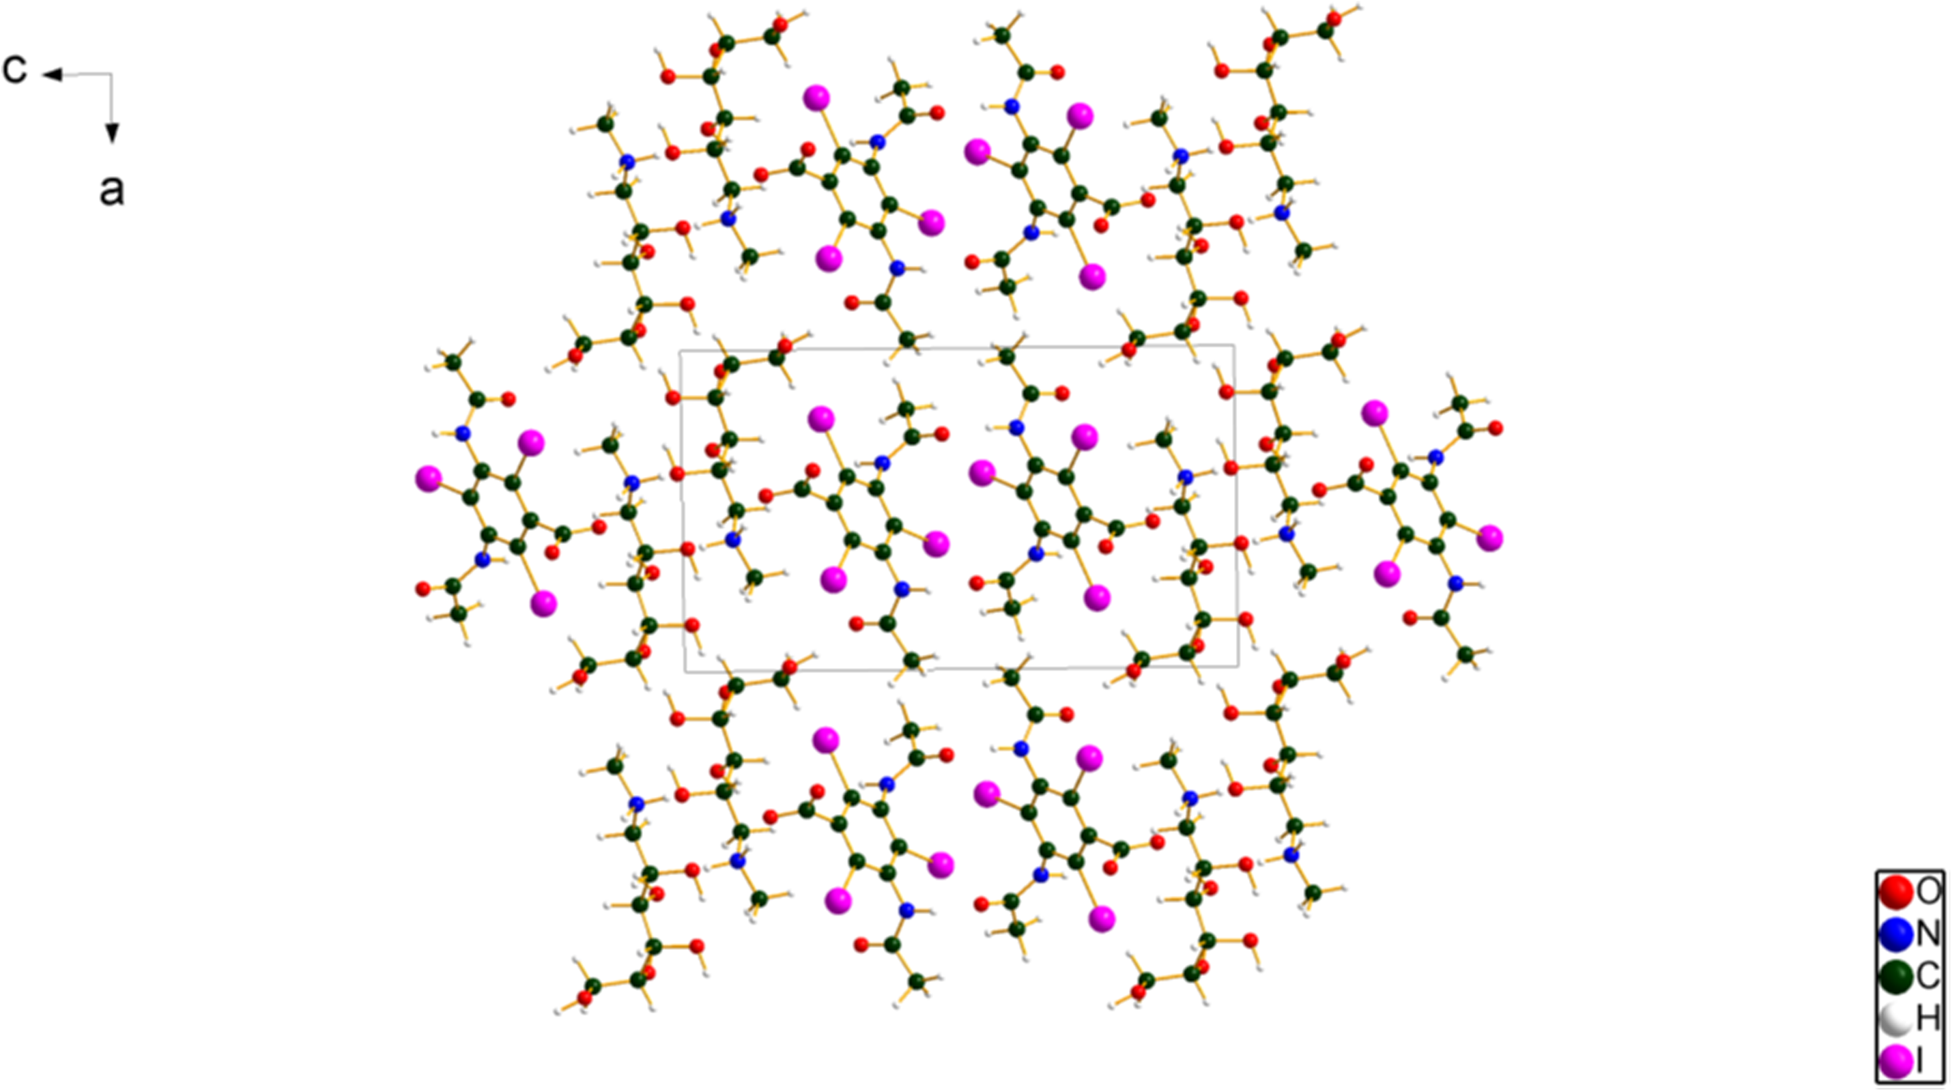
Figure 8. The crystal structure of meglumine diatrizoate, viewed down the b-axis. Image generated using Diamond (Crystal Impact, 2022).
All of the bond distances, bond angles, and torsion angles fall within the normal ranges indicated by a Mercury Mogul Geometry check (Macrae et al., Reference Macrae, Sovago, Cottrell, Galek, McCabe, Pidcock, Platings, Shields, Stevens, Towler and Wood2020). Quantum chemical geometry optimization of the isolated cation and anion (DFT/B3LYP/6-31G*/water) using Spartan ‘20 (Wavefunction, 2022) indicated that the observed conformation of the cation is close to a local minimum. The global minimum-energy conformation of the cation differs significantly (Figure 9), and is 41.7 kJ/mol lower in energy. The observed conformation of the anion is very close to a local minimum. The global minimum-energy conformation of the anion is 20.7 kJ/mol lower in energy, and has a very different conformation (Figure 10). The differences are mainly in the conformations of the amide side chains. The differences indicate that intermolecular interactions are important in determining the solid-state conformation.
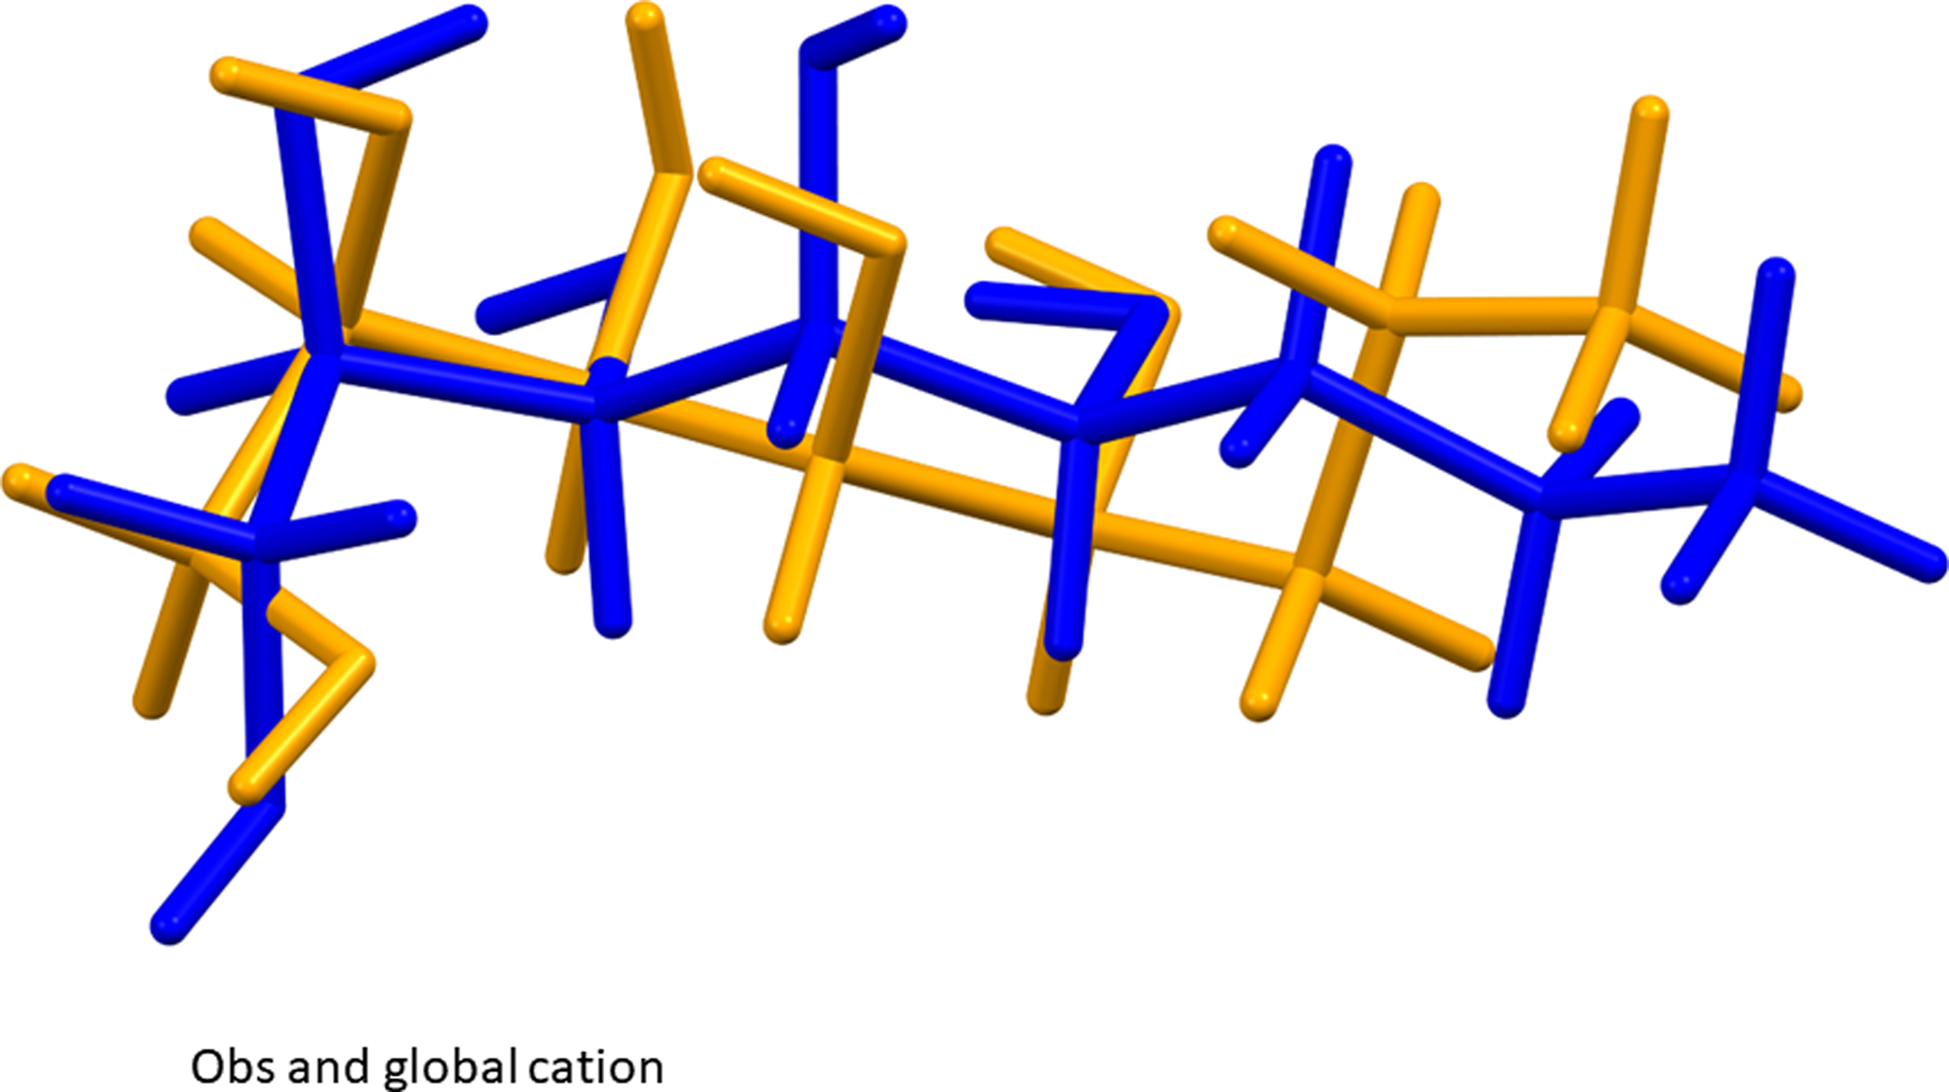
Figure 9. Comparison of the observed structure of the meglumine cation (blue) to the global minimum-energy conformation (orange). Image generated using Mercury (Macrae et al., Reference Macrae, Sovago, Cottrell, Galek, McCabe, Pidcock, Platings, Shields, Stevens, Towler and Wood2020).
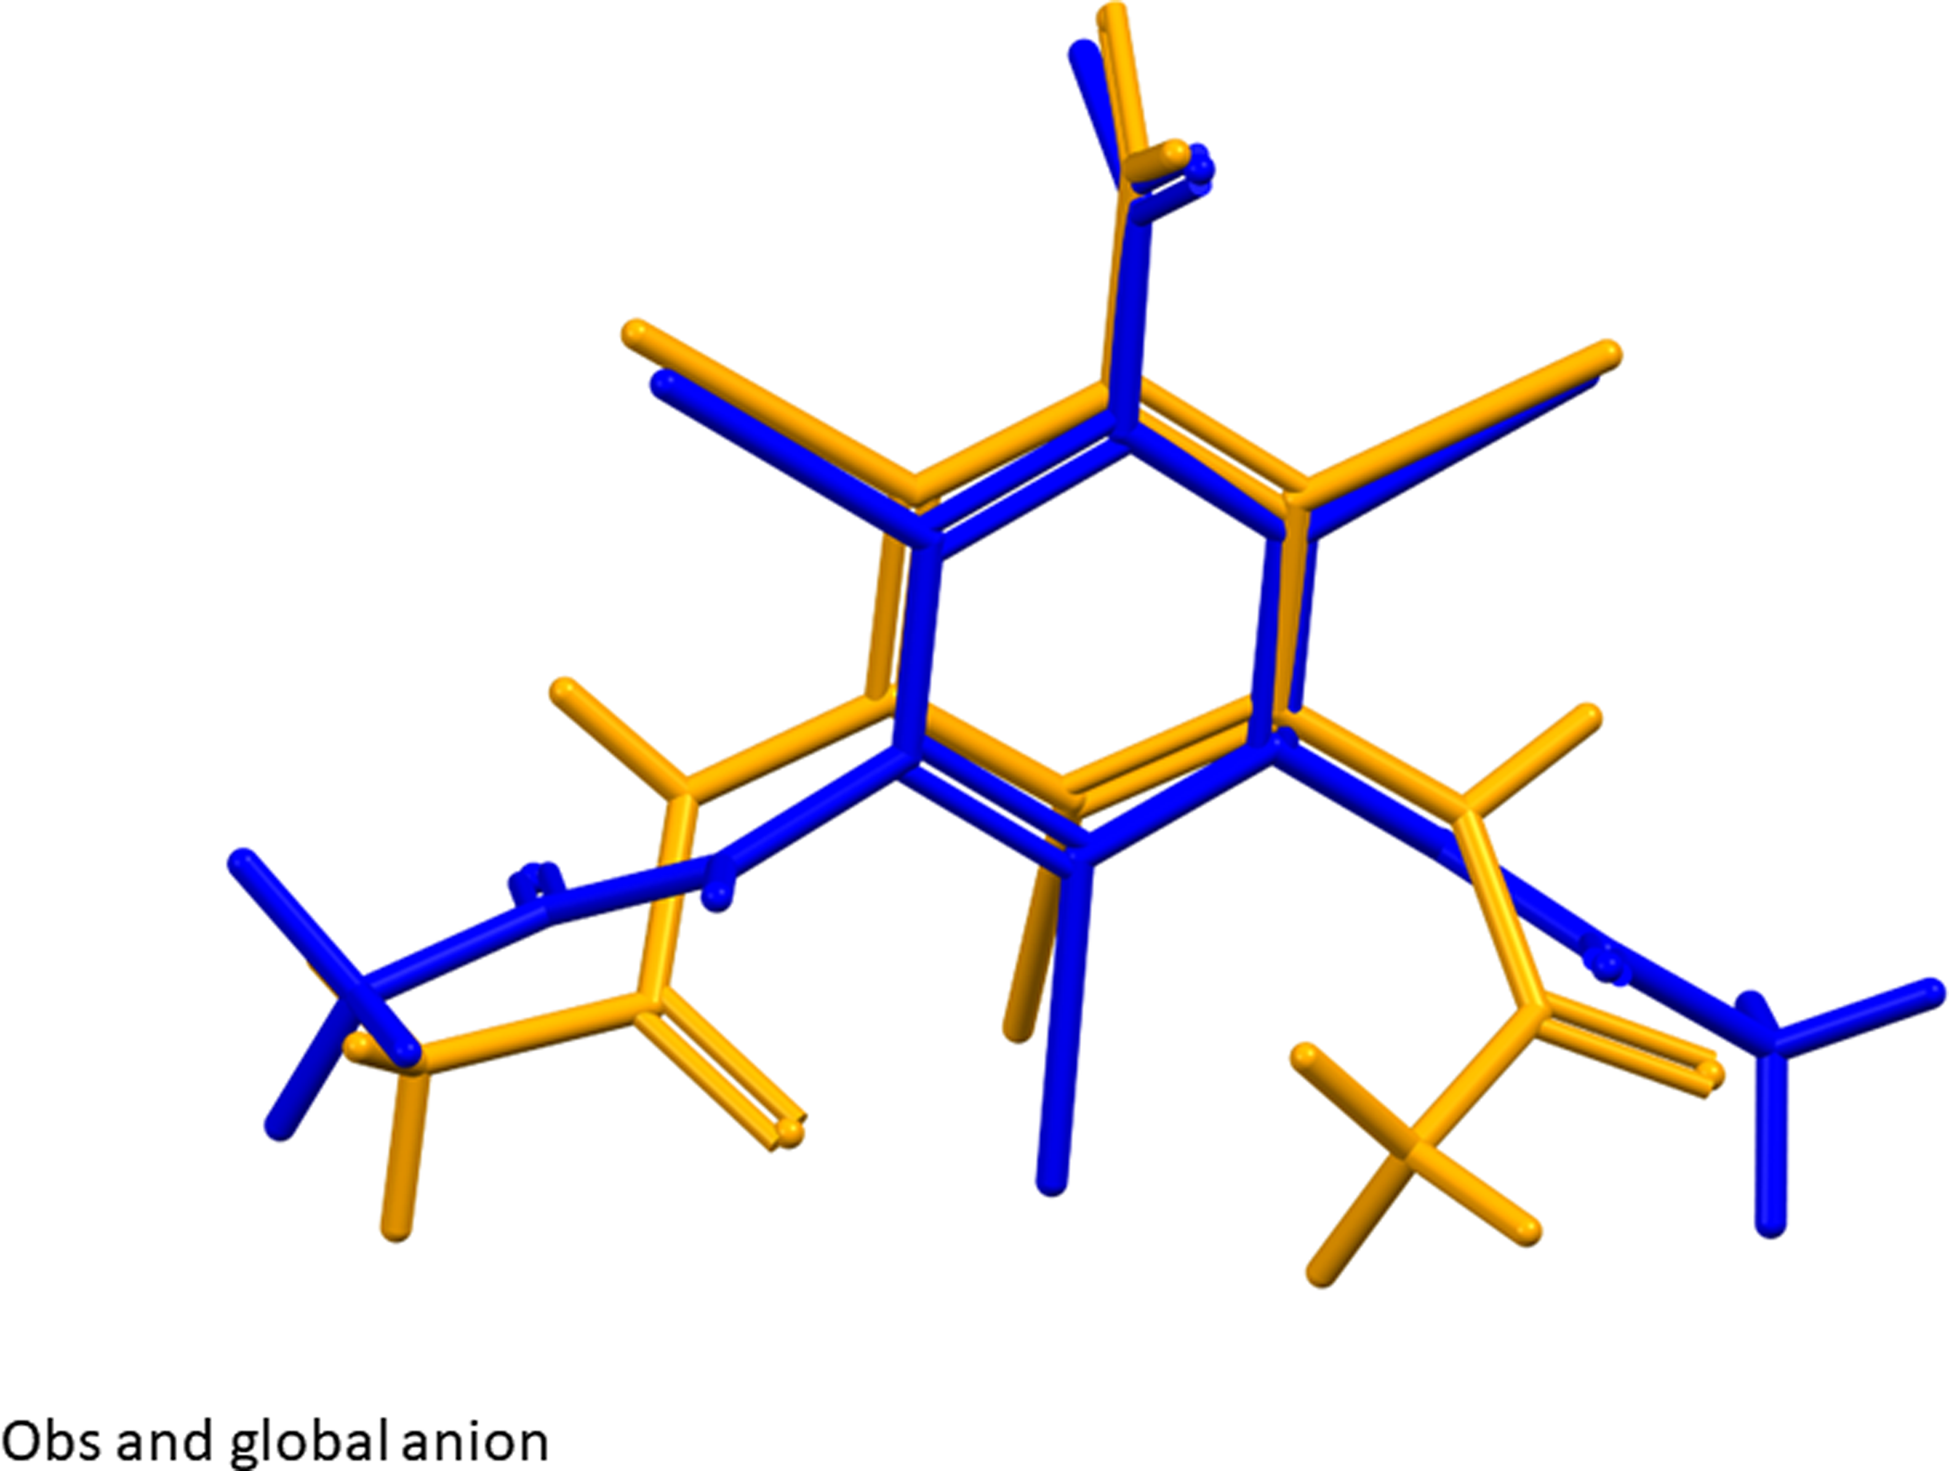
Figure 10. Comparison of the observed structure of the diatrizoate anion (blue) to the global minimum-energy conformation (orange). Image generated using Mercury (Macrae et al., Reference Macrae, Sovago, Cottrell, Galek, McCabe, Pidcock, Platings, Shields, Stevens, Towler and Wood2020).
Analysis of the contributions to the total crystal energy of the structure using the Forcite module of Materials Studio (Dassault Systèmes, 2021) suggests that torsion distortion terms dominate the intramolecular deformation energy. The intermolecular energy is dominated by electrostatic attractions, which in this force field analysis also include hydrogen bonds. The hydrogen bonds are better analyzed using the results of the DFT calculation.
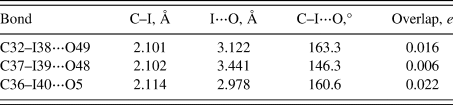
Hydrogen bonds are prominent in the crystal structure (Table I). Each of the hydrogen atoms on the ammonium nitrogen N6 of the cation acts as a donor in a strong N–H⋯O hydrogen bond. One of these is to a hydroxyl group O2 of another cation, and the other is to the carboxylate O43 of the anion. The energies of the N–H⋯O hydrogen bonds were calculated using the correlation of Wheatley and Kaduk (Reference Wheatley and Kaduk2019). Each of the amides N44 and N45 of the anion forms a strong N–H⋯O intermolecular hydrogen bond, one to a carbonyl O49 and the other to a carboxylate O42. Thus, each O of the carboxylate acts as an acceptor in an N–H⋯O hydrogen bond. There is a variety of O–H⋯O hydrogen bonds between the hydroxyl groups of the cation. Some are intramolecular to other hydroxyl groups, and others are intermolecular, both to hydroxyl groups and to carboxyl and carbonyl groups. The energies of the O–H⋯O hydrogen bonds were calculated using the correlation of Rammohan and Kaduk (Reference Rammohan and Kaduk2018). Several C–H⋯O hydrogen bonds also contribute to the lattice energy. C–I⋯O halogen bonds (Table II; Corradi et al., Reference Corradi, Meille, Messina, Metrangolo and Resnati2000; Wilcken et al., Reference Wilcken, Zimmermann, Lange, Joerger and Boeckler2013) also apparently contribute to the crystal energy.
Table I. Hydrogen bonds (CRYSTAL17) in the two structure solutions of meglumine diatrizoate.
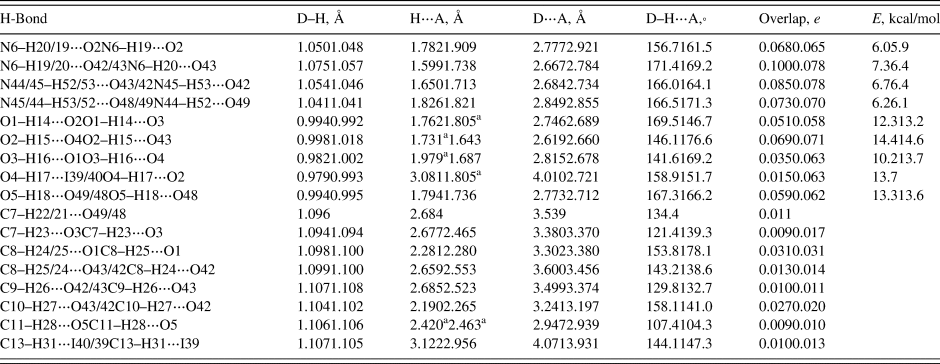
The top lines are structure 1 (incorrect/higher energy) and the bottom lines are structure 2 (correct/lower energy). XXX structure 1 to structure 2 equivalent names.
a Intramolecular.
Table II. C–I⋅⋅⋅O halogen bonds (CRYSTAL17) in meglumine diatrizoate
The volume enclosed by the Hirshfeld surface of the meglumine diatrizoate asymmetric unit (Figure 11, Hirshfeld, Reference Hirshfeld1977; Spackman et al., Reference Spackman, Turner, McKinnon, Wolff, Grimwood, Jayatilaka and Spackman2021) is 637.73 Å3, 98.64% of 1/2 the unit cell volume. The packing density is thus fairly typical. The only significant close contacts (red in Figure 11) involve the hydrogen bonds. The volume/non-hydrogen atom is larger than normal, at 19.6 Å3, reflecting the presence of the large I atoms.
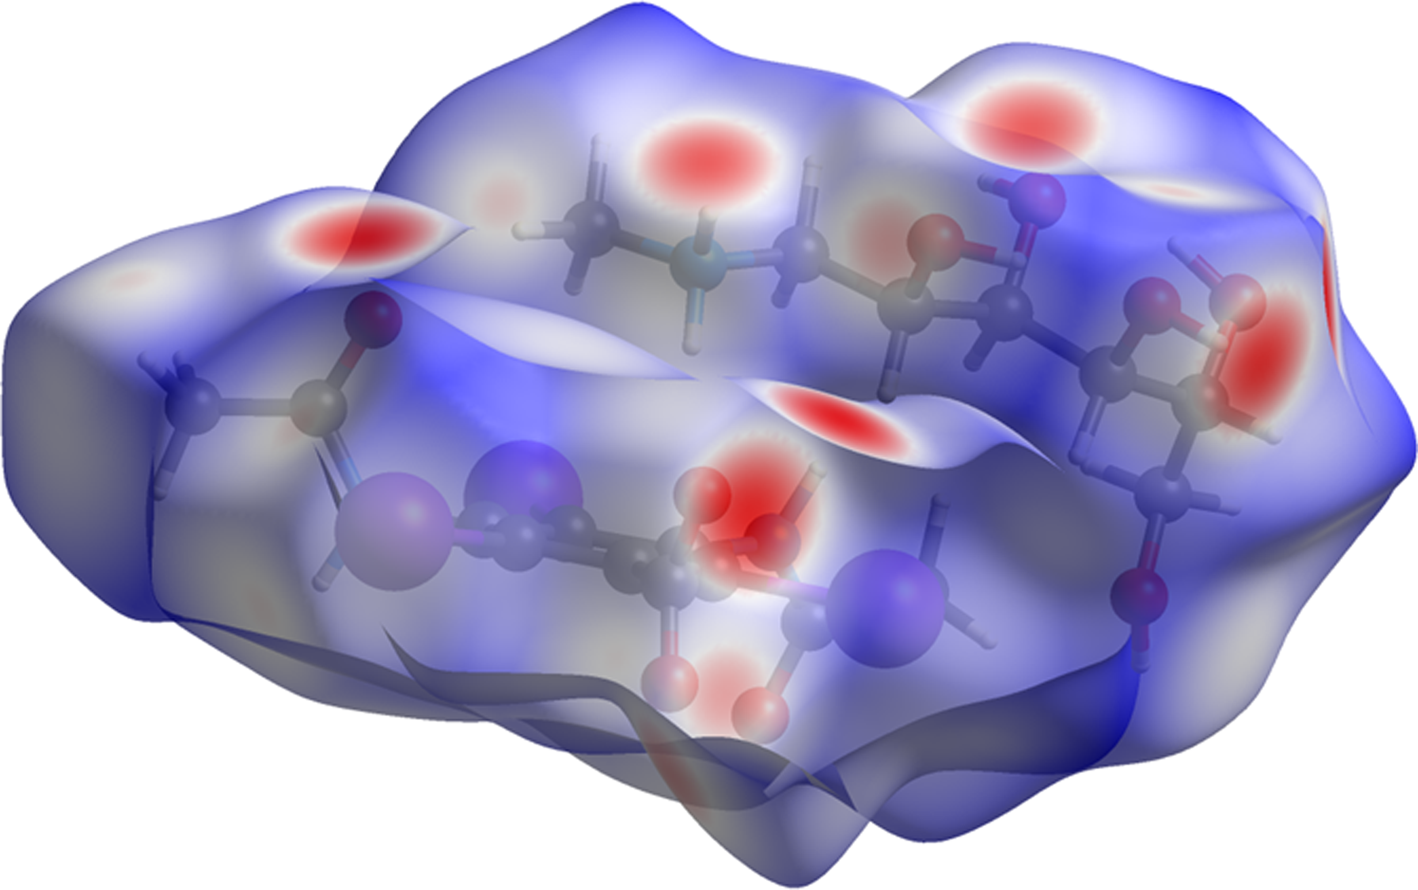
Figure 11. The Hirshfeld surface of meglumine diatrizoate. Intermolecular contacts longer than the sums of the van der Waals radii are colored blue, and contacts shorter than the sums of the radii are colored red. Contacts equal to the sums of radii are white. Image generated using CrystalExplorer (Spackman et al., Reference Spackman, Turner, McKinnon, Wolff, Grimwood, Jayatilaka and Spackman2021).
The Bravais–Friedel–Donnay–Harker (Bravais, Reference Bravais1866; Friedel, Reference Friedel1907; Donnay and Harker, Reference Donnay and Harker1937) morphology suggests that we might expect platy morphology for meglumine diatrizoate, with {001} as the principal faces. No preferred orientation model was necessary, indicating that preferred orientation was not present in this rotated capillary specimen.
IV. DEPOSITED DATA
The powder pattern of meglumine diatrizoate from this synchrotron data set has been submitted to ICDD for inclusion in the PDF. The Crystallographic Information Framework (CIF) files containing the results of the Rietveld refinement (including the raw data) and the DFT geometry optimization were deposited with the ICDD. The data can be requested at pdj@icdd.com.
ACKNOWLEDGEMENTS
Use of the Advanced Photon Source at Argonne National Laboratory was supported by the U. S. Department of Energy, Office of Science, Office of Basic Energy Sciences, under Contract No. DE-AC02-06CH11357. This work was partially supported by the International Centre for Diffraction Data. We thank Lynn Ribaud and Saul Lapidus for their assistance in the data collection.
CONFLICTS OF INTEREST
The authors have no conflicts of interest to declare.


 Open access