


The adequate functioning of a capital market is a concern for stakeholders not only in developed equity markets but also in emerging economies and particularly Latin American markets. As a result, the Organisation for Economic Co-operation and Development (OECD) recently published a report reviewing and suggesting ways to strengthen Latin American equity markets. Capital markets allow companies to access capital and therefore drive a country’s economic growth.Footnote 1 Furthermore, several fund management companies attempt to earn profits from price anomalies in the financial equity markets. This is not in line with the postulates of the efficient market hypothesis (EMH) proposed by Eugene Fama, who was awarded the Nobel Prize for Economics in 2013 precisely for this contribution to modern finance. Fama (Reference Fama1970) suggested that a market is efficient when the adjustment of security prices at any time fully reflects all available information instantly and automatically. Moreover, the weak-form and semi-strong-form efficiency implies that predictability of a security price from historical information (i.e., past prices) and public information (e.g., news, financial statements, earnings announcement) is not possible, and no market participant could systematically, consistently obtain a return above the market. Interestingly, Fama shared the Nobel Prize with Robert Shiller, who wrote the well-known book Irrational Exuberance and authored several papers on behavioral finance topics, in particular “From Efficient Markets Theory to Behavioral Finance,” published in the Journal of Economic Perspectives in 2003. Behavioral finance has emerged as a discipline to explain the anomalies in the financial markets; however, this type of anomaly is not easy to exploit in practice.Footnote 2
On top of that, the literature has shown that stock returns exhibit a predictive power, and the efficient market hypothesis has received many criticisms surrounding it (see, e.g., Grossman and Stiglitz Reference Grossman and Stiglitz1980; Campbell, Lo, and MacKinlay Reference Campbell, Lo and Craig MacKinlay1997). To intellectually reconcile the differences between efficiency and anomalies in the financial markets, Lo (Reference Lo2004) proposes an alternative approach to understanding these markets: the adaptive market hypothesis (AMH). With this, Lo incorporates into EMH the assumptions that agents are not completely rational and are also driven by fear and greed.Footnote 3 In addition, the AMH suggests that, on some occasions, there might be a disconnection between the available information and the behavior of the financial series, contradicting the random walk hypothesis (RWH) and, as a consequence, the weak form of the EMH.
In addition, Lo (Reference Lo2005) showed a consequence of the AMH, which is that predictability of returns can arise from time to time because of changing market conditions, consequently contradicting the totalitarian efficiency of the EMH. Hence, some studies (e.g., Lo and MacKinlay Reference Lo and Craig MacKinlay1988; Neely, Weller, and Ulrich Reference Neely, Weller and Ulrich2009; Zhou and Lee Reference Zhou and Man Lee2013) have analyzed the EMH and tested its validity on the basis of the idea that market efficiency should be treated as an evolving theory over time because of changing factors like regulation, technology, institutions, bubbles, crisis, crashes, and the market participant’s behavior (Al-Khazali and Mirzaei Reference Al-Khazali and Mirzaei2017). In short, AMH allows for market (in)efficiency evolution through time.
The first contribution of this article is that, to the best of our knowledge, it is the first study to evaluate AMH in the five largest Latin American stock markets. This is relevant because there is little research on the validity of the AMH in the Latin American region and emerging markets. Second, while other authors use one or two tests to assess linear and/or nonlinear dependence or predictability, our study employs a battery of six statistical tests (three versions of the variance ratio test [VRT], as well as the Brock-Dechert-Scheinkman [BDS], Domínguez-Lobato [DL], and generalized spectral [GS] tests) for a robustness check to validate the AMH from a linear and nonlinear perspective (e.g., Chu, Zhang, and Chan Reference Chu, Zhang and Chan2019; Ghazani and Ebrahimi Reference Ghazani and Babak Ebrahimi2019; Khuntia and Pattanayak Reference Khuntia and Pattanayak2018; Mandaci, Taşkin, and Ergün Reference Mandaci, Taşkin and Ergün2019; Urquhart and McGroarty Reference Urquhart and McGroarty2016; Zhu Reference Zhu2017). Third, we describe a sample of news from Latin America that could drive inefficiencies in the markets when all six test results are statistically significant. Fourth, we employ a GARCH-M model to evaluate whether there is a constant or changing relationship between risk and returns in the indices. Thus, the present article complements the literature on AMH in Latin America and extends existing work that has examined efficiency in emerging markets. Our results suggest that the predictability of returns for the five most important Latin American indices varies over time, and market efficiency is not an all-or-nothing condition. Moreover, the significant predictability in each market varies at different periods, suggesting that every market behaves differently over time. All in all, our study contributes to the objective of the OECD report in 2019 by getting deeper knowledge of the validity of AMH in the main Latin American equity markets and analyzing news that could be related to inefficiencies in the analyzed markets.
Related literature
The EMH has received many critiques in the financial literature, and we mention some of the most important challenges from a theoretical and empirical perspective. From a theoretical point of view, Grossman and Stiglitz (Reference Grossman and Stiglitz1980) argue that the weak form of EMH might be satisfied, but the semistrong form cannot hold since markets exhibit an “equilibrium degree of disequilibrium,” and markets cannot be fully informationally efficient. On the other hand, Shleifer and Vishny (Reference Shleifer and Vishny1997) support the idea that arbitrage opportunities may exist, and they do not disappear quickly. This is well known as limits to arbitrage, which is opposite the EMH paradigm that arbitrage opportunities must not exist. From an empirical viewpoint, De Bondt and Thaler (Reference Bondt and Thaler1985) noticed that prices overreact, and other related works have found that future returns can be predicted by historical returns. In fact, Fama (Reference Fama1991) admits that returns can be predicted from history. An important assumption of the EMH, the “nonreaction to noninformation,” is debated by Cutler, Poterba, and Summers (Reference Cutler, Poterba and Summers1991), who found that fluctuations in stock prices are not necessarily explained by news announcements.Footnote 4 Furthermore, Harris and Gurel (Reference Harris and Gurel1986) and Shleifer (Reference Shleifer1986) found a significant reaction of the S&P500 index to the inclusion of new shares. Finally, Summers (Reference Summers1986) argues that the power of statistical tests for market efficiency exhibits very low power, which is why our study incorporates a battery of six statistical tests to validate the AMH in stock indices from Latin America, to provide greater robustness to our study.
On the other hand, a new branch of scientific research known as “econophysics” has been developed in recent decades; it applies different theories and models from physics to economic problems, mainly related to stochastic processes and events that present nonlinear dynamics. Econophysics has also been used to evaluate the efficiency in financial markets, and it has shown that stock prices present a kind of long-term memory, which violates one of the assumptions of the EMH and the RWH. For instance, some authors have used methods and physics models such as the Hurst exponent and the detrended fluctuations analysis (Bęben and Orlowski Reference Bęben and Orlowski2001; Costa, Silva, and Ferreira Reference Costa, Silva and Ferreira2019) to assess the returns, volatility, and behavior of tails distributions of returns in data, such as for cryptocurrencies (Dimitrova et al. Reference Dimitrova, Fernández-Martínez, Ángel Sánchez-Granero and Evangelista Trinidad Segovia2019), foreign exchange rates (Di Matteo, Aste, and Dacorogna Reference Di Matteo, Aste and Dacorogna2005), and developed and emerging markets (Sánchez-Granero et al. Reference Sánchez-Granero, Balladares, Ramos-Requena and Evangelista Trinidad Segovia2020; Zunino et al. Reference Zunino, Tabak, Pérez, Garavaglia and Rosso2007; Balladares et al. Reference Balladares, Pedro Ramos-Requena, Evangelista Trinidad-Segovia and Ángel Sánchez-Granero2021; Cajueiro and Tabak Reference Cajueiro and Tabak2005, Reference Cajueiro and Tabak2004; Ferreira Reference Ferreira2018; Ferreira, Dionísio, and Movahed Reference Ferreira, Dionísio and Movahed2017; Milos et al. Reference Milos, Cornel Hatiegan, Mirela Barna and Botoc2020), which evaluate whether there is long- or short-term memory in these time series. They used different trading strategies, reaching results that show that from time to time arbitrage opportunities arise for a short while and then disappear. This is also consistent with the AMH, which states that investment strategies wax and wane, performing well in some environments and poorly in others. However, in this research, we focus on analysis of the AMH and the linearity and nonlinearity of the returns through another type of statistical tests, which complement each other and allow us to study the same phenomenon, that is, the efficiency of market information.
A first approach to the adaptive market conjecture and its validation was carried out by Daniel and Titman (Reference Daniel and Titman1999), who discuss why investors are likely to be overconfident and how that behavioral bias affects their investment decisions. To examine whether unexploited profit opportunities exist, the authors tested for a “somewhat” weak form of market efficiency, also called adaptive efficiency, which allows for the appearance of profit opportunities in historical data. Their results showed that a portfolio strategy based on this hypothesis brought abnormal returns from the US equity portfolios that did not seem to be related to risk, which clearly violates the traditional EMH. Similarly, Miles and Smith (Reference Miles and Smith2010) employed genetic programming with the aim of testing the EMH and adaptive efficiency in the US markets. They developed trading rules for twenty-four individual stocks and employed machine learning to out-of-sample data, testing the adaptive efficiency of these stocks. Their results showed that the twenty-four stocks analyzed were adaptively efficient through the period under study.
In this way, the adaptive market hypothesis appears to be a proposal that seeks to reconcile the EMH of the classical economy postulates with the market anomalies suggested by the behavioral finance field. Lo (Reference Lo2004) argues that such points of view can coexist through a perspective of evolutionary principles (competition, mutation, reproduction, and natural selection) in financial markets. Evolutionary concepts have been widely applied in different financial contexts to explain the waxing and waning of financial institutions, investment products, businesses, industries, and institutional and individual fortunes.Footnote 5 Moreover, Lo (Reference Lo2005, 1) suggests that “the degree of market efficiency is related to environmental factors, characterizing market ecology such as the number of competitors in the market, the magnitude of profit opportunities available, and the adaptability of the market participants,” where individual adaptation to changes is driven by loss aversion, overconfidence, overreaction, mental accounting, and other behavioral biases that are ubiquitous to human decision-making under uncertainty.
Some studies have tried to validate the AMH proposed by Lo, testing it through different assets, markets, and countries. For instance, Butler and Kazakov (Reference Butler and Kazakov2012) employ the S&P500 index to analyze several implications of the AMH from a computational intelligence perspective. Their results demonstrate the existence of subperiods where nonlinear dependence in returns is detected and there is higher accuracy in forecasts. In the same way, Urquhart and McGroarty (Reference Urquhart and McGroarty2016) examine the AMH on indices such as the S&P500, FTSE100, NIKKEI225, and EURO STOXX50 by testing their predictability over twenty-four years. This is performed through different variance ratio tests (VRTs) after whitening the returns through an AR-GARCH process. In addition, the authors study nonlinear dependence using the BDS test and evaluate time-varying return predictability, applying these tests to fixed-length, moving-subsample windows. Their results show that there is statistical evidence for periods of return predictability and other periods where it is not predictable. Along the same line, Noda (Reference Noda2016) evaluates the AMH in the Japanese stock markets (TOPIX and TSE2). Through a time-varying autoregressive model, the author found evidence that the efficiency of these markets evolves and changes over time, showing that the TOPIX market is more efficient than TSE2. Appealing another methodology to empirically test the validity of the AMH, Fahmy (Reference Fahmy2017, 1) employs a regime-switching model with S&P500 data. The author concludes that the rate of return on the S&P500 index continuously switches from a lower inefficient regime (in which asset prices are undervalued) to an upper inefficient regime (in which asset prices are overvalued), remarking that “investors’ adaptability is what brings back inefficient markets to efficiency.”
Additionally, other strands of literature employ different data from stock market indices. For example, Ghazani and Ebrahimi (Reference Ghazani and Babak Ebrahimi2019) evaluated the AMH as an evolutionary perspective on crude oil prices. Their results show that Brent and West Texas intermediate (WTI) returns have the highest levels of efficiency, while the OPEC basket data reflects that as the window length increases, the degree of compliance with AMH decreases. Moreover, Khuntia and Pattanayak (Reference Khuntia and Pattanayak2018) studied the AMH and evolving return predictability for the bitcoin market. The authors also test the Martingale difference hypothesis (MDH) using the Domínguez-Lobato (DL) and generalized spectral (GS) tests and applying a rolling-window framework of four hundred observations to capture time-varying dependence in the bitcoin returns (Escanciano and Lobato Reference Escanciano, Lobato, Terence and Patterson2009; Domínguez and Lobato Reference Domínguez and Lobato2003). Their study suggests that market efficiency evolves with time, and they validated the AMH in bitcoin market, observing that there exist periods of informational efficiency and inefficiency. Similarly, Chu and colleagues (Reference Chu, Zhang and Chan2019) study the AMH in the two largest cryptocurrencies (bitcoin and ethereum), applying the DL and GS tests. They found that the efficiency of these cryptocurrencies varies over time, highlighting that little or nonsignificant changes were related to news or market events.
Regarding emerging markets, just a few studies have tried to validate the hypothesis proposed by Lo. For instance, Hiremath and Kumari (Reference Hiremath and Kumari2014) and Hiremath and Narayan (Reference Hiremath and Narayan2016) empirically evaluate the AMH on the Indian stock market. Likewise, Ghazani and Araghi (Reference Ghazani and Khalili Araghi2014) evaluate the adaptive behavior in the TEPIX index of the Tehran stock exchange (TSE). Finally, Gyamfi (Reference Gyamfi2018) presents evidence from Ghanaian stock market returns. All statistical results of these investigations are consistent with the AMH, as they observe an oscillating movement in the presence of linear and nonlinear dependence among the market returns.
In Latin American applications, Sierra Suárez and colleagues (Reference Sierra Suárez, Benjamín Duarte Duarte and Alfonso Rueda Ortiz2015) evaluate for the Colombian scenario’s predictability of stock markets and the AMH. The authors conclude that Colombia’s stock index has predictable periods and lapses of high uncertainty, which is consistent with the adaptive market postulate. Last, Brito-Cervantes and colleagues (Reference Brito-Cervantes, Coronado, Morales-García and Rojas2018) analyze the adaptive efficiency of the Mexican Stock Exchange through the price-volume ratio of the companies listed. Their findings show that the market goes from periods of efficiency to periods of inefficiency (nonlinear dependence), adjusting according to the flow of information between price and volume.
One issue that we consider important to highlight is that the AMH has also been evaluated from the perspective of market volatility. For instance, Kinnunen (Reference Kinnunen2013, Reference Kinnunen2014) noted that, with a high degree of return predictability, both the conditional risk-return explanation and autocorrelation are relevant in driving the stock market returns. Nevertheless, the source of predictability varies drastically over time with the level of information flow. Along these lines, some studies have used a GARCH-in-mean or GARCH-M model to study the dynamics between risk and returns on assets and to assess the efficiency of the markets. Since the AMH implies that the relation of risk and reward in financial markets varies through time (Lo Reference Lo2004), investors are sometimes punished and other times rewarded for taking more risk. A plausible explanation is that negative stock return creates higher volatility due to an increase in the financial leverage of a firm. This is known as the “leverage effect,” as postulated by Black (Reference Black1976). Likewise, the AMH provides an alternative reason for the shifts in the risk-reward relation; that is, during “relatively” calm periods, prices can reflect the so-called wisdom of crowds, but during turmoil, the wisdom of the crowds is replaced by the madness of mobs when investors response emotionally (see Lo and Zhang Reference Lo and Zhang2021, and the references). Consequently, the time variation in the risk-reward relation is another characteristic of adaptive markets, where markets are either not neither always efficient (EMH posture) or always irrational (behavioral finance posture).
A first example of the use of a GARCH-M(1,1) model is supported by Abdmoulah (Reference Abdmoulah2010), who tests whether eleven Arab stock markets evolve and become more efficient over time. His results suggest that all markets show high sensitivity to past shocks and are found to be weak-form inefficient. Zhu (Reference Zhu2017) adopted a GARCH-M model to study the relationship between return and risk with an analysis of the mechanism behind the market. His results support the AMH, while the test for the full sample shows that the Chinese market is inefficient and there is no trend of efficiency growing monotonously. In addition, the relationship between risk and return is very unstable, reflecting investors’ time-varying risk preferences. Finally, Charfeddine and colleagues (Reference Charfeddine, Khediri, Aye and Gupta2018) employ a GARCH–M(1,1) considering the time variation of the variance structure of returns on government bonds for the US, UK, South Africa, and India over very long time periods (between 84 and 217 years). What they found is that the efficiency of these markets has been changing over time, depending on the prevailing economic, political, and market conditions. Thereby, the degree of the weak-form efficiency of these markets has been gradually improving recently, and these models were capable of tracking when the market exhibits efficiency and when it exhibits inefficiency, which is again aligned with the proposals of the AMH.
Methodology
We evaluate the hypothesis of adaptive markets within five major stock emerging indices in Latin America, which are BOVESPA, IPSA, COLCAP, IPC, and IGBVL, during the sample period January 1995–December 2018.Footnote 6 To achieve this, we employ three versions of the variance ratio test (VRT) to assess the linear dependence of stock returns. Additionally, before conducting the BDS test to evaluate the nonlinear dependence of stock returns, we whitened the data using an AR(1)-GARCH(1,1) model with standardized residuals. This procedure was performed to remove the linear correlation on returns and capture the time-varying volatility. Both VRTs and BDS tests employed a subsample of five hundred daily observations (similar to Urquhart and McGroarty Reference Urquhart and McGroarty2016) to carry out predictability measures. Furthermore, a rolling-window framework of four hundred observations is used to capture the evolution of the DL and GS tests to assess the Martingale difference hypothesis (MDH) and capture the dynamic linear and nonlinear dependence in the index returns.Footnote 7 Moreover, we consider a sample of the relevant news related to the plausible market inefficiencies detected by these tests (VRTs, BDS, DL, and GS). Finally, we employ a GARCH-M model to test the dynamic relationship of risk-reward on these indices.
It is important to highlight that the analysis of serial dependence, both linear and nonlinear, has some relevance in the financial literature in recent times (Ferreira, Dionísio, and Movahed Reference Ferreira, Dionísio and Movahed2017). The concept of linearity indicates that there are variables with a straight-line relationship, where the expected change in the dependent variable, given a change in the independent variables, is always proportional. However, there are different variables that, due to their nature, establish relationships that are nonlinear. In other words, a nonlinear relationship between two variables exists when the increases or decreases between them do not occur in the same proportion. When there are nonlinear relationships between variables, the modeling of the functions becomes more complex since it is not easy to estimate a function that correctly captures the curvature between the variables. That is why we employ different tests that assess both linear and nonlinear dependence in each of the five indices, which complement one another and provide a more robust analysis to the study.
It is also important to note that given the nature of each statistical test, it would be usual to observe that some tests may not agree at the same time when evaluating the (in)efficiency of the markets. The next section presents the results of the tests: VRT, Brock-Dechert-Scheinkman BDS, DL, GS, and a GARCH-M model to examine the inefficiencies or efficiencies in the analyzed data.
Data and results
In this section, we present an analysis of the most important stock markets of Latin America, following our methodology. The data ranged from 2 January 1995 to 31 December 2018. It is obtained from MSCI (Morgan Stanley Capital International) indices and downloaded from the Bloomberg platform. Daily returns for each index are estimated by
 $${R_t} = \ln \left( {{P_t}} \right) - {\rm{ln}}\left( {{P_{t - 1}}} \right),$$
where ${P_t}$
is the price of each index at time t. Descriptive statistics of the BOVESPA, IPSA, IPC, IGBVL, and COLCAP indices are presented in Table 1. In Appendix B, we present the time plots of these stock markets and their returns, where volatility clustering and high peaks are also noticed for them.
${P_t}$
is the price of each index at time t. Descriptive statistics of the BOVESPA, IPSA, IPC, IGBVL, and COLCAP indices are presented in Table 1. In Appendix B, we present the time plots of these stock markets and their returns, where volatility clustering and high peaks are also noticed for them.
Table 1. Descriptive statistics of the daily returns of the Latin American stock indices from 1995 to 2018

* Indicates rejection at 1 percent significance level. The standard deviation is presented annualized.
Table 1 shows that all indices exhibit a mean return close to zero, which is an empirical characteristic of financial series. Moreover, the annualized standard deviation values show that BOVESPA has the highest volatility while IPSA is the least volatile in the region. Additionally, all Latin American market series exhibit negative skewness, indicating low observations on the loss side of the profit and loss distribution. Likewise, there are also leptokurtic distributions, as excess kurtosis is positive for all stock indices. This suggests that it is higher and with wider tails than the reference normal distribution. These results are supported by the Jarque-Bera test, where the statistic rejects the normality hypothesis at a 1 percent level for all return series.
Empirical results for Latin American stock indices
This section analyzes the (in)efficiencies evolution through time for BOVESPA, IPSA, IPC, IGBVL and COLCAP indices.Footnote 8 It is important to note that in all the statistical tests, we are interested in the scenarios in which null hypotheses are rejected.
The statistical significance for the three VRTs is evaluated where, if p $ \le \;$
0.05, it rejects the null hypothesis that stock returns are serially uncorrelated with
$ \le \;$
0.05, it rejects the null hypothesis that stock returns are serially uncorrelated with $\rho \left( j \right) = 0.$
That is, a nonzero correlation implies that there is some type of association between past and present data, or there is a type of correlation—positive or negative—that violates the assumption of the random-walk hypothesis. Figure 1 presents the p-values for the three VRTs over time for the five Latin American indices. Throughout the sample and for each stock market index, the p-values move between rejection (below the dotted line) and nonrejection zones of the null hypothesis. This implies that there is a linear relationship in returns that appears and disappears, suggesting that historical information could be used to predict the future behavior of the indices where the VRT null hypothesis is rejected. Moreover, the changing behavior of the linear relationship supports the AMH in these time series.
$\rho \left( j \right) = 0.$
That is, a nonzero correlation implies that there is some type of association between past and present data, or there is a type of correlation—positive or negative—that violates the assumption of the random-walk hypothesis. Figure 1 presents the p-values for the three VRTs over time for the five Latin American indices. Throughout the sample and for each stock market index, the p-values move between rejection (below the dotted line) and nonrejection zones of the null hypothesis. This implies that there is a linear relationship in returns that appears and disappears, suggesting that historical information could be used to predict the future behavior of the indices where the VRT null hypothesis is rejected. Moreover, the changing behavior of the linear relationship supports the AMH in these time series.

Figure 1. The three different variance ratio joint-test statistic p-values over time for the BOVESPA, IPSA, IPC, IGBVL, and COLCAP (daily, two-year window). The horizontal line corresponds to the 5 percent significance level.
Figure 2 reports the average p-values of the BDS test for the four-dimension sizes using a two-year rolling window analysis. To this test, the null hypothesis is that the data-generating processes are i.i.d., which means that variables are totally random and independently follow the same probability distribution. Then, a rejection of the null hypothesis of the BDS suggests that there is a nonlinear relationship between past returns and present returns of the financial series. Therefore, these indices do not always follow a random walk but instead present moments of predictability and correlation. Hence, the results also provide evidence of the AMH, reflecting that these index returns evolve and change state between periods of predictability and total uncertainty.

Figure 2. The average BDS statistic p-values over time for the BOVESPA, IPSA, IPC, IGBVL, and COLCAP (daily, two-year window). The horizontal line corresponds to the 5 percent significance level.
Furthermore, in Figures 3 and 4 we see the results of both DL and GS tests. For them, a rejection of the null hypothesis suggests that indices do not follow a Martingale difference process.Footnote 9 With this in mind, we can say that each of the five Latin American indices presents states (below the dotted line) in which its expected value with respect to the past is different from zero. In other words, a rejection of the null would have implications like potential excess profits to agents, as past prices actually could support an accurate forecast of future prices. Here, we also observe a change in behavior of informational efficiency through time since the p-value moves in values above and below the dotted line, supporting the AMH for the analyzed Latin America stock indices.

Figure 3. The DL test statistic p-values over time for the BOVESPA, IPSA, IPC, IGBVL, and COLCAP (daily, four hundred observations window). The horizontal blue line corresponds to the 5 percent significance level.

Figure 4. The GS test statistic p-values over time for the BOVESPA, IPSA, IPC, IGBVL, and COLCAP (daily, four hundred observations window). The horizontal blue line corresponds to the 5 percent significance level.
Related news to inefficiencies
This section analyzes salient news related to the plausible inefficiencies detected by the results of the VRT, BDS, DL, and GS tests. As noted by Summers (Reference Summers1986), the tests for market efficiency might have very low power. Hence, we grouped the test results by whether they coincided in some periods. Moreover, it is believed that in inefficient markets, there is a delayed reaction of the price of the assets to news, as pointed out by Lo (Reference Lo2017, 13):
Stock markets are merciless in how they react to news. Investors buy or sell shares depending on whether news is good or bad, and the market will incorporate the news into the prices of publicly traded corporations. Good news is rewarded, bad news is punished, and rumors often have just as much impact as hard information. But it usually takes the market time and effort to digest the news and factor it into stock prices.
In Table 2 we list some of the most important related news on the periods in which all test results coincided with them.Footnote 10
Table 2. Main news from Latin America markets related to inefficiencies
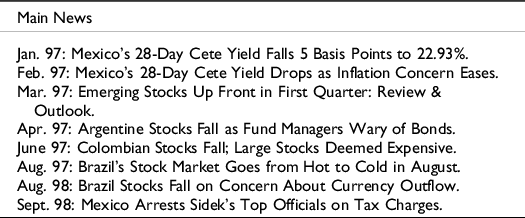
Regarding Latin American markets, we can see that some news related to the fall in the short-term yields of Mexican Treasury bonds had quite an impact on this geographical region. In addition, different falls in Argentinean, Colombian, and Brazilian shares stand out (after an extended rise in the latter), given the distrust of investors in these stock markets. Moreover, there are some news items related to the good performance of Russia in the capital markets, together with Turkey and Brazil, suggesting that some Asian developing economies affect the behavior of Latin American stock markets.
In summary, news associated with the financial sector (national bonds and the stock market), news from the technology and telecommunications sectors, and macroeconomic news (e.g., external debt, interest rates, exchange rates) could have affected the efficiency of these emerging markets, as in the periods when the tests were statistically significant at the same time, the most relevant news items were linked with these topics. Figure 5 shows how, when grouping the test results, it is also noteworthy that most of the inefficiencies are presented at the beginning of our study period. This does not necessarily imply that emerging markets are becoming more efficient over time, but the results are in favor of AMH. Deeper investigation is needed to analyze the degree of efficiency since there is evidence that emerging markets become more efficient over time (e.g., Cajueiro and Tabak Reference Cajueiro and Tabak2004; Hull and McGroarty Reference Hull and McGroarty2014), although they are less efficient than developed markets (Lim Reference Lim2007).

Figure 5. This figure represents the indicator function where all tests coincide in rejecting the null hypothesis of VRT, BDS, DL, and GS tests for each emerging Latin American market. The graphs for each group of tests and are available on request.
Empirical results of the risk-reward relationship
As another implication of AMH, Lo (Reference Lo2004) states that time-varying risk and reward relationships depend on changing market conditions, which is consistent with the hypothesis of behavioral finance. We applied a GARCH-M model with the aim of assessing the risk-return relationship using the same rolling-window strategy as earlier. Figure 6 shows the t-stats of the λ coefficient (see Eqs. A.20–A.21 in Appendix A) as an indication of the fluctuation and variability of the risk-return relationship in the analyzed indices, which is in line with the AMH. From here, we can analyze how the relationship between risk and return is not always the same over time, but like the efficiency of the markets, it is something that constantly changes and evolves. When the t-stat of λ coefficient takes a value of less than or equal to −2, this implies that a riskier investment does not necessarily lead to higher returns. The foregoing implies that the idea that “the higher the risk, the higher the return” is not always correct since this relationship changes over time, and riskier investments do not necessarily lead to higher profits. Again, these results aim to support AMH validation in these financial markets.

Figure 6. Subsample risk-return relationship test: BOVESPA, IPSA, IPC, IGBVL, and COLCAP indices.
Discussion
Because of these statistical tests, we found evidence of the predictability of returns for Latin American indices in different periods, which could lead to arbitrage opportunities for investors, as there are intervals of correlation (linear and nonlinear) between the returns. Thus, the VRT and BDS test results indicate the existence of periods where there is a nonlinear relationship between the returns of the financial indices. However, we also observe periods with nonstatistical evidence, which suggests that sometimes markets are efficient and there is no possibility of predicting future behavior of the assets. Thus, our VRT and BDS results for the analyzed Latin American indices are consistent with those obtained by other researchers in different time series (e.g., Gyamfi Reference Gyamfi2018; Hiremath and Kumari Reference Hiremath and Kumari2014; Hiremath and Narayan Reference Hiremath and Narayan2016; Urquhart and McGroarty Reference Urquhart and McGroarty2016). Furthermore, the results of both DL and GS tests for the five indices are consistent with the AMH, since in an oscillating way, the returns exhibit nonlinear predictability by rejecting the null hypothesis of random walk through different periods in the sample. This implies that stock markets do not always follow a random walk and are unpredictable, but from time to time, historical prices can be used to make more accurate forecasts. Again, these results are consistent with other studies (e.g., Ghazani and Araghi Reference Ghazani and Khalili Araghi2014; Ghazani and Ebrahimi Reference Ghazani and Babak Ebrahimi2019; Gyamfi Reference Gyamfi2018; Khuntia and Pattanayak Reference Khuntia and Pattanayak2018). Moreover, we analyzed the main news that could have affected efficiency in the markets during periods in which the different tests were statistically significant at the same time. Here we found that most periods of inefficiency appear at the beginning of the sample; however, this does not necessarily imply that these markets become more efficient over time. Rather, it implies that our results are in favor of the AMH. Further research is needed for more depth on the degree of efficiency in emerging markets, as there is evidence that these are less efficient than developed markets (Lim Reference Lim2007). Finally, we captured the time-varying features of the risk-return relationship using a GARCH-M model; thus, we observed that this linkage also changes through time, showing that each market interacts distinctly with and is affected by the market conditions. Thereby, the premise that the higher the risk, the higher the return is not always achieved; rather, this relationship changes over time, and a riskier investment does not necessarily lead to higher profits. Intuitively, besides fundamentals and technical analysis, the market regimes, macroeconomic policies, regulatory policies, market microstructure, exogenous shocks, world economy, pandemics, and emotional factors may affect the efficiency of the stock markets.
Thus, this article provides implications for policy makers, academics, and investors. First, policy makers have the duty to propose more accurate regulations focused on reducing distortions in the stock market, especially in emerging economies. Therefore, improving information technology and disclosure requirements could make information less costly and more affordable. This might help in reducing arbitrage opportunities and could ensure a fair price. Consequently, by decreasing inefficiency in the stock markets, the challenges faced by investors regarding transparency, liquidity, and subjectivity would be reduced, and confidence in the market will be maintained (Charfeddine et al. Reference Charfeddine, Khediri, Aye and Gupta2018). Likewise, investors might hold this AMH approach as an investment strategy at different times. Finally, our results point out to academics the benefit of modeling stock market (in)efficiency using the time-varying approach, as unlike static models, the models are able to track when the market exhibits efficiency and when it reveals inefficiency.
Conclusions and future research
This article examines the validity of the adaptive market hypothesis for the most important emerging stock indices of Latin America (Brazil, Colombia, Chile, Mexico, and Peru) by employing daily data from January 1995 to December 2018. Three different VRTs are employed as a measure of linear return predictability, as well as the nonlinear BDS test with prewhitened returns. Moreover, we apply the DL and GS tests to measure the linear and nonlinear dependence and to observe whether the returns follow a random walk, according to the Martingale difference hypothesis. Additionally, we present a brief analysis of the salient news for some stock indices that might be related to plausible inefficiencies detected by the results of the VRT, BDS, DL, and GS tests. Finally, we also use a GARCH-M specification to analyze the changing relationship between risk and return through the sample.
We found evidence of switching behavior between periods of efficiencies and inefficiencies in each market, in accordance with Lo (Reference Lo2004). This suggests that the predictability of Latin American stock returns actually varies through time, and market efficiency in this region is not an all-or-nothing condition, as Fama (Reference Fama1970) suggested. This is found throughout the sample period for each of the three alternatives of the VRT for linear dependence, as well as for the BDS test for nonlinear dependence. This suggests that predictability in each of the five stock indices varies at different periods, telling us that every market evolves and behaves differently over time, adapting itself to dynamic changes across the world. Moreover, we found that the MDH is satisfied in diverse periods, where DL and GS tests show the presence and absence of nonlinear dependence among the index returns. This suggests that returns of the indices follow a random walk not in the whole sample but during some periods. This is also consistent with results presented in the econophysics literature, where, using different models and tools from physics, some authors (e.g., Balladares et al. Reference Balladares, Pedro Ramos-Requena, Evangelista Trinidad-Segovia and Ángel Sánchez-Granero2021; Ferreira Reference Ferreira2018; Ferreira, Dionísio, and Movahed Reference Ferreira, Dionísio and Movahed2017; Milos et al. Reference Milos, Cornel Hatiegan, Mirela Barna and Botoc2020; Sánchez-Granero et al. Reference Sánchez-Granero, Balladares, Ramos-Requena and Evangelista Trinidad Segovia2020; Zunino et al. Reference Zunino, Tabak, Pérez, Garavaglia and Rosso2007) found long- or short-term memory in the financial series, suggesting the temporary presence of arbitrage opportunities and a rejection of the random-walk hypothesis, as well as the EMH. Likewise, news from the financial sector (national bonds and the stock market), from the technology and telecommunications sectors, and at the macroeconomic level (external debt, interest rates and exchange rates) could have affected the efficiency of these Latin American markets: when the tests were statistically significant at the same time, the most relevant news items were related to these topics. However, it is important to note that there are many drivers that can affect the degree of efficiency in the markets, such as public and complimentary policies (see, e.g., Ros Reference Ros2003; Wise Reference Wise2017), news, financial crises, pandemics, the market structure itself, and technical and fundamental analysis. Finally, this study uncovers the time-varying features of both market efficiency and the risk-return relationship using a GARCH-M model, where we observe that this relationship also changes and is affected by market turmoil; that is, the premise that the higher the risk, the higher the return is not always true. Rather, this relationship changes over time, and riskier investments do not necessarily generate higher profits. These aspects support the validity of the AMH in the five analyzed markets.
For future research, the stock exchanges of emerging economies such as India, China, countries of the Middle East, Eastern Europe, and Africa, as well as emerging markets, could be included in the AMH analysis to perform a more global assessment of the level of predictability of stock returns in developing economies. Additionally, the Runs test would be useful as a nonparametric test to evaluate the hypothesis of the random walk as well as the Hurst exponent or the detrended fluctuations analysis to measure long memory persistence. Moreover, it would be interesting to examine market anomalies (e.g., calendar effects, small-firm effects, post-earnings-announcement drift, value effect) as an alternative way to evaluate the adaptive market hypothesis.
Acknowledgments
We acknowledge comments from participants and discussants at the World Finance Conference 2020.
Appendix A: Test for (in)efficiencies
Variance Ratio Test (VRT)
The VRT examines whether stock returns are serially uncorrelated. This technique is one of the most employed in econometrics to test the RWH: if the returns of the indices follow a random walk, then the variance of the k-period return will be equal to k times the variance of that period return. Lo and MacKinlay (Reference Lo and Craig MacKinlay1988) proposed a test for this hypothesis denoted by VR(k). The variance ratio for return at time t ( ${r_t})$
with holding period k is
${r_t})$
with holding period k is
 $$VR\left( k \right) = {{\sigma _k^2} \over {k{\sigma ^2}}},$$
where t = 1, 2, 3, …, T. In addition, $\sigma _k^2 = Var\left( {{r_t} + {r_{t - 1}} + \ldots + {r_{t - k + 1}}} \right)$
is the variance of k-period return, rewritten as
$\sigma _k^2 = Var\left( {{r_t} + {r_{t - 1}} + \ldots + {r_{t - k + 1}}} \right)$
is the variance of k-period return, rewritten as
 $$VR\left( k \right) = 1 + 2\sum\limits_{j = 1}^{k - 1} {\left( {1 - {j \over k}} \right)} \rho \left( j \right)\;,$$
where $\rho \left( j \right)$
is the autocorrelation of
$\rho \left( j \right)$
is the autocorrelation of ${r_t}$
of order j. The null of the VRT is that the VR equals 1 for all ks, as returns are serially uncorrelated with
${r_t}$
of order j. The null of the VRT is that the VR equals 1 for all ks, as returns are serially uncorrelated with $\rho \left( j \right) = 0.$
That is, values for VR(k) greater (less) than 1 imply a (negative) positive serial correlation. Lo and MacKinlay (Reference Lo and Craig MacKinlay1988) demonstrate that if
$\rho \left( j \right) = 0.$
That is, values for VR(k) greater (less) than 1 imply a (negative) positive serial correlation. Lo and MacKinlay (Reference Lo and Craig MacKinlay1988) demonstrate that if ${r_t}$
is i.i.d., under the assumption of homoscedasticity, then the null is VR(k) = 1. The test statistic
${r_t}$
is i.i.d., under the assumption of homoscedasticity, then the null is VR(k) = 1. The test statistic ${M_1}\left( k \right)$
is given by
${M_1}\left( k \right)$
is given by
 $${M_1}\left( k \right) = {{VR\left( {r;k} \right) - 1} \over {\Phi {{\left( k \right)}^{1/2}}}}\;.$$
Following the (asymptotically) standard normal distribution and the asymptotic variance, ${\rm{\Phi }}\left( k \right)\;$
is given by
${\rm{\Phi }}\left( k \right)\;$
is given by
 $$\Phi \left( k \right) = \;{{2\left( {2k - 1} \right)\left( {k - 1} \right)} \over {3k}}$$
To verify that returns exhibit conditional heteroskedasticity, they proposed a heteroskedasticity robust test statistic ${M_2}\left( k \right)$
, which follows the standard normal distribution asymptotically under the null VR(k) = 1, where
${M_2}\left( k \right)$
, which follows the standard normal distribution asymptotically under the null VR(k) = 1, where
 $${M_2}\left( k \right) = {{VR\left( {r;k} \right) - 1} \over {{\Phi ^{\rm{*}}}{{\left( k \right)}^{1/2}}}}$$
and
 $${\Phi ^{\rm{*}}}\left( k \right) = \;\sum\limits_{j = 1}^{k - 1} {{{\left[ {{{2\left( {k - j} \right)} \over k}} \right]}^2}} \delta \left( j \right)$$
 $$\delta \left( j \right) = \left\{ {\mathop \sum \limits_{t = j + 1}^T {{({r_t} - \hat \mu )}^2}{{\left( {{x_{t - j}} - \hat \mu } \right)}^2}} \right\}/\left\{ {{{\left[ {\mathop \sum \limits_{t = 1}^t {{\left( {{r_t} - \hat \mu } \right)}^2}} \right]}^2}} \right\}.{\rm{\;}}$$
Equation A.5 is useful for returns of price time series because most of the long memory tests are sensitive to the presence of short-term linear dependence and conditional heteroskedasticity (Lim and Hooy Reference Lim and Hooy2013). To overcome these problems, Chow and Denning (Reference Chow and Denning1993) proposed a multiple VRT in which it is only considered the maximum absolute value of VR(k) in a set of m test statistics. The Chow-Denning (CD) test statistic is defined as
 $$C{D_1} = {\rm{\;}}\sqrt T {\rm{\;}}\mathop {\max }\limits_{1 \le j \le m} \left| {{M_2}\left( {{k_j}} \right)} \right|,$$
which follows a studentized maximum modulus (SMM) distribution, with m and T (sample size) degrees of freedom. Likewise, Wright (Reference Wright2000) proposed a nonparametric alternative and use ranks and signs to solve the problems of asymmetric samples. The signs-based test is accurate even on conditional heteroskedasticity and the ranks-based test show low-size disturbance under heteroskedasticity. Wright defines the rank-based VRT ${R_1}$
and
${R_1}$
and ${R_2}$
for j = 1 or 2 as
${R_2}$
for j = 1 or 2 as
 $${R_j}\left( k \right) = \;\left( {{{{{\left( {Tk} \right)}^{ - 1}}\sum\nolimits_{t = k}^T {{{\left( {{r_{jt}} + \ldots + {r_{jt - k + 1}}} \right)}^2}} } \over {{T^{ - 1}}\sum\nolimits_{t = 1}^T {{r_{jt}}^2} }} - 1} \right)\;{\left( {{{2\left( {2k - 1} \right)\left( {k - 1} \right)} \over {3kT}}} \right)^{ - 1/2}},$$
where
 $${r_{1t}} = {{\left[ {r\left( {{r_t}} \right) - \left( {T + {1 \over 2}} \right)} \right]} \over {\sqrt {\left( {\left( {T - 1} \right)\left( {T + 1} \right)} \right)/12} }}\;,$$
 $${r_{2t}} = {{{\varphi ^{ - 1}}r({r_t})} \over {T + 1}}$$
where ${\varphi ^{ - 1}}$
is the quantile of the standard normal. The signs-based test of the first difference is given by
${\varphi ^{ - 1}}$
is the quantile of the standard normal. The signs-based test of the first difference is given by
 $${S_j}\left( k \right) = \;\left( {{{{{\left( {Tk} \right)}^{ - 1}}\sum\nolimits_{t = k}^T {{{\left( {{S_{jt}} + \ldots + {S_{it - k + 1}}} \right)}^2}} } \over {{T^{ - 1}}\sum\nolimits_{t = 1}^T {S_{jt}^2} }} - 1} \right)\;{\left( {{{2\left( {2k - 1} \right)\left( {k - 1} \right)} \over {3kT}}} \right)^{ - 1/2}} 7$$
where ${S_t} = 2u\left( {{y_t},0} \right)$
and
${S_t} = 2u\left( {{y_t},0} \right)$
and $u\left( {{y_t},0} \right)$
is ½ if
$u\left( {{y_t},0} \right)$
is ½ if ${y_t} \gt 0$
and −1/2 otherwise.
${y_t} \gt 0$
and −1/2 otherwise.
BDS Test
Some tests such as autocorrelation, runs, or variance ratio are inefficient when evaluating the nonlinearity in the returns of the assets, therefore, the use of linear models under certain conditions may yield wrong estimations and inferences.Footnote 11 To solve this problem, Brock, Scheinkman, and Dechert (Reference Brock, Scheinkman and Dechert1987) developed a nonparametric model for serial dependence in stock returns. The null is that data generating processes are i.i.d., while the alternative is a signal that the model is misspecified (Brock et al. Reference Brock, Scheinkman, Dechert and LeBaron1996). With an i.i.d. sample
 $${W_{m,\;n}}\left( \varepsilon \right) = \sqrt n {{{T_{m,n}}\left( \varepsilon \right)} \over {{V_{m,n}}\left( \varepsilon \right)}}$$
where ${W_{m,\;n}}\left( \varepsilon \right)$
is the BDS statistic, m is the embedding dimension, n is the sample size, and
${W_{m,\;n}}\left( \varepsilon \right)$
is the BDS statistic, m is the embedding dimension, n is the sample size, and $\varepsilon $
is the maximum difference between pairs of observations in computing the correlation integral. While,
$\varepsilon $
is the maximum difference between pairs of observations in computing the correlation integral. While, ${T_{m,n}}\left( \varepsilon \right)$
measures the difference between the dispersion of the observed data in a number of spaces with the dispersion that an i.i.d. process would generate in these spaces
${T_{m,n}}\left( \varepsilon \right)$
measures the difference between the dispersion of the observed data in a number of spaces with the dispersion that an i.i.d. process would generate in these spaces $\left( {{C_{m,n}}\left( \varepsilon \right) - {C_{1,n}}{{\left( \varepsilon \right)}^m}} \right)$
and has an asymptotic normal distribution with zero mean and variance
$\left( {{C_{m,n}}\left( \varepsilon \right) - {C_{1,n}}{{\left( \varepsilon \right)}^m}} \right)$
and has an asymptotic normal distribution with zero mean and variance $V_m^2\left( \varepsilon \right).$
Following Mandaci, Taşkin, and Ergün (Reference Mandaci, Taşkin and Ergün2019), Urquhart and McGroarty (Reference Urquhart and McGroarty2016), our choice of m is from 2 to 5. To determine how the BDS test predictability changes over time, we use the p-values’ average generated from the m values.
$V_m^2\left( \varepsilon \right).$
Following Mandaci, Taşkin, and Ergün (Reference Mandaci, Taşkin and Ergün2019), Urquhart and McGroarty (Reference Urquhart and McGroarty2016), our choice of m is from 2 to 5. To determine how the BDS test predictability changes over time, we use the p-values’ average generated from the m values.
Before applying the BDS test, we removed all linear correlations and whitened the index returns fitting an AR(1)-GARCH(1,1) model with standardized residuals. Hence, if the filtered returns have significant dependence, it would suggest there is nonlinear dependence in stock returns, contradicting some assumptions behind EMH (Hiremath and Kumari Reference Hiremath and Kumari2014). Moreover, a further rejection of the i.i.d. null hypothesis would imply that conditional heteroskedasticity is not the main source of nonlinearity in the underlying time series (Lim and Hooy Reference Lim and Hooy2013).
Dominguez-Lobato (DL) Test
We test the Martingale difference hypothesis (MDH) in the time series employing the consistent and integrated test proposed by Domínguez and Lobato (Reference Domínguez and Lobato2003). The MDH suggests that asset prices react immediately to new information and follow a Martingale difference sequence (MDS), where its expectation with respect to the past is zero. In econometrics, the MDS property is also known as (conditional) mean independence, suggesting that past and current information are of no use for forecasting future values. Thus, MDH states that the best predictor for tomorrow’s asset price, given the past and current information set, is the unconditional expectation (Escanciano and Lobato Reference Escanciano, Lobato, Terence and Patterson2009). Hence, a process follows an MDS if the conditional expected value of the following observation, given all past observations, is equal to the most recent observation. That is:
 $$E\;\left( {{Y_t}\;|\;{Y_{t - 1}},{Y_{t - 2}}, \ldots } \right) = \mu \;.$$
Thereby, the DL test uses two statistics based on the Cramer-von Mises (CvM) and Kolmogorov-Smirnov (KS) statistics,
 $$Cv{M_{n,p}} = \;{1 \over {{{\hat \sigma }^2}{n^2}}}\mathop \sum \limits_{j = 1}^n {\left[ {\mathop \sum \limits_{t = 1}^n \left( {{Y_t} - \bar Y} \right){1_{\left( {{{\tilde Y}_{t,P}} \le \;{{\tilde Y}_{j,P}}} \right)}}} \right]^2},$$
and
 $$K{S_{n,P}} = \mathop {\max }\limits_{1 \le i \le n} \left| {{1 \over {\hat \sigma \sqrt n }}\mathop \sum \limits_{t = 1}^n \left( {{Y_t} - \bar Y} \right){1_{\left( {{{\tilde Y}_{t,P}} \le {{\tilde Y}_{i,P}}} \right)}}} \right|\;,\;$$
respectively, where $P$
is a positive integer,
$P$
is a positive integer, ${\tilde Y_{t,P}} = {\left( {{Y_{t - 1}},\; \ldots ,{Y_{t - P}}} \right)^\prime}$
, and
${\tilde Y_{t,P}} = {\left( {{Y_{t - 1}},\; \ldots ,{Y_{t - P}}} \right)^\prime}$
, and ${1_{\left( {{{\tilde Y}_{t,P}} \le {{\tilde Y}_{j,P}}} \right)}}$
and
${1_{\left( {{{\tilde Y}_{t,P}} \le {{\tilde Y}_{j,P}}} \right)}}$
and ${1_{\left( {{{\tilde Y}_{t,P}} \le {{\tilde Y}_{i,P}}} \right)}}$
are indicator functions, which take the value of 1 if the condition in parenthesis is satisfied. According to Khuntia and Pattanayak (Reference Khuntia and Pattanayak2018), the DL test shows robustness to factors such as size distributions, nonnormality, and heteroskedasticity, with a null hypothesis of nondirectional predictability in the data.
${1_{\left( {{{\tilde Y}_{t,P}} \le {{\tilde Y}_{i,P}}} \right)}}$
are indicator functions, which take the value of 1 if the condition in parenthesis is satisfied. According to Khuntia and Pattanayak (Reference Khuntia and Pattanayak2018), the DL test shows robustness to factors such as size distributions, nonnormality, and heteroskedasticity, with a null hypothesis of nondirectional predictability in the data.
Generalized Spectral (GS) Test
The GS test is an alternative to DL test to evaluate (non)linear dependence. It was proposed by Escanciano and Velasco (Reference Escanciano and Velasco2006), and the main difference from the DL is that GS assumes dependence at all lags, but still consistent applying to i.i.d. data. Moreover, the asymptotic null distribution of this test depends on data generating process, so a bootstrap procedure is proposed such that it is robust to higher-order dependence, in particular to conditional heteroskedasticity. Thus, the GS is a powerful test for returns’ predictability (Gyamfi Reference Gyamfi2018). Hence, the generalized spectral distribution function,
 $$H\left( {\lambda ,\chi } \right) = {\gamma _0}\left( \chi \right)\lambda + 2\sum\limits_{j = 1}^\infty {{\gamma _0}} \left( \chi \right){{\sin \left( {j\pi \lambda } \right)} \over {j\pi }}\;;\;\lambda \left[ {0,1} \right],$$
follows the value ${H_0}\left( {\lambda ,\chi } \right) = {\hat \gamma _0}\left( \chi \right)\lambda $
, and the statistic to test the null hypothesis of dependence is
${H_0}\left( {\lambda ,\chi } \right) = {\hat \gamma _0}\left( \chi \right)\lambda $
, and the statistic to test the null hypothesis of dependence is
 $${S_T}\left( {\lambda ,\chi } \right) = {\left( {0.5T} \right)^{1/2}}\left\{ {\hat H\left( {\lambda ,\chi } \right) - {{\hat H}_0}\left( {\lambda ,\chi } \right)} \right\}\;.$$
To estimate the distance between ${S_T}\left( {\lambda ,\chi } \right)$
and zero for all possible values of
${S_T}\left( {\lambda ,\chi } \right)$
and zero for all possible values of $\lambda $
and
$\lambda $
and $\chi $
, Escanciano and Velasco (Reference Escanciano and Velasco2006) employ the Cramer-von Mises norm and obtain the
$\chi $
, Escanciano and Velasco (Reference Escanciano and Velasco2006) employ the Cramer-von Mises norm and obtain the $D_n^2$
statistics
$D_n^2$
statistics
 $$D_n^2 = \sum\limits_{j = 1}^{n - 1} {{{n - j} \over {{{\left( {j\pi } \right)}^2}}}} \sum\limits_{t = j + 1s}^n {\sum\limits_{ = j + 1}^n {\left( {{Y_t} - {{\bar Y}_{n - j}}} \right)} } \left( {{Y_s} - {{\bar Y}_{n - j}}} \right) \times {\rm{exp}}\left[ {{{({Y_{t - j}} - {Y_{s - j}})}^2}} \right]\;.$$
The null hypothesis of GS test is rejected when the value of $D_n^2$
is “relatively” large. For both DL and GS tests, we use three hundred and four hundred bootstrap samples, respectively, following previous literature.
$D_n^2$
is “relatively” large. For both DL and GS tests, we use three hundred and four hundred bootstrap samples, respectively, following previous literature.
GARCH-M model
According to the AMH, the trade-off between risk and expected return should also varies and not being static over time, as it is commonly understood in finance (Lo Reference Lo2012). Then, this relationship seems to hold over long periods of time, but not necessarily over shorter periods. To model volatility in the financial series considering the link between the risk and return of an asset, we employ the GARCH-M specification proposed by Engle, Lilien, and Robins (Reference Engle, Lilien and Robins1987) as follows:
 $${R_t} = {\mu}\; +\lambda {h_t} + {{\rm{\varepsilon }}_t}\;;\;{{\rm{\varepsilon }}_t}\;\sim N\;\left( {0,{h_t}} \right)\;$$
 $${h_t} = \omega + \beta {h_{t - 1}} + {\rm{\alpha \varepsilon }}_{t - 1}^2\;,$$
where ${R_t}$
is the asset return,
${R_t}$
is the asset return, ${h_t}$
is the conditional variance that represents the risk, and
${h_t}$
is the conditional variance that represents the risk, and ${\varepsilon _t}$
is the error term. Equation A.21 represents the relationship of a standard GARCH(1,1) specification. Thereby, a positive, significant coefficient λ represents the (traditional) risk-reward relation, whereas the negative significant coefficient characterizes the risk-punishment relation. That is why, in our empirical application we graph the t-stats instead of the p-values (as in the previous cases), to examine whether there was a positive or negative relationship between return and variance (risk) for each analyzed market.
${\varepsilon _t}$
is the error term. Equation A.21 represents the relationship of a standard GARCH(1,1) specification. Thereby, a positive, significant coefficient λ represents the (traditional) risk-reward relation, whereas the negative significant coefficient characterizes the risk-punishment relation. That is why, in our empirical application we graph the t-stats instead of the p-values (as in the previous cases), to examine whether there was a positive or negative relationship between return and variance (risk) for each analyzed market.


 Open access