


1. Introduction
The pioneering work of Worthington (Reference Worthington1908) displaying and describing liquid impacts onto pools initiated a century-long interest in characterising such impact phenomena. Understanding the intricacies of these events is relevant for a broad spectrum of situations in nature: the noise of rain (Prosperetti, Crum & Pumphrey Reference Prosperetti, Crum and Pumphrey1989) or the scent of earth after rain on a hot day (Joung & Buie Reference Joung and Buie2015); as well as in technology such as in inkjet printing (van der Bos et al. Reference van der Bos, van der Meulen, Driessen, van den Berg, Reinten, Wijshoff, Versluis and Lohse2014) or spray atomisation (Panão & Moreira Reference Panão and Moreira2005). Of particular interest has been air entrainment, cavity formation and collapse (Lee, Longoria & Wilson Reference Lee, Longoria and Wilson1997; Eggers et al. Reference Eggers, Fontelos, Leppinen and Snoeijer2007; Truscott, Epps & Belden Reference Truscott, Epps and Belden2014; Deka et al. Reference Deka, Ray, Biswas and Dalal2018; Eshraghi, Jung & Vlachos Reference Eshraghi, Jung and Vlachos2020). In general, cavity formation in pools begins when a jet impacts the free surface of the target and deflects its surface. This deflection occurs just before coalescence of the jet and the bath, as the local gas pressure builds up by the approaching liquid jet (Bouwhuis et al. Reference Bouwhuis, Hendrix, van der Meer and Snoeijer2015). Upon coalescence the inertia of the high-speed jet dominates the deflection and a hemispherical cavity is formed by the head of the jet (Speirs et al. Reference Speirs, Pan, Belden and Truscott2018). Due to its radial expansion, the cavity has a lamella shooting radially outwards, extending the walls of the cavity. The remainder of the jet impacts the base of the newly formed cavity and extends it primarily in the direction of travel, producing a slender cavity (Bouwhuis et al. Reference Bouwhuis, Hendrix, van der Meer and Snoeijer2015). In this process the kinetic energy of the jet is converted to potential surface energy and heat due to dissipation (Speirs et al. Reference Speirs, Pan, Belden and Truscott2018).
There is, however, a stark disparity in the amount of work done on projectiles in the millimetre regime (Engel Reference Engel1966; Pumphrey & Elmore Reference Pumphrey and Elmore1990; Rein Reference Rein1993; Oguz, Prosperetti & Kolaini Reference Oguz, Prosperetti and Kolaini1995; Barolo, Josserand & Bonn Reference Barolo, Josserand and Bonn2006; Yarin Reference Yarin2006; Aristoff & Bush Reference Aristoff and Bush2009; Zhang et al. Reference Zhang, Toole, Fezzaa and Deegan2012; Agbaglah & Deegan Reference Agbaglah and Deegan2014; Truscott et al. Reference Truscott, Epps and Belden2014; Fudge, Cimpeanu & Castrejón-Pita Reference Fudge, Cimpeanu and Castrejón-Pita2021) compared with projectiles in the micrometre regime (Bouwhuis et al. Reference Bouwhuis, Huang, Chan, Frommhold, Ohl, Lohse, Snoeijer and Van Der Meer2016; Speirs et al. Reference Speirs, Pan, Belden and Truscott2018; Quetzeri-Santiago et al. Reference Quetzeri-Santiago, Hunter, van der Meer and Fernandez Rivas2021; Quetzeri-Santiago & Rivas Reference Quetzeri-Santiago and Rivas2023). For cavities generated by projectiles in the millimetre range, collapse can be mainly attributed to the hydrostatic pressure (Oguz et al. Reference Oguz, Prosperetti and Kolaini1995). This implies that the Bond number ( $Bo = \rho _0 g D^2/ \gamma$) is greater than one (where $\rho _0$ and $\gamma$ are the density and surface tension of the liquid, $D$ is a relevant length scale and $g$ the acceleration due to gravity). The domain of interest for our work is in the micrometre regime, where collapse is driven by surface tension forces as $Bo \sim O(10^{-3})$. This regime is relevant in emerging technologies such as three-dimensional printing (Antkowiak et al. Reference Antkowiak, Audoly, Josserand, Neukirch and Rivetti2011), spray painting (Herczyński, Andrzej & Claude Reference Herczyński, Cernuschi and Mahadevan2011), extreme-ultraviolet lithography (Klein et al. Reference Klein, Bouwhuis, Visser, Lhuissier, Sun, Snoeijer, Villermaux, Lohse and Gelderblom2015), environmental aspects (Speirs, Belden & Hellum Reference Speirs, Belden and Hellum2023) and needle-free injection methods (Berrospe-Rodriguez et al. Reference Berrospe-Rodriguez, Visser, Schlautmann, Ramos-Garcia and Fernandez Rivas2016; Oyarte Galvez et al. Reference Oyarte Gálvez, Fraters, Offerhaus, Versluis, Hunter and Fernández Rivas2020; van der Ven et al. Reference van der Ven, Morrone, Quetzeri-Santiago and Rivas2023).
In this work, we looked into the dynamics of a high-speed microfluidic jet penetrating a pool. These jets are comparable in size and momentum to those produced in needle-free applications (Schoppink & Rivas Reference Schoppink and Rivas2022). A validation process was done through both qualitative and quantitative comparisons with other numerical results, experiments and theoretical predictions. In addition we quantified the cavity profile and closure time of the cavity as a function of relevant fluid parameters. Our numerical strategy provides the opportunity to examine a broad parameter space unconstrained from experimental limitations.
2. Methodology
2.1. Experimental details
A transparent cubic bath made of acrylic with dimensions of  $5~{\rm cm}\times 10~{\rm cm}\times 20$ cm was filled with water. High-speed jets were generated from a thermocavitation process and directed to impact a water pool. The set-up is similar to those used in Quetzeri-Santiago et al. (Reference Quetzeri-Santiago, Hunter, van der Meer and Fernandez Rivas2021) and Quetzeri-Santiago & Rivas (Reference Quetzeri-Santiago and Rivas2023). The thermocavitation process occurs inside a glass microfluidic chip filled with a Direct Red 81 solution in water at 0.5 wt%. In thermocavitation, an expanding bubble is created at the base of the chip, due to the energy transfer to the liquid from a continuous-wave laser. The expanding bubble pushes the liquid that is in front of it generating the jet (Oyarte Gálvez et al. Reference Oyarte Gálvez, Fraters, Offerhaus, Versluis, Hunter and Fernández Rivas2020). The jet velocity $U_0$ and diameter $R_j$ in these experiments ranged from $10$ to $40\ {\rm m}\ {\rm s}^{-1}$ and from $50$ to $100\ \mathrm {\mu }{\rm m}$, respectively. The surface tension of water is $\gamma = 0.072\ {\rm N}\ {\rm m}^{-1}$, its density $\rho _0 = 1000\ {\rm kg}\ {\rm m}^{-3}$ and its viscosity $\mu = 1$ cP. Thus, the Weber number $We = \rho _0 U_0^2 R_j /\gamma$, and the Reynolds numbers $Re = \rho _0 U_0 R_j / \mu$ range between 35–1333 and 500–4000, respectively. For all the experiments $Bo \sim O(10^{-3})$. The processes of bubble generation, jet ejection and impact on the liquid droplet were recorded with a Photron Fastcam SAX2 coupled with a $\times$ 2 Navitar microscope objective. A typical experiment duration was $\sim$5 ms and the camera resolution was set to $768 \times 328\ {\rm pixels}^2$ at a sample rate of $30\,000$ frames per second with an exposure time of $2.5\ \mathrm {\mu }{\rm s}$.
2.2. Numerical model
We consider a liquid jet impacting a pool of identical liquid with velocity  $U_0$. The jet is cylindrical with radius $R_j$ and length $L_j$ and is placed at a distance $S$ between the free surface level of the pool and the tip of the jet. The domain is axisymmetric and filled with ambient gas. The top, right and bottom boundaries have outflow conditions imposed with the pressure as $P = P_{\infty }$, zero normal velocity gradients (top and bottom, $\partial u_z/\partial z = 0$; right, $\partial u_r / \partial r = 0$) and zero shear stresses (top and bottom, $\partial u_r / \partial z = 0$; right, ${\partial u_z / \partial r = 0}$). Since we are studying jet impact in the micro-/millimetre regime, effects of gravity are neglected ( $g=0$) as hydrostatic effects are small (Quetzeri-Santiago et al. Reference Quetzeri-Santiago, Hunter, van der Meer and Fernandez Rivas2021).
The governing equations are non-dimensionalised with the initial radius of the jet  $R_j$ and the impact velocity of the jet $U_0$. Thus, time is non-dimensionalised as $t^*=tU_0/R_j$. For simplicity from now on we use $t^*=t$:
 $$\begin{gather} \frac{\partial U_i}{\partial X_i} = 0, \end{gather}$$
 $$\begin{gather}\frac{\partial
U_i}{\partial t } + U_0 \frac{U_i}{X_j} =
\frac{1}{\hat{\rho}}\left( -\frac{\partial P}{\partial X_i}
+ \frac{1}{Re}\frac{\partial(2\hat{\mu} {\mathsf{D}}_{ij})}{\partial
X_j} + \frac{1}{We}\kappa \delta_s n_i\right),
\end{gather}$$
$$\begin{gather}\frac{\partial
U_i}{\partial t } + U_0 \frac{U_i}{X_j} =
\frac{1}{\hat{\rho}}\left( -\frac{\partial P}{\partial X_i}
+ \frac{1}{Re}\frac{\partial(2\hat{\mu} {\mathsf{D}}_{ij})}{\partial
X_j} + \frac{1}{We}\kappa \delta_s n_i\right),
\end{gather}$$
which represent conservation of mass and momentum, respectively. Here  $U_i$ is the velocity vector, $P$ is the pressure, ${\mathsf{D}}_{ij}$ is the viscous stress tensor, $We = \rho U_0^2 R_j / \gamma$ is the Weber number and $Re = \rho _0 U_0 R_j / \mu$. The last term represents capillary effects, where $\kappa$ is the interface curvature. Ensuring that this term is handled at the liquid interface, the characteristic function $\delta _s$ is used. Lastly, $n_i$ is the normal to the interface. The geometric volume of fluid method is used to track the interfaces, with a volume of fluid tracer $\varPhi$ such that
 \begin{equation} \varPhi (x) = \begin{cases} 1, & \text{if } x \in \text{fluid phase}\\ 0, & \text{if } x \in \text{gas phase}. \end{cases} \end{equation}
Therefore, the one-fluid approximation is used in the momentum equation (2.2) by means of the following arithmetic equations:
 \begin{equation} \hat{A}(\varPhi) = \varPhi + (1-\varPhi) \frac{A_g}{A_l} \quad\forall A \in \{\rho, \mu\}. \end{equation}
The incompressible Navier–Stokes equations are solved using the finite-volume partial differential equation solver Basilisk C Popinet (Reference Popinet2009, Reference Popinet2018). With Basilisk, a variety of partial differential equations can be solved with parallelisation capabilities on an adaptive mesh refinement grid. An example of the mesh refinement used in this work can be seen in figure S1 in the supplementary material available at https://doi.org/10.1017/jfm.2024.320. This solver employs The Bell–Colella–Glaz (BCG) scheme (Bell, Colella & Glaz Reference Bell, Colella and Glaz1989), which is a robust second-order upwind scheme. In this scheme a projection method is used similar to Chorin (Reference Chorin1967) where the pressure and velocity solutions for (2.1) and (2.2) are decoupled. In this work, we use an improvement on Chorin's method, where we couple the projection and diffusion–convection steps by the BCG scheme. The projection method is also known as a fractional step method, where intermediate iterative steps are used to uncouple the pressure solution while maintaining a divergence-free velocity field.
2.3. Validation
Validation of the code was performed first qualitatively comparing simulations of a microfluidic jet impacting a liquid droplet with the experiments extracted from one of our previous works (Quetzeri-Santiago et al. Reference Quetzeri-Santiago, Hunter, van der Meer and Fernandez Rivas2021). Figures 1(b) and 1(c) illustrate the capabilities of the numerical technique to reproduce the traversing and embedding phenomena observed in the experiments. The numerical set-up is similar to that in figure 1, but instead of a deep pool we initialise a droplet with radius  $R_d$. Next, we tested the ability of the code to reproduce the traversing and embedding threshold obtained experimentally and reported in previous works (Quetzeri-Santiago et al. Reference Quetzeri-Santiago, Hunter, van der Meer and Fernandez Rivas2021). After the impact of a microfluidic jet onto a droplet a cavity is created and if the impact velocity is enough to overcome the surface tension of the droplet will traverse it completely. The critical Weber number for traversing the droplet $We_{crit} \approx 64({D_{drop}}/{2 D_{jet}})^{1/2}$ was found by comparing the Young–Laplace and dynamic pressures in the cavity. To assess the validity of $We_{crit}$, it was experimentally compared with the Weber number based on the jet inertia and the droplet surface tension $\gamma _d$, i.e. $We_{jet} = \rho _0 U_0^2 R_j/\gamma _d$, for a given Ohnesorge number $Oh = {\sqrt {We}}/{Re}$. In our simulations, we maintain a constant $Oh$ while varying $Re$, an unattainable condition for the experiments due to the inherent properties of liquids. Figure 1(b) shows excellent agreement between the experiments and simulations. Furthermore, simulations show that at $Re < 200$ the threshold increases and deviates from the experimental threshold which is lower than the prediction $We_{jet}/We_{crit} = 1$. This indicates that viscous dissipation can influence the traversing process for more viscous liquids than those used in the experiments.

Figure 1. (a) Numerical set-up for the study of a jet impact on a droplet. A liquid jet with radius  $R_j$ impacts, with a velocity $U_0$, viscosity $\mu _0$ and density $\rho _0$, a pool with height $H$ of the same liquid. (b) Phase diagram displaying the outcome of droplet penetration based on $Re$ and $We_{jet}/We_{crit}$, with the embedding cases as filled markers and traversing cases as open markers. The experimental data are curved in We–Re space, as it is probed for constant Ohnesorge numbers $Oh = {\sqrt {We}}/{Re}$. (c) Simulation results of a microfluidic jet impacting a droplet. When the jet has enough inertia to go through the droplet we name it traversing. In contrast, if the inertia is not enough, we call it embedding. (d) Experimental results showing the traversing and embedding of a microfluidic jet on a water droplet (Quetzeri-Santiago et al. Reference Quetzeri-Santiago, Hunter, van der Meer and Fernandez Rivas2021). Times are made non-dimensional by dividing by $R_j/U_0$.
To quantify the numerical convergence, the energy distribution over time is calculated. The supplementary material provides further details of the energy calculation. We show the energy allocation for different resolutions over the penetration time frame in a bar plot presented in figure S2 in the supplementary material. The energy is normalised by the total energy initially present at highest refinement ( $r_0 / \varDelta = 1024$). From this bar plot we draw multiple conclusions. First, we note that over time the total energy is not fully conserved, albeit that increasing the refinement does mitigate the losses. Therefore, we attribute this energy loss to be inherent to the numerical method. Regarding the distribution of energy the fractions are comparable, especially for the three highest refinements. This makes evident that the numerical process converges at resolution $(r_0 / \varDelta = 512)$.
3. Experimental results
Similarly to the case of the impact of a microfluidic jet onto a droplet, air is entrained when the jet impacts a deep liquid pool, and a cavity is formed (figure 2). The cavity continues expanding in both the radial and the  $z$ directions, until it collapses. Previous research shows that for $We \gg 1$ during the cavity expansion the process is inertial and the cavity adopts a slender shape (Bouwhuis et al. Reference Bouwhuis, Huang, Chan, Frommhold, Ohl, Lohse, Snoeijer and Van Der Meer2016). Upon reaching the maximum cavity size, interfacial tension starts to influence the cavity dynamics, as kinetic energy is converted into surface energy of the newly formed cavity. The time it takes to reach this regime is approximated by relating the dynamic pressure and the Young–Laplace pressure of the cavity (Quetzeri-Santiago et al. Reference Quetzeri-Santiago, Hunter, van der Meer and Fernandez Rivas2021). However, depending on the Weber number the cavity can collapse below the original position of the surface (deep seal; figure 2a) or from the top of surface (surface seal; figure 2b). The shapes of the cavities and bubbles entrapped are similar to those of impacts on capillary bridges (Quetzeri-Santiago & Rivas Reference Quetzeri-Santiago and Rivas2023). In these experiments we observe deep seal for $We \approx 35\unicode{x2013}200$, while surface seal is observed for $We \approx 300\unicode{x2013}400$ (see figure 2). We note that this transition is observed for a singular Bond number $Bo = 1.4 \times 10^{-3}$, as in the experiments the only parameter that was varied was the impact speed. These findings align with the regime map described in van der Ven et al. (Reference van der Ven, Morrone, Quetzeri-Santiago and Rivas2023), categorising them within the ‘splashing substrate’ region, specifically located at its leftmost boundary, considering a shear modulus $G$ of water equal to 0.

Figure 2. Snapshots of a liquid jet impacting a liquid pool. (a) Deep seal,  $We = 200$, the cavity collapses below the original position of the pool surface. (b) Close-up of the surface at the onset the surface seal, $We = 400$. A crown is formed before it collapses on itself. (c) Cavity evolution during surface seal. The cavity forms in a similar way to the deep seal case for $t< 0.6$ ms, but afterwards the whole cavity volume remains trapped as a bubble inside the liquid pool. Times are made non-dimensional by dividing by $R_j/U_0$.
In figure 3(a) we show simulation results of the cavity profile evolution of the impact of a cylindrical jet with uniform velocity onto a pool for  $We = [50\unicode{x2013}400]$, for constant $Re$ and $Bo$. Furthermore, $R_j= U_0 =\rho _0 = 1$, and are kept constant throughout the paper. Thus, the Weber number was varied by changing the surface tension, with $We = 1/\gamma$. For all the Weber numbers at $t = 30$ the cavity evolution is similar, and is inertia-dominated. However, at $t > 62$ a deviation from the profiles is observed. Similar to the experiments, for $We \approx 180$ a rim forms and propels the pool surface upward from its equilibrium surface level. The rim is thinner and shoots higher up as the Weber number increases. In contrast for $We < 150$, surface tension prohibits a slender rim from developing and from advancing above the equilibrium surface level. Now the rim of the cavity is flattened and develops into a spherical blob of liquid. Consequently, the seal mechanism differs in both cases; while for $We > 180$ the cavity closure is above the pool equilibrium surface level, the opposite is true for $We < 150$. Although the qualitative phenomena are similar between the experiments and simulations, the critical Weber number for transitioning from surface seal to deep seal is ${\approx }30\,\%$ lower in the simulations compared with the experiments. We also noticed that in our simulations, the point at which the deep seal pinches off is closer to the surface compared with what was observed in the experiments. Additionally, the upward jet resulting from the cavity collapse, i.e. a Worthington jet, observed in experiments for $We < 200$ is not reproduced in the simulations. We attribute these discrepancies to the uniform velocity across the jet in the simulations, which is not the case for the experiments. Furthermore, we note that the characteristics of cavity collapse and Worthington jet formation are influenced by small disturbances of the cavity and the shape of the jet plays a major role (Michon, Josserand & Séon Reference Michon, Josserand and Séon2017; Quetzeri-Santiago & Rivas Reference Quetzeri-Santiago and Rivas2023).

Figure 3. (a) Superposition of cavity profiles by cylindrical jets at  $Re = 2\times 10^4$, for different Weber numbers, indicating inverse relation between rim thickness and Weber number. (b) Simulation of jets with $We$ = 200, all starting with identical tip velocities but varying tail velocities. At times $t < 43$, the cavity is similar for all cases. Yet, at time $t = 73$, the cavity collapsed for the cases of $u_t/U_0 > 0.8$. At time $t = 492$, all cavities collapsed with a surface seal, but the cases of $u_t/U_0 \leqslant 0.2$. In general, jets with higher tail velocities exhibit earlier cavity collapse.
Indeed, in the experiments, due to the decelerating nature of the thermocavitation bubble expansion, the impacting jet exhibited a difference between the jet tail velocity  $u_t$ and the jet tip velocity $U_0$. The difference in velocity between the tip and the tail results in a Matryoshka effect, i.e. droplets reopening the cavity before it is closed, leading to a deeper pinch-off point (Hurd et al. Reference Hurd, Fanning, Pan, Mabey, Bodily, Hacking, Speirs and Truscott2015). Conversely, in our simulations, the velocity remained uniform throughout the entire jet. To bridge this gap, we conducted simulations in which, for simplicity, we implemented a linearly decreasing velocity gradient from the jet's tip to its tail. In this approach, we established the velocity at the tip of the jet as our reference point and systematically adjusted the tail's velocity to 10 %, 20 %, and so on, up to 100 % of the tip's velocity.
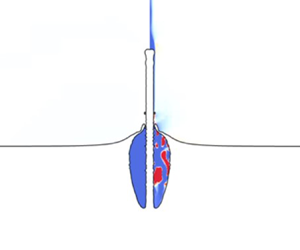
The outcomes of these simulations at  $We = 200$ imposing the aforementioned velocity profiles are depicted in figure 3(b). We note that higher tail velocities correlated with an earlier cavity collapse, as well as with a pinch-off point closer to the surface. Notably, when tail velocities ranged from 0.9 to 0.4 relative to the tip, the impact result manifested as a surface seal. In contrast, tail velocities in the range of 0.3 to 0.1 yielded a deep seal. Moreover, as observed in figure 4 we recover the deep seal phenomena, and particularly the Worthington jet observed in the experiments. Consequently, by incorporating a falling linear velocity gradient within our jet simulations, we not only achieved qualitative alignment with our experimental data on deep pools but also quantitatively replicated the transition from deep to surface seal (where $We$ was calculated using the jet tip velocity as the characteristic velocity). However, for simplicity, in the remainder of the discussion we keep the jets with uniform velocity distribution.

Figure 4. Jet impacting on a pool with  $We = 200$ and $u_t/U_0 = 0.3$. In this case the jet breaks into droplets before the cavity collapses, creating a Matryoshka effect. Furthermore, a Worthington jet similar to that of the experiments is recovered. The simulation shows the gas velocity field on the right-hand side of the snapshots.
4. Cavity dynamics model
When the cavity is formed, part of the kinetic energy of the jet transforms into surface energy by the creation of new surface. Thus, the free surface of the cavity has more surface energy than a pool in equilibrium. It is therefore energetically favourable for the interface to restore its rest state. In this way surface tension forces ( $F_\gamma$) counteract the radial expansion of a cavity induced by inertia. Nevertheless, liquid jet inertia drags gas inside the cavity. By using Bernoulli's principle, along a streamline extending from the outside of the surface to the inside, one notes that the gas density and velocity contribute to a pressure difference. Following the derivation from Eshraghi et al. (Reference Eshraghi, Jung and Vlachos2020):
 $$\begin{gather} \left[\tfrac{1}{2}\rho_g u_g^2 + P\right]_c = \left[\tfrac{1}{2}\rho_g u_g^2 + P\right]_{\infty}, \end{gather}$$
 $$\begin{gather}\Delta P = P_{\infty} - P_c \approx \tfrac{1}{2}\rho_g u_g^2, \end{gather}$$
where  $\rho _g$ and $u_g$ are the ambient gas density and velocity and $P$ is the air pressure at a point close to the rim $P_c$ and a point far away near the undisturbed surface of the pool $P_{\infty }$.
This gradient in pressure induces a force that pulls towards the centre where the pressure is lower. In the remainder of this work, we call this the Bernoulli suction force ( $F_{\Delta P}$).
To characterise the collapse time we model the trajectory of the rim of the cavity by considering the radial component of the surface tension force and Bernoulli suction force (see figure 5). We assume that the forces only act radially. This enables us to to find analytical expressions for the pinch-off time. However, in reality this is a simplification as it does not consider the rim to translate vertically.

Figure 5. Force diagram on the rim of the cavity and cavity parameters. The rim has a diameter  $2a$ and the forces acting to close the surface are the pressure gradient $F_{\Delta P}$ and the surface tension force $F_\gamma$.
The differential mass of the rim  $m = \rho {\rm \pi}a^2 r(t)\,{\rm d}\phi$, where we assume the rim to be circular in cross-section with $a$ the rim radius. This rim is subjected to two forces, the Bernoulli suction force $F_{\Delta P}$ and a surface tension force $F_\gamma$; thus, the rim equation of motion is (Eshraghi et al. Reference Eshraghi, Jung and Vlachos2020)
 $$\begin{gather} m \ddot{r} = F_{\Delta P} + F_{\gamma} ={-}2 a r(t) \,{\rm d}\phi \Delta P(t) -4\gamma a \,{\rm d}\phi, \end{gather}$$
 $$\begin{gather}\ddot{r} ={-}\frac{2 \Delta P}{\rho_g {\rm \pi}a} - \frac{4\gamma}{\rho_g a r(t)}, \end{gather}$$
where  $\ddot {r}$ is the rim acceleration, $r(t)$ is the rim position from the centre of impact at any time, $\Delta P = P_{\infty } - P_c$ is the pressure gradient and $\phi$ is the radial coordinate. To get an analytical solution for the radial coordinate of the rim, we look into the limits where one force is negligible, which we explore in the next sections.
4.1. Radial surface tension regime
To explain the pinch-off time for  $We \sim 1$, we neglect the Bernoulli suction force $F_{\Delta P}$ and assume the only force driving the collapse is the surface tension acting in the horizontal coordinate. Therefore, this problem reduces to that of the collapse of a liquid ring and follows the ideas of Texier et al. (Reference Texier, Piroird, Quéré and Clanet2013). Since the Reynolds number $Re \gg 1$, viscous dissipation can be neglected and we can use potential flow to describe the dynamics. Using mass conservation and that the pressure is governed by the Laplace law, we arrive to the following equation for the evolution of $r$ (Texier et al. Reference Texier, Piroird, Quéré and Clanet2013):
 \begin{equation} \frac{{\rm d} (r \dot{r})}{{\rm d}t} \ln \left(\frac{r+a}{r}\right) + \frac{\dot{r}^2}{2} \left(\frac{r^2}{(r + a) ^2} - 1\right) ={-}\frac{\gamma}{\rho_0 r}\left( 1 + \frac{r}{r+a}\right) . \end{equation}
 Assuming that the thickness of the ring is constant, due to volume conservation  $ra$ is also constant (Texier et al. Reference Texier, Piroird, Quéré and Clanet2013). Therefore, we can linearise equation (4.5), considering that $r\gg a$ during most of the time of the closure, and that we take time for the cavity collapse from the moment it reached its maximum radius $r_{max}$, obtaining
 \begin{equation} \ddot{r} ={-} \frac{2 \gamma}{\rho_0 r_{max} a_0}, \end{equation}
where  $a_0$ is the rim radius at $r_{max}$. By integrating (4.6) and using $t = 0$ as the time from which the cavity collapse starts, then the initial expansion velocity $\dot {r} = 0$ and $r = r_{max}$; thus,
 \begin{equation} r(t) = r_{max} - \frac{\gamma}{\rho_0 r_{max} a_0} t^2. \end{equation}
Therefore, the closure time is
 \begin{equation} t_c = \sqrt{\frac{\rho_0 r_{max}^2 a_0}{\gamma}}. \end{equation}
 We note that  $r_{max}$ is reached at a time $t_{\gamma } \approx \rho _0^2 R_j^3 U_0^3 / \gamma$ when the surface tension starts to make the rim move towards the centre of the cavity (Bouwhuis et al. Reference Bouwhuis, Hendrix, van der Meer and Snoeijer2015; Quetzeri-Santiago et al. Reference Quetzeri-Santiago, Hunter, van der Meer and Fernandez Rivas2021). Furthermore, the cavity radius evolves as $R(z,t) \approx R_j (U_0 t + z)^{1/2}$ (Bouwhuis et al. Reference Bouwhuis, Hendrix, van der Meer and Snoeijer2015). Substituting $t_\gamma$ in the last equation we get
 \begin{equation} r_{max} \sim \frac{\rho_0 R_j^2 U_0^2}{\gamma} = R_j We. \end{equation}
 We confirm this linear relation for  $We < 180$ by performing simulations as shown in figure 6(a). Noting that $a_0 \sim \gamma$, we obtain
 \begin{equation} t_c \sim r_{max} \sim We . \end{equation}
Figure 6. (a) Maximum radius of the cavity  $r_{max}$ scaled by the radius of the jet $R_j$ as a function of the Weber number. Here $r_{max} \sim We$ for the deep seal regime. (b) The relation between the radius of the rim $a$ and the Weber number, where $a \sim We^{-1}$. The radii are taken just before pinch-off. These simulations were performed for $Re = 20\,000$.
4.2. Bernoulli suction regime
For  $We \gg 1$, the contribution of surface tension to the collapse can be neglected, and is dominated by the Bernoulli suction force, using (4.2) and (4.4) (Eshraghi et al. Reference Eshraghi, Jung and Vlachos2020):
 $$\begin{gather} \ddot{r} ={-}\frac{2 \Delta P}{\rho_g {\rm \pi}a} ={-} \frac{u_g^2}{{\rm \pi} a} ={-}c_1, \end{gather}$$
 $$\begin{gather}r(t=t_{c}) ={-}\tfrac{1}{2}c_1 t_{c}^2 + \dot{r_0} t_{c} + r_0 = 0. \end{gather}$$
Solving (4.12) we get the time for cavity pinch-off:
 \begin{equation} t_{c} = \frac{\dot{r_0}\pm \sqrt{\dot{r_0}^2 + 2 c_1 r_0}}{c_1} \sim \frac{\dot{r_0} a}{u_g^2}, \end{equation}
where we considered that the initial cavity radius  $r_0 \approx 0$. In this regime as shown in figure 3, the cavity radius evolves similarly for all Weber numbers up to times $t \approx 60$; thus, $\dot {r_0} \not \sim We$. In the simulations we tracked the gas velocity and we observed that $u_g$ remains relatively constant within a 10 % margin before impact for $We > 200$ (see figure S3 in the supplementary material). Furthermore, as shown in figure 6, by tracking $a$ in terms of the Weber number we show that $a \sim We^{-1}$. Therefore,
 \begin{equation} t_{c} \sim We^{{-}1}. \end{equation}
4.3. Model comparison with simulations
Figure 7(a–c) shows the collapse time in terms of the Weber number for three different Reynolds numbers (or pool viscosities), where the Weber number was varied by changing the surface tension with  $R_j = U_0 = \rho _ 0 = 1$. Here we observe that in all the cases the closure time reaches a maximum and then it decreases. This can be explained by a collapse regime transition from capillary-dominated to air-suction-dominated. Indeed, in figure 7(a–c) we show that the scalings obtained in (4.10) and (4.14) match very well with the simulations. Here we also notice that for a Reynolds number $Re = 2 \times 10^3$, the maximum time of closure is $\approx$40 % shorter than for the potential flow case. This can be attributed to a smaller radial extension due to viscous dissipation. In contrast, for $We = 600$ and $Re = 2000$, the time of collapse is $\approx$50 % larger than for the potential flow. Here we argue that viscosity delays the rim and upward sheet formation, slowing down overall the closure dynamics. Since (4.14) and (4.10) do not depend on $Re$, we expect that the transition from a capillary deep seal to the pressure-driven surface seal does not depend on $Re$. Figure 7 shows that the transition occurs at $We \approx 180$ for all the explored $Re$, confirming the closure time independence from $Re$. This transition is within the same order of magnitude as that predicted by Aristoff & Bush (Reference Aristoff and Bush2009) for solid spheres for $Bo \leqslant 3$. We note that the difference between the predicted value of Aristoff & Bush (Reference Aristoff and Bush2009) and the present results might be due to the fact that the transition depends on the sphere density and size, with the surface seal transition proportional to the sphere size (Eshraghi et al. Reference Eshraghi, Jung and Vlachos2020).

Figure 7. (a–c) Dependency of the time of closure  $t_c$ on the Weber number $We$, for different Reynolds numbers $Re$. The black diamonds correspond to the simulation data points. The dotted black line correspond to a spline through the simulation data. The red and blue dotted lines correspond to the approximations given by (4.10) and (4.14). The general trend is similar for each Reynolds number. We observe a global maximum for the time of closure where the two regimes meet. (d–f) Superposition of cavity profiles by cylindrical jets at $Re = 5\times 10^3$ and $We = 50$, varying the ambient gas density $\rho _g$ from four times to one-quarter of that of atmospheric air. Here we observe that the time of cavity collapse decreases with increasing air density.
4.4. Effect on ambient gas density
From our discussion in § 4.2, we would expect that the variation in pressure gradient would determine the time of collapse. Given that the pressure gradient is dominated by the ambient gas density, we expect that an increase in gas density decreases the time of cavity collapse. For  $We = 50$, an increase in four times the gas density with respect to the ambient pressure, $\rho _g = 4$, results in a cavity collapse at $t \approx 131$, as shown by figure 7(d–f). In contrast, for gas densities at ambient pressure $\rho _g = 1$ and under ambient pressure $\rho _g = 0.5$, the cavity collapses at $t \approx 236$ and $t \approx 266$, respectively. These results are in line with research on water entry of a sphere at reduced ambient pressures (Gilbarg & Anderson Reference Gilbarg and Anderson1948; Abelson Reference Abelson1970; Yakimov Reference Yakimov1973). Furthermore, in the recent work of Williams et al. (Reference Williams, Sprittles, Padrino and Denissenko2022), it was found that the most important gas parameter influencing the lamella ejection is the gas density. Although, in the latter, air density prevents cavity collapse by resisting the contact line movement (Williams et al. Reference Williams, Sprittles, Padrino and Denissenko2022).
4.5. Gas velocity during the impact process
To conclude our analysis of the closure dynamics upon the impact of a liquid jet, we examined the maximum gas velocity  $u_{g,max}$ at each instant for $We = 50$, $150$ and $400$. These Weber numbers show representative cases of deep and surface seals. Our results indicate that there are three peaks in $u_{g,max}$. These peaks occur in three instants: (I) just before impact, (II) during cavity closure and (III) when droplets are shed after cavity collapse, regardless of the Weber number (see figure 8).

Figure 8. Maximum simulated gas velocity for different Weber numbers, at  $Re = 10\,000$. Roman numbers I, II and III highlight velocity peaks in the gas phase and correspond to the times just before impact, cavity collapse and droplet ejection after cavity collapse. (I) Simulation snapshot of the jet just before impacting the liquid pool. This peak is observed for all $We$ at $t \approx 4$. (II) Simulation snapshots of the moment of cavity collapse for $We = 150$ and $We = 400$. (III) Simulation snapshot of $We = 400$ at the time of droplet ejection after cavity collapse. The simulation snapshots show the gas pressure (left-hand side) and the magnitude of the gas velocity field (right-hand side).
The highest value of  $u_{g,max}$ is observed at the moment of cavity closure, which is the largest for the highest Weber number. Additionally, we found that $u_{g,max}$ remains relatively constant within a 10 % margin before impact for $We > 200$ (see figure S3 in the supplementary material). The latter observation indicates that the gas is displaced by the jet at a constant velocity prior to the impact, for the cases where a surface seal is formed.
Figure 8 illustrates simulation snapshots. In these images, the gas pressure field is depicted on the left, while the velocity field is shown on the right. Notably, in figure 8(II) for  $We = 400$, a low-pressure region forms within the cavity, whereas this phenomenon is not observed for $We = 50$ and $150$. This observation supports the hypothesis that the pressure gradient, rather than capillary forces, drives cavity closure in surface seals, while capillary forces dominate in deep seals.
5. Conclusions
We investigated the dynamics of high-speed microfluidic jet impacts on a liquid pool, focusing on the formation and collapse of cavities in the micrometre regime. Previous research primarily explored millimetre-scale projectiles at high Bond numbers, where cavity dynamics is determined by the interplay between hydrostatic pressure and gas inertia. In contrast, in this paper, we delved into the range of micrometre-sized projectiles, where the Bond number is low and the interplay between surface tension and gas inertia governs the cavity closure dynamics.
Our experimental set-up involved generating high-speed jets from thermocavitation. The resulting jets impacted a water pool, enabling us to qualitatively and quantitatively examine the cavity formation and closure in a parameter range that has not been previously explored. The numerical simulations we employed provided us with the freedom to explore a wide range of parameter combinations, unconstrained by experimental limitations.
Comparing our experimental and numerical results, we observed two distinctive regimes of cavity closure: capillary-driven and air-suction-driven. In the capillary-dominated regime  $We \leqslant 150$, surface tension played a predominant role, and we obtained analytical expressions that indicated a closure time scaling with $We$ (4.10). In the air-suction-dominated regime $We \geqslant 180$, the initial velocity of expansion was the crucial factor, and the closure time scaled inversely with We (4.14).
Our findings revealed that the transition from capillary-driven to air-suction-driven closure occurred around  $We \approx 180$ for the range of Reynolds numbers considered. This transition point was independent of Reynolds number, indicating an inertia-dominated phenomenon, where viscous dissipation is negligible. However, it would be interesting to test these ideas numerically and experimentally on a wider range of values for both the Reynolds and Bond numbers.
Our results also shed light on the intricate interplay between gas density and cavity collapse dynamics. We tracked the maximum gas velocity and pressures for the whole impact process. We observed that the largest maximum gas velocity was attained at the moment of cavity collapse. We found other peaks in maximum velocity values at instants just before jet impact and when droplets are shed after cavity collapse. These insights into micrometre-scale cavity formation and closure offer valuable knowledge for applications like three-dimensional printing and needle-free injections, and pollutant distribution transport.
Supplementary material
Supplementary material is available at https://doi.org/10.1017/jfm.2024.320.
Acknowledgements
We thank U. Gutiérrez-Hernández and B.D. Fudge for valuable discussions.
Funding
This research was funded by the European Research Council (ERC) under the European Union Horizon 2020 Research and Innovation Programme (grant agreement no. 851630). M.A.Q.-S. acknowledges support from DGAPA through Subprograma de Incorporación de Jóvenes Académicos de Carrera (SIJA).
Declaration of interests
The authors report no conflict of interest.


 Open access