


1. Introduction
Laminar boundary layer separation commonly occurs in the adverse pressure gradient region on wings (Mueller & DeLaurier Reference Mueller and DeLaurier2003) and turbine blades (Hodson & Howell Reference Hodson and Howell2005) that operate at low chord Reynolds numbers ( $\textit {Re}_c<5\times 10^5$, Carmichael Reference Carmichael1981). Laminar separation often decreases the maximum attainable lift-to-drag ratio (Lissaman Reference Lissaman1983). In the separated laminar shear layer, growth rates of unstable disturbances are significantly higher than in the attached boundary layer, leading to accelerated transition (Dovgal, Kozlov & Michalke Reference Dovgal, Kozlov and Michalke1994; Watmuff Reference Watmuff1999). Transition in the separated shear layer may be followed by reattachment if the increase in wall-normal momentum transport within the turbulent shear layer is sufficient to overcome the adverse pressure gradient (Gaster Reference Gaster1967). The resulting region of mean recirculating flow between the locations of separation and reattachment is called a laminar separation bubble (LSB) (Tani Reference Tani1964). In the forward part of an LSB, often termed the dead-air region, the flow is essentially steady and reverse flow magnitudes are relatively small (Horton Reference Horton1968). In contrast, reverse flow magnitudes in the turbulent aft portion of an LSB are larger and the flow is highly unsteady due to quasi-periodic shedding of spanwise roll-up vortices (Horton Reference Horton1968; Watmuff Reference Watmuff1999; Häggmark, Bakchinov & Alfredsson Reference Häggmark, Bakchinov and Alfredsson2000). These spanwise vortices rapidly break down into turbulence near the location of reattachment due to the effects of global (Rodríguez & Theofilis Reference Rodríguez and Theofilis2010) instabilities, secondary (Marxen, Lang & Rist Reference Marxen, Lang and Rist2013) instabilities or the superposition of oblique disturbance waves (Michelis, Yarusevych & Kotsonis Reference Michelis, Yarusevych and Kotsonis2018).
The origins of the roll-up vortices shed in the aft portion of the LSB can be traced back to the convective amplification of Tollmien–Schlichting waves in the boundary layer upstream of separation if the neutral stability point is reached before the onset of the adverse pressure gradient (Diwan & Ramesh Reference Diwan and Ramesh2009; Michelis, Yarusevych & Kotsonis Reference Michelis, Yarusevych and Kotsonis2017). In the region of adverse pressure gradient, the presence of an inflection point in the streamwise velocity profile causes the Kelvin–Helmholtz instability to progressively become the dominant disturbance amplification mechanism in the separated flow (Pauley, Moin & Reynolds Reference Pauley, Moin and Reynolds1990; Watmuff Reference Watmuff1999; Diwan & Ramesh Reference Diwan and Ramesh2009). Nonlinear disturbance interactions become significant when the amplitudes of streamwise velocity fluctuations reach 10 %–20 % of the free-stream velocity (Dovgal et al. Reference Dovgal, Kozlov and Michalke1994; Watmuff Reference Watmuff1999) near the location of vortex roll-up (Kirk & Yarusevych Reference Kirk and Yarusevych2017).
Owen & Klanfer (Reference Owen and Klanfer1953) classified the LSBs forming on airfoil sections as either short or long, according to their length compared with the airfoil chord. Relative to the surface pressure distribution over an airfoil in fully attached flow, short LSBs produce only a local change in the pressure distribution. In contrast, long LSBs produce a global change in the pressure distribution, leading to a substantial loss of lift and increase of drag (Tani Reference Tani1964). Due to a relatively small change in operating conditions, a short LSB may abruptly become a long LSB. This phenomenon is termed bursting, defined as a substantial decrease in lift compared with inviscid flow for a small change in operating conditions (Mitra & Ramesh Reference Mitra and Ramesh2019). Bursting may also result in complete failure of the separated flow to reattach (Owen & Klanfer Reference Owen and Klanfer1953). Bursting can occur as a result of a decrease in Reynolds number (Gaster Reference Gaster1967), increase in the angle of attack (i.e. increase in adverse pressure gradient, Gaster Reference Gaster1967) or a reduction in the initial amplitudes of disturbances (Marxen & Henningson Reference Marxen and Henningson2011).
Experiments have shown that the distance between separation and transition is similar before and after bursting (Gaster Reference Gaster1967; Horton Reference Horton1969). Thus, bursting can be viewed as a failure of the separated shear layer to reattach (Owen & Klanfer Reference Owen and Klanfer1953; Horton Reference Horton1969). The characteristics of vortical structures produced during the transition process play an important role in the reattachment process, and their characteristics are different between short and long LSBs. Whereas the large-scale spanwise roll-up vortices formed in short LSBs lead to enhanced wall-normal momentum transfer, the smaller-scale three-dimensional vortical structures that form during transition in long LSBs are less effective for enabling reattachment (Marxen & Henningson Reference Marxen and Henningson2011). Numerical simulations have shown that bursting occurs when three-dimensional disturbances in the aft part of the bubble grow to levels sufficient to break up the shear layer roll-up vortices, reducing their spanwise coherence at formation (Marxen & Henningson Reference Marxen and Henningson2011). Consequently, in long LSBs, the rate of turbulent kinetic energy production is reduced (Serna & Lazaro Reference Serna and Lazaro2015).
Due to the deleterious effects of LSB bursting on the performance of wings and airfoils, the description and prediction of the conditions under which bursting occurs has been the focus of multiple investigations (Owen & Klanfer Reference Owen and Klanfer1953; Gaster Reference Gaster1967; Horton Reference Horton1969; Diwan, Chetan & Ramesh Reference Diwan, Chetan and Ramesh2006; Serna & Lazaro Reference Serna and Lazaro2015; Mitra & Ramesh Reference Mitra and Ramesh2019). A widely used condition for bursting was developed by Gaster (Reference Gaster1967), who correlated the momentum thickness Reynolds number at separation ( $\textit {Re}_{\theta _s}=u_{es}\theta _s/\nu$, where $\theta _s$, $u_{es}$ and $\nu$ are the momentum thickness at separation, edge velocity at separation and kinematic viscosity, respectively) to a pressure gradient parameter ( $P=(\theta _s^2/\nu )(\Delta u_e/\Delta x)$, where $\Delta u_e/\Delta x$ is the mean edge velocity gradient over the length of the LSB in a theoretical attached flow). However, the correlation of Gaster (Reference Gaster1967) has been shown not to be valid in general, because bursting is also dependent on the specific trajectory of the LSB in the $\textit {Re}_{\theta _s}\unicode{x2013}P$ plane (e.g. Diwan et al. Reference Diwan, Chetan and Ramesh2006). Horton (Reference Horton1969) developed a semi-empirical model to predict LSB length and bursting under the assumption that the distance between separation and transition is solely a function of $\textit {Re}_{\theta _s}$ and by using the momentum and energy integral equations to estimate the pressure rise possible between transition and reattachment. In this model, bursting occurs for a short LSB when the turbulent shear layer is unable to overcome the pressure rise required for reattachment (Horton Reference Horton1969). A single parameter bursting criterion was proposed by Diwan et al. (Reference Diwan, Chetan and Ramesh2006) who argued that the maximum height of the separation streamline ( $h$) and the mean edge velocity gradient of the real viscous flow are the relevant length and time scales to formulate a non-dimensional pressure gradient parameter ( $P=(h^2/\nu )(\Delta u_e/\Delta x)$) to determine bursting. This formulation of $P$ was supported by the identification of the velocity profile inflection point being located below the separation streamline as a necessary condition for bursting (Diwan Reference Diwan2009). A simplification of the criterion developed by Diwan et al. (Reference Diwan, Chetan and Ramesh2006) was suggested by Mitra & Ramesh (Reference Mitra and Ramesh2019), who proposed that bursting occurs when the boundary layer edge velocity at reattachment is less than $86\,\%$ of the edge velocity at separation. This simplification is based in part on experimental observations that LSB aspect ratio ( $h/\Delta x$) increases to approximately $1/14$ prior to bursting (Mitra & Ramesh Reference Mitra and Ramesh2019). Alternatively, Serna & Lazaro (Reference Serna and Lazaro2015) proposed that bursting occurs when the pressure difference across the reattachment region is larger than the pressure difference across the radius of the mean reverse flow vortex.
Neglected in the preceding bursting criteria, but having a substantial influence on LSB development, is the disturbance environment (e.g. Simoni et al. Reference Simoni, Lengani, Ubaldi, Zunino and Dellacasagrande2017; Istvan & Yarusevych Reference Istvan and Yarusevych2018; Hosseinverdi & Fasel Reference Hosseinverdi and Fasel2019). Experiments and numerical simulations have shown that bursting can occur if the initial amplitudes of disturbances fall below a certain amplitude (Marxen & Henningson Reference Marxen and Henningson2011; Yarusevych & Kotsonis Reference Yarusevych and Kotsonis2017). Conversely, an increase in disturbance amplitudes, either through free-stream turbulence (e.g. Simoni et al. Reference Simoni, Lengani, Ubaldi, Zunino and Dellacasagrande2017; Istvan & Yarusevych Reference Istvan and Yarusevych2018) or controlled forcing (e.g. Marxen & Henningson Reference Marxen and Henningson2011; Yarusevych & Kotsonis Reference Yarusevych and Kotsonis2017) decreases the size of an LSB. When subject to controlled forcing, disturbance growth rates are reduced relative to those in the unforced flow (Yarusevych & Kotsonis Reference Yarusevych and Kotsonis2017). Consequently, when forced disturbances are removed, transition and reattachment are delayed and the LSB overshoots its unforced length as the flow returns to the unforced state (Yarusevych & Kotsonis Reference Yarusevych and Kotsonis2017). As a result of this overshoot, the transient associated with cessation of disturbances is longer than the transient associated with the introduction of disturbances (Yarusevych & Kotsonis Reference Yarusevych and Kotsonis2017).
Although much effort has been focused on determining whether a short or long LSB will form under a given set of steady operating conditions, the evolution of an LSB between short LSB, long LSB and fully separated states is an inherently unsteady process that has received significantly less attention. Previous studies of LSBs in unsteady flows have found differences in LSB structure and dynamics from those observed during quasi-steady changes in operating conditions. In an accelerating free stream or during an increase in angle of attack, separation, transition and reattachment are delayed and the shear layer vortex shedding frequency is reduced relative to quasi-steady conditions (Brendel & Mueller Reference Brendel and Mueller1988; Ellsworth & Mueller Reference Ellsworth and Mueller1991; Nati et al. Reference Nati, de Kat, Scarano and van Oudheusden2015) due to a reduction in adverse pressure gradient (Ericsson & Reding Reference Ericsson and Reding1988). Conversely, relative to quasi-steady conditions, a decelerating free-stream velocity or reduction in angle of attack leads to expedited separation, transition and reattachment and an increase in vortex shedding frequency.
Previous experimental work by the authors has investigated the transients of LSB formation and bursting on a two-dimensional airfoil model undergoing relatively slow changes in free-stream velocity to trigger LSB formation and bursting (Toppings & Yarusevych Reference Toppings and Yarusevych2023). The time required to reach a quasi-steady state after LSB bursting was measured to be longer than that required after LSB formation, due to overshoot of the angle between the separated shear layer and the airfoil surface after LSB bursting. The transient LSB bursting process on a two-dimensional airfoil undergoing a small change in angle of attack was studied numerically by Alferez, Mary & Lamballais (Reference Alferez, Mary and Lamballais2013), who observed a delay between the change in angle of attack and LSB bursting of approximately  $10$ global convective time units. The timing of the rapid downstream movement of the reattachment point and loss of lift agreed well with the bursting criterion of Diwan et al. (Reference Diwan, Chetan and Ramesh2006). Prior to bursting, Alferez et al. (Reference Alferez, Mary and Lamballais2013) reported a transient increase in lift and drag, whose timing and duration were highly sensitive to initial conditions.
Due to the abrupt changes in aerodynamic loads, bursting presents a challenge to the design of safe and efficient aircraft and turbo-machines that operate at low Reynolds numbers. In these applications, three-dimensional end effects are also present. Away from the wing tip, the LSB on a finite wing is analogous to the LSB forming on the same two-dimensional airfoil section at the same effective angle of attack (Bastedo & Mueller Reference Bastedo and Mueller1986; Toppings, Kurelek & Yarusevych Reference Toppings, Kurelek and Yarusevych2021). Three-dimensional effects on LSB structure are largely limited to the regions within approximately  $0.5c$ of the root and tip (Marchman & Abtahi Reference Marchman and Abtahi1985; Toppings & Yarusevych Reference Toppings and Yarusevych2021), where spanwise flow draws fluid into the recirculation region (Toppings & Yarusevych Reference Toppings and Yarusevych2022). Furthermore, a more rapid transition is expected near the wing root, where disturbances from the often turbulent boundary layers at the root region are convected into the LSB (Toppings & Yarusevych Reference Toppings and Yarusevych2022). In proximity to the wing tip, laminar separation is suppressed (Chen, Qin & Nowakowski Reference Chen, Qin and Nowakowski2013; Awasthi, Moreau & Doolan Reference Awasthi, Moreau and Doolan2018), and shear layer vortex shedding ceases, delaying transition (Toppings & Yarusevych Reference Toppings and Yarusevych2021). However, in the region where vortex shedding occurs, the shedding frequency remains largely invariant to changes in effective angle of attack along the span, and the vortices are largely two dimensional at formation (Toppings & Yarusevych Reference Toppings and Yarusevych2021). Wing tip and root effects on LSBs have been documented in steady flows, but little is known about the effect of finite aspect ratio on the unsteady process of LSB formation and bursting.
The objectives of this study are to compare the dynamics of LSB formation and bursting on a nominally two-dimensional airfoil and a finite wing, to characterise the unsteady aerodynamic forces produced during LSB formation and bursting, and to relate the aerodynamic forces to the flow field development. To achieve these objectives, wind tunnel experiments were performed on a two-dimensional airfoil model and a finite wing model. The models were subjected to ramp changes in free-stream velocity that triggered LSB formation and bursting due to the corresponding change in Reynolds number. Synchronised direct-force and particle image velocimetry (PIV) measurements were performed to elucidate the physical mechanisms responsible for the transient aerodynamic forces produced during the changes in free-stream velocity.
2. Experimental methods
2.1. Model and facility
Wind tunnel tests were undertaken on two-dimensional airfoil and finite wing models in the closed-loop wind tunnel at the University of Waterloo. Over the range of Reynolds numbers considered, the turbulence intensity was measured to be less than  $0.29\,\%$. The free-stream velocity in the test section was monitored by a single normal hotwire anemometer located at the exit of the tunnel's 9 : 1 contraction.
The NACA 0018 wing model had a chord length of  $c={0.2}\ {\rm m}$ and a span of ${0.5}\ {\rm m}$, corresponding to an aspect ratio of $2.5$. To convert the wing model into a nominally two-dimensional airfoil, an extension was added to the end of the wing so that the model spanned the entire test section, as illustrated in figure 1. Both the wing model and the extension were machined from a single block of acrylic and hand polished. Data are presented in a surface attached coordinate system with the origin located at the wing root leading edge, the positive $x$ axis tangent to the suction surface, the positive $y$ axis normal to the suction surface and the positive $z$ axis parallel to the span. Data from the surface-tangent top-view PIV configuration is presented in a chord-based coordinate system, where the $X$ axis is parallel to the model chord.

Figure 1. Coordinate system definitions and PIV measurement plane orientations.
Ramp changes in Reynolds number were produced by varying the wind tunnel's fan speed. Figure 2 presents ensemble-averaged hotwire measurements of the ramp changes in free-stream velocity used to cause LSB formation and bursting on the wing model due to the change in Reynolds number. The reference velocity used to form the non-dimensional convective time scale ( $t\overline {\widetilde {u_\infty }}/c$) is the average of the initial and final velocities for each ramp. Because the LSB bursting Reynolds number depends on the angle of attack ( $\alpha$), three different sets of free-stream ramp changes were performed, as summarised in table 1. For all angles of attack, the initial and final Reynolds numbers were separated by approximately $2\times 10^4$, so that spontaneous LSB formation or bursting did not occur at the limiting Reynolds numbers, and were chosen such that LSB formation or bursting on the two-dimensional model occurred approximately halfway between the limiting Reynolds numbers during quasi-steady changes in free-stream velocity. The same limiting Reynolds numbers were used for all measurements at $\alpha ={5}^{\circ }$ and ${6}^{\circ }$ to facilitate comparisons between the two-dimensional airfoil and wing models at similar geometric and effective angles of attack.

Figure 2. Ramp change in free-stream velocity for  $\alpha ={3}^{\circ }$ $\cdots \cdot$, $\alpha ={5}^{\circ }$ and ${6}^{\circ }$ —, and $\alpha ={9}^{\circ }$ – –. Note that the ensemble standard deviation is of the order of the line thicknesses.
Table 1. Reynolds number ranges for free-stream velocity ramp changes.

The duration of the ramps down was limited by the time required for the wind tunnel fan to coast down from the higher limiting free-stream velocity to the lower limiting free-stream velocity. The duration of the ramp up at each angle of attack was set to match the duration of the ramp down at the same angle of attack. Because the duration of the ramp changes was limited by the inertia of the fan, the ramp changes occurred over a greater number of convective time scales for the higher angles of attack where the Reynolds number was higher, as shown in figure 2. Thus, the non-dimensional accelerations ( $ac/u_\infty ^2$, table 1) were also lower for higher angles of attack. The largest non-dimensional acceleration, occurring at an angle of attack of $\alpha ={6}^{\circ }$, was less than $0.011$. Therefore, the change in streamwise pressure gradient due to the acceleration of the free stream during the ramp changes is assumed to be insignificant, and transient changes in the flow field are ascribed primarily to the effects of LSB formation or bursting (Toppings & Yarusevych Reference Toppings and Yarusevych2023).
2.2. Measurement techniques
2.2.1. Lift force
The finite wing and two-dimensional airfoil models were mounted on a 6-axis JR3 30E12A4 load cell for direct-force lift measurements. The resolution in lift force was  ${0.005}\ {\rm N}$, and the absolute accuracy was within ${0.1}\ {\rm N}$. Due to the relatively small magnitudes and large uncertainties of drag force measurements under the conditions investigated, only lift measurements are considered in the present work. Lift measurements were taken over an ensemble of $160$ increasing and decreasing ramp changes in free-stream velocity for the finite wing at an angle of attack of $6^\circ$, and $40$ increasing and decreasing ramp changes in free-stream velocity for all other angles of attack and model configurations. Quasi-steady lift measurements were performed over the Reynolds number range of each ramp change in Reynolds number increments of approximately $700$. For each quasi-steady lift measurement, the flow was allowed to stabilise for ${20}\ {\rm s}$ before the lift force was recorded for a period of ${60}\ {\rm s}$. To investigate lift hysteresis, quasi-steady lift measurements were performed for both increasing and decreasing Reynolds numbers. All lift measurements were taken at a sampling frequency of 10 000 Hz and low-pass filtered at 10 Hz to attenuate structural vibrations.
2.2.2. Particle image velocimetry
Particle image velocimetry measurements were performed on the finite wing at an angle of attack of  ${6}^{\circ }$ and two-dimensional airfoil at angles of attack of ${6}^{\circ }$ and ${5}^{\circ }$ during the imposed ramp changes in free-stream velocity. The angles of attack for PIV measurements on the two-dimensional airfoil were chosen to match the geometric angle of attack and the effective angle of the wing root region, respectively, on the finite wing. All PIV measurement planes (figure 1) were surveyed separately. The PIV measurements were also taken in steady free-stream conditions at $\textit {Re}_c=5.4\times 10^4$ and $\textit {Re}_c=7.4\times 10^4$. To improve the statistical convergence of ensemble-averaged quantities obtained from transient side-view PIV measurements, temporal averaging with a window length of $5c/\overline {\widetilde {u_\infty }}$ was applied. The overall trends in time-dependent statistics were found to be largely unaffected for window lengths between $2c/\overline {\widetilde {u_\infty }}$ and $8c/\overline {\widetilde {u_\infty }}$.
A summary of the parameters of the PIV system used in this study is provided in table 2. For all PIV measurements, the flow was seeded with water–glycol fog particles with a diameter of approximately  ${1}\ {\mathrm {\mu }}{\rm m}$ that were illuminated with a Photonics DM20-527 Nd:YLF pulsed laser. The laser sheet thickness was approximately ${2}\ {\rm mm}$. Particle image preprocessing was performed using sliding temporal minimum subtraction and local intensity normalisation. The correlation statistics method (Wieneke Reference Wieneke2015) was used to estimate the uncertainty in the resulting vector fields due to random errors. Vector fields were calculated using a multi-pass cross-correlation algorithm with window deformation in the LaVision DaVis 10 software (Scarano & Riethmuller Reference Scarano and Riethmuller2000). During transient ramp changes in free-stream velocity, PIV measurements were triggered to start 0.5 s before the wind tunnel fan was commanded to start changing speed. At each measurement plane for the side-view and top-view PIV configurations, an ensemble of $20$ recordings were obtained for both increasing and decreasing ramp changes in free-stream velocity.
Table 2. The PIV parameters.

In the side-view PIV configuration, measurements were taken in  $z$-normal planes at $z/c=0.25$, $0.63$, $1.13$ and $1.75$ for the finite wing, and at $z/c=1.13$ and $1.75$ on the two-dimensional airfoil, as illustrated in figure 1. The side-view PIV measurements employed two LaVision Imager sCMOS $5.5$ megapixel cameras in a side-by-side arrangement with 200 mm focal length lenses and aperture settings of $f/2$. The camera sensors were cropped to a resolution of $2560\ \text {px}\times 1024\ \text {px}$, and their combined field of view spanned $0.28\leq x/c \leq 0.98$ and $0\leq y/c \leq 0.11$. Particle images were taken in double-frame mode with a frame separation of ${50}\ {\mathrm {\mu }}{\rm s}$ at a sampling rate of ${52.33}\ {\rm Hz}$. For measurements of the limiting flow states under steady free-stream conditions, $1500$ samples were acquired at each measurement plane for a total sampling time of ${28.66}\ {\rm s}$. During transient ramp changes in free-stream velocity, recordings of $523$ samples at each measurement plane were obtained for a total sampling time of ${9.99}\ {\rm s}$. For velocity vector calculations, the initial and final interrogation window sizes were $24\ \text {px}\times 24\ \text {px}$ and $16\ \text {px}\times 16\ \text {px}$, respectively. With $75\,\%$ window overlap, the resulting velocity fields have a vector pitch of 0.12 mm. The uncertainty in instantaneous velocity measurements from the side-view PIV measurements along the core of the separated shear layer is estimated to be $5\,\%$ and $6\,\%$ of the free-stream velocity for the streamwise ( $u$) and wall-normal ( $v$) velocity components, respectively, at a confidence level of $95\,\%$.
In the top-view PIV configuration, measurements were taken in a single plane tangent to but offset from the suction surface of the finite wing and two-dimensional airfoil (figure 1). The minimum distance between the top-view measurement plane and the model surface was approximately 8 mm. The top-view PIV measurements employed three LaVision Imager sCMOS  $5.5$ megapixel cameras in a side-by side arrangement with ${50}\ {\rm mm}$ focal length lenses and aperture settings of $f/2$. The combined field of view spanned $0.27\leq x/c \leq 1$ and $0\leq z/c \leq 2.50$. Particle images were taken in double-frame mode with a frame separation of ${100}\ {\mathrm {\mu }}{\rm s}$ at a sampling rate of ${25.03}\ {\rm Hz}$. For measurements of the limiting flow states under steady free-stream conditions, $1500$ samples were acquired for a total sampling time of ${28.66}\ {\rm s}$. During each ramp change in free-stream velocity, $250$ samples were obtained for a total sampling time of ${9.99}\ {\rm s}$. For velocity vector calculations, the initial and final interrogation window sizes were $64\ \text {px}\times 64\ \text {px}$ and $24\ \text {px}\times 24\ \text {px}$, respectively. With $75\,\%$ window overlap, the resulting velocity fields have a vector pitch of ${0.40}\ {\rm mm}$. The uncertainty due to random errors in instantaneous measurements of the streamwise ( $u$) and spanwise ( $w$) velocity components in the vicinity of the separated shear layer was estimated to be less than $6\,\%$ and $5\,\%$ of the free-stream velocity, respectively, at a confidence level of $95\,\%$.
Note that although the field of view of top-view PIV measurements on the two-dimensional airfoil is restricted to  $z/c<2.5$, the two-dimensional airfoil model extends across the entire width of the test section up to $z/c=3.0$. Thus, the midspan of the airfoil model is located at $z/c=1.5$.
2.3. Data processing techniques
To investigate the dynamics of the transition process, a continuous wavelet transform was applied to the wall-normal velocity fluctuations from side-view PIV measurements, quantifying the wavenumbers of disturbances that lead to vortex shedding from the separated shear layer. The wall-normal velocity fluctuations ( $v'$) were extracted at the $y$ location corresponding to the boundary layer displacement thickness. The continuous wavelet transform of $v'(x)$ is defined as (Lilly Reference Lilly2017)
 \begin{equation} \psi\left(\xi,s\right)=\int_{-\infty}^{\infty}\frac{1}{s}\varPsi^*\left(\frac{x-\xi}{s}\right)v'\left(x\right){{\rm d}x}, \end{equation}
where  $\varPsi ^*$ is the complex conjugate of the mother wavelet function, $\xi$ is the translation in space and $s$ is the wavelet scale. In this work, the Morse wavelet with a duration of $3.87$ and a symmetry parameter of $3$ is used as the mother wavelet (e.g. Lilly & Olhede Reference Lilly and Olhede2012). The ensemble-averaged wavelet amplitude ( $\widetilde {|\psi |}$) plotted in the scalograms in figures 16 and 17 was computed by averaging the absolute value of the wavelet transform magnitude over the ensemble of $20$ ramp changes in free-stream velocity and over a sliding temporal window of length $5c/\overline {\widetilde {u_\infty }}$.
3. Results
3.1. Aerodynamic forces
Transient ensemble-averaged lift coefficients ( $\widetilde {C_L}$) are plotted in figure 3 for the first $100$ convective time scales after initiation of the ramp changes in free-stream velocity for each model configuration and angle of attack. At a geometric angle of attack of $\alpha ={6}^{\circ }$, the effective angle of attack at the wing root is reduced to approximately ${5}^{\circ }$ as shown by Toppings et al. (Reference Toppings, Kurelek and Yarusevych2021). To provide a comparison between the wing and the airfoil models at similar effective angles of attack, the lift coefficients from the wing at $\alpha ={6}^{\circ }$ (solid lines) and the airfoil at $\alpha ={5}^{\circ }$ (dashed lines) are both presented in figure 3(e).

Figure 3. Ensemble-averaged lift coefficient versus time. Blue lines: ramp up; red lines: ramp down. Shaded areas represent ensemble r.m.s. lift coefficient fluctuations. Dashed lines in (e) are from the airfoil at  $\alpha ={5}^{\circ }$. (a) Airfoil $\alpha =3^\circ$. (b) Airfoil $\alpha =6^\circ$. (c) Airfoil $\alpha =9^\circ$. (d) Wing $\alpha =3^\circ$. (e) Wing $\alpha =6^\circ$. (f) Wing $\alpha =9^\circ$.
At each angle of attack, the lift coefficient of the wing is expectedly lower than that of the airfoil for both limiting flow states, and changes in lift coefficient during the ramp changes in free-stream velocity are more gradual for the wing. As the angle of attack is increased from  $\alpha ={3}^{\circ }$ to ${9}^{\circ }$, the difference in lift coefficient between the limiting flow states increases, a trend which is observed for both the airfoil and wing. During the ramp up in free-stream velocity at a given angle of attack, a period of rapidly increasing lift coefficient occurs at similar times for the airfoil and wing models. However, the time at which the most rapid decrease in lift coefficient occurs during the ramp down is shifted to earlier times for the wing relative to the airfoil. For the airfoil and wing at $\alpha ={6}^{\circ }$ and ${9}^{\circ }$ (figure 3b,c,e,f), the most rapid changes in the ensemble-average lift coefficient occur simultaneously with a notable change in the level of ensemble root-mean-square (r.m.s.) lift coefficient fluctuations (shaded regions). The change in r.m.s. lift coefficient fluctuations suggests that these changes in ensemble-average lift coefficient are indicative of boundary layer reattachment or stall during the ramp up or ramp down cases, respectively (e.g. Broeren & Bragg Reference Broeren and Bragg2001).
The asymmetry between the time histories of the lift coefficients for the ramps up and ramps down is evidence of hysteresis in the reattachment and stall processes, which is most notable for the airfoil. For all cases, the lift coefficient takes longer to settle to the stalled limiting state during the ramp down in free-stream velocity than it does to settle to the reattached limiting state during the ramp up in free-stream velocity. For the airfoil at  $\alpha ={9}^{\circ }$, the limiting stalled state was not reached within the data acquisition period after the ramp down. Although the imposed ramp changes in free-stream velocity are virtually monotonic, non-monotonic changes in lift coefficient are observed during the ramp down in free-stream velocity for the airfoil at $\alpha ={6}^{\circ }$ and ${5}^{\circ }$ (figure 3b,e) within $50\leq t\overline {\widetilde {u_\infty }}/c \leq 75$, where local maxima of the lift coefficient occur. A local maximum also occurs for the wing at $\alpha =6^\circ$ (figure 3e) near $t\overline {\widetilde {u_\infty }}/c=40$. A similar local maximum in the lift coefficient time history was observed by Kiefer et al. (Reference Kiefer, Brunner, Hansen and Hultmark2022) for an airfoil during the dynamic stall process after a transient increase in angle of attack at significantly higher Reynolds numbers. The initial reduction in lift during dynamic stall is associated with the shedding of a dynamic stall vortex (DSV) from the leading edge shear layer (e.g. Mulleners & Raffel Reference Mulleners and Raffel2013). After the DSV is shed, a second weaker leading edge vortex forms (Rosti, Omidyeganeh & Pinelli Reference Rosti, Omidyeganeh and Pinelli2016). The formation and shedding of the second vortex is associated with a transient increase and decrease in lift, respectively (Rosti et al. Reference Rosti, Omidyeganeh and Pinelli2016), and this mechanism is likely responsible for the local maximum in lift observed during the ramp down. This phenomenon is present to some extent for all cases considered here. Examination of individual runs for the airfoil at $\alpha ={9}^{\circ }$ revealed significant local maxima after the initial decrease in lift coefficient, and the absence of a local maximum in the ensemble-averaged lift coefficient during the ramp down for the airfoil $\alpha ={9}^{\circ }$ is the result of higher variability between runs at this angle of attack. Although not presented here for conciseness, non-monotonicity was also observed in the transient drag coefficients, with a local maximum in drag coefficient occurring at the same time as the initial decrease in lift coefficient, similar to that observed during dynamic stall at higher Reynolds numbers (Kiefer et al. Reference Kiefer, Brunner, Hansen and Hultmark2022).
To compare the transient lift coefficients to those measured in quasi-steady flow, the ensemble-averaged lift coefficients during the ramp changes in free-stream velocity as well as lift coefficients measured in a steady free stream are plotted versus Reynolds number in figure 4. Similar to the results of Zaman & McKinzie (Reference Zaman and McKinzie1991), no significant hysteresis is observed in the quasi-steady lift measurements (black markers) for either the finite wing or two-dimensional airfoil. An increase in the quasi-steady lift coefficient (black markers) and decrease in r.m.s. lift coefficient fluctuations (shaded grey region) with increasing Reynolds number is indicative of separated shear layer reattachment (Tani Reference Tani1964; Mitra & Ramesh Reference Mitra and Ramesh2019). This occurs at approximately  $\textit {Re}_c=6.2\times 10^4$, $6.6\times 10^4$, $6.7\times 10^4$ and $7.6\times 10^4$ for the airfoil at $\alpha ={3}^{\circ }$, ${5}^{\circ }$, ${6}^{\circ }$ and ${9}^{\circ }$, respectively. The observed increase in Reynolds number required for reattachment with increasing angle of attack is consistent with the results of previous two-dimensional airfoil studies at low Reynolds numbers where reattachment is linked to the formation of an LSB (Marchman Reference Marchman1987; Boutilier & Yarusevych Reference Boutilier and Yarusevych2012). On the wing (figure 4d–f), the increase of lift with increasing Reynolds number is noticeably more gradual (figure 4e,f), and no clear indication of sudden reattachment is observed at $\alpha ={3}^{\circ }$. For the wing at $\alpha ={6}^{\circ }$ and ${9}^{\circ }$ (figure 4e,f), reattachment and LSB formation can be inferred from the reduction in lift fluctuations that occurs near $\textit {Re}_c=7.7\times 10^4$ and $\textit {Re}_c=8.1\times 10^4$, respectively. This will be confirmed for the wing at $\alpha ={6}^{\circ }$ using PIV measurements in § 3.2.1. The increase in the stall Reynolds number for the wing relative to the airfoil at the same geometric angles of attack for $\alpha ={6}^{\circ }$ and ${9}^{\circ }$ is opposite of the change expected from the decrease of the effective angle of attack on the wing, and the underlying flow development will be explored in § 3.2.

Figure 4. Ensemble-averaged lift coefficient versus Reynolds number. Blue lines: ramp up; red lines: ramp down;  $\triangle$: quasi-steady for increasing $\textit {Re}_c$; $\triangledown$: quasi-steady for decreasing $\textit {Re}_c$. Shaded areas represent ensemble r.m.s. lift coefficient fluctuations. Dashed lines in (e) are from the airfoil at $\alpha ={5}^{\circ }$. (a) Airfoil $\alpha =3^\circ$. (b) Airfoil $\alpha =6^\circ$. (c) Airfoil $\alpha =9^\circ$. (d) Wing $\alpha =3^\circ$. (e) Wing $\alpha =6^\circ$. (f) Wing $\alpha =9^\circ$.
The transient lift coefficients during ramp changes in free-stream velocity (coloured lines) deviate substantially from the quasi-steady lift coefficients for the airfoil at all angles of attack (figure 4a–c). For angles of attack of  $\alpha ={5}^{\circ }$, ${6}^{\circ }$ and ${9}^{\circ }$ (figure 4b,c,e), the transient lift coefficients of the airfoil exhibit similar hysteresis, lagging their quasi-steady values in counter-clockwise hysteresis loops. Although a counter-clockwise hysteresis loop is also observed in the transient lift coefficient of the airfoil at $\alpha ={3}^{\circ }$ (figure 4a), a different relationship between the transient and quasi-steady lift coefficients is observed. At this relatively low angle of attack, the transient lift coefficient during the ramp up is greater than the quasi-steady lift for $5.7\times 10^4\leq Re_c\leq 6.2\times 10^4$. At low angles of attack, the adverse pressure gradient on the suction surface is expected to be weaker, and it is speculated that the increase in transient lift during the ramp up at the lowest angle of attack may be due to delayed separation resulting from the more favourable pressure gradient during free-stream acceleration. On the finite wing, both the quasi-steady and transient lift forces display a more gradual change with Reynolds number, and the differences between the two are largely within the experimental uncertainty.
The foregoing results pertain to a change in free-stream velocity that occurs over a time period of the order of  $100$ convective time scales at relatively low accelerations. Although the imposed changes in operating conditions are essentially quasi-steady, the lift coefficients display deviations from those in a steady free stream. To quantify the duration of the lift coefficient transients, the time period of the largest amplitude excursion from the quasi-steady lift coefficient was computed using the methodology illustrated in figure 5(a). Quasi-steady lift coefficients for the ramp up and ramp down were computed by linearly interpolating the quasi-steady lift coefficients at the instantaneous Reynolds number during the ramp change in free-stream velocity. The transient period ( $\Delta t_{transient}$) is defined as the time interval over which the lift coefficient in the transient flow continually deviates from the quasi-steady lift coefficient by more than twice the standard deviation of the quasi-steady lift estimates (shaded region in figure 5a) within the same time window.

Figure 5. (a) Methodology for calculating the transient period for a single ramp up (blue) and ramp down (red) for the airfoil at  $\alpha ={6}^{\circ }$. Shaded areas indicate two standard deviations of the quasi-steady lift coefficients. (b) Ensemble-averaged transient period for all investigated conditions. Error bars denote quartiles. Horizontal axis shifted for clarity.
For  $\alpha >{3}^{\circ }$, the ensemble-averaged transient periods for the airfoil, which range from $17c/\overline {\widetilde {u_\infty }}$ and $30c/\overline {\widetilde {u_\infty }}$, are substantially longer than those of the wing. These values are comparable to the mean stall delay period of $30c/\overline {\widetilde {u_\infty }}$ measured by Le Fouest, Deparday & Mulleners (Reference Le Fouest, Deparday and Mulleners2021) for an airfoil undergoing a quasi-steady increase in angle of attack. At moderate angles of attack ( $\alpha ={5}^{\circ }$ and ${6}^{\circ }$) the difference in transient times for the ramp up and ramp down are comparable. However, at $\alpha ={3}^{\circ }$ and ${9}^{\circ }$, there is a tendency for the stall transient to last longer than the reattachment transient. The relatively longer duration of the stall transient is consistent with previous studies that have observed longer stall transients than reattachment transients (e.g. Amitay & Glezer Reference Amitay and Glezer2002; Siauw et al. Reference Siauw, Bonnet, Tensi, Cordier, Noack and Cattafesta2010; Yarusevych & Kotsonis Reference Yarusevych and Kotsonis2017; Toppings & Yarusevych Reference Toppings and Yarusevych2023). The significant decrease in estimated transient period for the airfoil during the ramp up at $\alpha ={3}^{\circ }$ is attributed to the crossing of the quasi-steady and unsteady lift coefficients in the $\textit {Re}_c\unicode{x2013}C_L$ plane (figure 4a). For the wing, the ensemble-averaged transient periods range from $3c/\overline {\widetilde {u_\infty }}$ to $9c/\overline {\widetilde {u_\infty }}$. The shorter transient periods for the wing are consistent with the relatively small differences between the ensemble-averaged transient and quasi-steady lift coefficients seen for the wing in figure 4, and no significant differences between stalling and reattachment transients are observed. Thus, the presence of the wing tip mitigates transient deviations of the unsteady lift coefficient from a quasi-steady response, which will be shown in § 3.2.2 to stem from a more gradual progression of LSB formation and bursting across the span of the wing.
3.2. Flow field development
3.2.1. Limiting flow states
Flow field development over the airfoil at angles of attack of  $\alpha ={5}^{\circ }$ and ${6}^{\circ }$ and over the wing at $\alpha ={6}^{\circ }$ was studied in detail using PIV measurements during the ramp changes in free-stream velocity and in steady free-stream conditions at the limiting Reynolds numbers of $\textit {Re}_c=5.4\times 10^4$ and $7.4\times 10^4$.
The mean streamwise velocity field from top-view PIV measurements on the two-dimensional airfoil in a steady free stream at  $\textit {Re}_c=5.4\times 10^4$ and $\alpha ={6}^{\circ }$ is presented in figure 6(a). Outside of the regions influenced by end effects, the top-view measurement plane intersects the core of the separated laminar shear layer at $x/c\approx 0.33$. Between $x/c\approx 0.40$ and $0.90$, the top-view measurement plane is within the reverse flow region over the stalled airfoil, and negative $u$ velocities are measured. As the distance of the top-view measurement plane from the airfoil surface increases near the trailing edge, positive $u$ velocities are again observed for $x/c\gtrapprox 0.90$. The plotted streamlines show relatively two-dimensional flow at the locations of both side-view measurement planes ( $z/c=1.13$ and $1.75$), with larger three-dimensional effects present closer to the walls of the test section located at $z/c=0$ and $z/c=3$. The mean streamwise flow field for the airfoil at $\textit {Re}_c=5.4\times 10^4$ and $\alpha ={6}^{\circ }$ is qualitatively similar to that at $\alpha ={5}^{\circ }$ (figure 6c), but a decrease in the boundary layer separation angle reduces the measured extent of reverse flow.

Figure 6. Mean streamwise velocity fields of the limiting flow states from top-view PIV. Dashed white lines indicate side-view measurement planes. (a) Airfoil  $\alpha =6^\circ$. (b) Airfoil $\alpha =6^\circ$. (c) Airfoil $\alpha =5^\circ$. (d) Airfoil $\alpha =5^\circ$. (e) Wing $\alpha =6^\circ$. (f) Wing $\alpha =6^\circ$. Grey areas masked out due to noise from light reflections.
In a steady free stream at  $\textit {Re}_c=7.4\times 10^4$, no reverse flow is present in the top-view PIV measurements outside of the regions influenced by end effects for the airfoil at $\alpha ={6}^{\circ }$ and ${5}^{\circ }$ (figure 6b,d), but a corner separation (e.g. Gand et al. Reference Gand, Deck, Brunet and Sagaut2010) persists at the end-wall junction at $z/c=0$. The absence of reverse flow over most of the span is due to the relatively small maximum distance of the separated shear layer from the airfoil surface when an LSB forms.
For the wing at  $\textit {Re}_c=5.4\times 10^4$ and an angle of attack of ${6}^{\circ }$ (figure 6e), substantial tip effects are seen in the mean streamwise flow field for $z/c>2.0$. No reverse flow is measured for $z/c>2.0$, which suggests a reduction in the distance of the separated shear layer from the wing surface near the wing tip. The implied mean structure of the separated flow region, being thickest near the midspan and exhibiting spanwise flow towards the wing root and tip, is qualitatively similar to that previously reported for stalled cantilevered rectangular wings of aspect ratios between $1$ and $4$ (Neal & Amitay Reference Neal and Amitay2023). At $\textit {Re}_c=7.4\times 10^4$, the flow development on the wing is notably different from that on the airfoil. On the wing, a region of reduced streamwise velocity occurs near $z/c=1.13$ (figure 6f), implying an increase in the thickness of the LSB forming on the wing near the midspan, which will be confirmed later in this section using side-view PIV measurements. Excluding the difference in end conditions between the root and tip of the wing, the top-view PIV measurements over the midspan region of the wing are largely symmetric about the location $z/c=1.13$ for both limiting Reynolds numbers. Noting that the true midspan of the wing is at $z/c=1.25$, the shift of the symmetry location towards the wing root is consistent with the greater spanwise influence of the wing tip relative to the wing root on the separated flow (e.g. Neal & Amitay Reference Neal and Amitay2023).
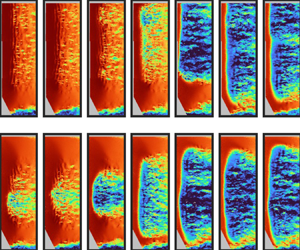
Using the side-view PIV configuration, LSB development on the wing and airfoil in steady free-stream conditions is illustrated in figure 7, which presents contours of mean streamwise velocity. The zero-net-streamwise mass flux line (Horton Reference Horton1968) is plotted to denote the wall-normal extent of recirculating flow. The locations of separation and reattachment were estimated by extrapolating the zero-net-streamwise mass flux line to the model surface. Because spanwise variations between the two side-view measurement planes on the airfoil are relatively minor compared with the wing, only the plane at  $z/c=1.75$ is presented for the airfoil. At $\textit {Re}_c=5.4\times 10^4$, the boundary layer separates upstream of the field of view and does not reattach on the airfoil or on the wing for $z/c\geq 0.63$ (figure 7a,c,e,g,i). For the wing at $z/c=0.25$, the influence of the wing root reduces the extent of separation due to spanwise flow (Toppings & Yarusevych Reference Toppings and Yarusevych2022), evidenced by the spanwise component of the streamlines in figure 6(e).

Figure 7. Mean streamwise velocity fields of the limiting flow states from side-view PIV. Solid lines: zero-net-streamwise mass flux line; dashed lines: intersection of top-view PIV measurement plane;  $\blacktriangle$: separation location; $\blacktriangledown$: reattachment location. Error bars indicate uncertainty interval ( $95\,\%$ confidence). (a) Airfoil $\alpha =6^\circ$ $z/c=1.75$ $Re_c=5.4\times 10^{4}$. (b) Airfoil $\alpha =6^\circ$ $z/c=1.75$ $Re_c=7.4\times 10^{4}$. (c) Airfoil $\alpha =5^\circ$ $z/c=1.75$ $Re_c=5.4\times 10^{4}$. (d) Airfoil $\alpha =5^\circ$ $z/c=1.75$ $Re_c=7.4\times 10^{4}$. (e) Wing $\alpha =6^\circ$ $z/c=1.75$ $Re_c=5.4\times 10^{4}$. (f) Wing $\alpha =6^\circ$ $z/c=1.75$ $Re_c=7.4\times 10^{4}$. (g) Wing $\alpha =6^\circ$ $z/c=1.13$ $Re_c=5.4\times 10^{4}$. (h) Wing $\alpha =6^\circ$ $z/c=1.13$ $Re_c=7.4\times 10^{4}$. (i) Wing $\alpha =6^\circ$ $z/c=0.63$ $Re_c=5.4\times 10^{4}$. ( j) Wing $\alpha =6^\circ$ $z/c=0.63$ $Re_c=7.4\times 10^{4}$. (k) Wing $\alpha =6^\circ$ $z/c=0.25$ $Re_c=5.4\times 10^{4}$. (l) Wing $\alpha =6^\circ$ $z/c=0.25$ $Re_c=7.4\times 10^{4}$.
At  $\textit {Re}_c=7.4\times 10^4$ (figure 7b,d,f,h, j,l), the separated shear layer reattaches to the airfoil and wing surfaces, forming an LSB. On the airfoil, as the angle of attack is reduced from $\alpha ={6}^{\circ }$ to $\alpha ={5}^{\circ }$ (figure 7b,d), there is a downstream shift in the locations of transition and reattachment, consistent with the established trend for LSBs on airfoils (e.g. Tani Reference Tani1964). For the same geometric angle of attack of $\alpha ={6}^{\circ }$, reattachment on the airfoil (figure 7b) occurs farther upstream compared with that on the wing in the region outside of direct root effects ( $z/c\geq 0.63$, figure 7f,h, j). The differences in the separation and reattachment locations on the airfoil for $\alpha ={5}^{\circ }$ and wing at $z/c=0.63$ for $\alpha ={6}^{\circ }$ are within the variations expected for a two-dimensional LSB (Miozzi et al. Reference Miozzi, Capone, Costantini, Fratto, Klein and Di Felice2019). Thus, the effective angle of attack at this location on the wing is approximately ${5}^{\circ }$, in agreement with lifting line results for the same geometry (Toppings et al. Reference Toppings, Kurelek and Yarusevych2021). Despite the expected monotonic decrease in effective angle of attack on the wing with increasing $z$, changes in the LSB thickness and the locations of separation and reattachment on the wing are non-monotonic for $0.63\leq z/c \leq 1.75$. At $z/c=1.13$ (figure 7h) there is a substantial increase in the distance of the separated shear layer from the wing surface, and the locations of separation and reattachment shift upstream and downstream, respectively. The presence of two separate regions of reverse flow below the separated shear layer in the PIV measurements suggests that spanwise flow not captured by the planar PIV measurements substantially alters the structure of the LSB at this location. Despite a further reduction in effective angle of attack at $z/c=1.75$ (figure 7f), the streamwise velocity contours of the LSB at this location largely resemble those seen at $z/c=0.63$, aside from a relatively small downstream shift in separation and reattachment locations. The decrease in LSB thickness near the wing root and tip relative to the midspan is consistent with the suppression of LSB formation due to tip effects observed at a higher Reynolds number ( $\textit {Re}_c=1.25\times 10^5$, Toppings & Yarusevych Reference Toppings and Yarusevych2022).
The momentum transfer across the shear layer due to velocity fluctuations as a result of transition is explored in figure 8, which presents contours of Reynolds shear stress ( $\overline {u'v'}$). The point of transition is indicated by the white markers, defined as the streamwise location where the Reynolds shear stress at $y=\delta ^*_x$ first exceeds the threshold of $0.001u_e^2$, where $u_e$ is the local boundary layer edge velocity and $\delta ^*_x$ is the displacement thickness of the $u$ velocity profile. Although this transition criterion based on the one used by Ol et al. (Reference Ol, McCauliffe, Hanff, Scholz and Kähler2005) and Hain, Kähler & Radespiel (Reference Hain, Kähler and Radespiel2009) depends on the threshold chosen, it is preferred in the present analysis because it is well defined for both reattaching and fully separated flow states. Other transition criteria used for LSBs that do not depend on an arbitrary threshold, such as the location of maximum displacement thickness (e.g. O'Meara & Mueller Reference O'Meara and Mueller1987) or maximum boundary layer shape factor (e.g. Kurelek, Kotsonis & Yarusevych Reference Kurelek, Kotsonis and Yarusevych2018), are not generally applicable when reattachment does not occur.

Figure 8. Reynolds shear stress fields of limiting flow states from side-view PIV. Solid lines: zero-net-streamwise mass flux line; dashed lines: intersection of top-view PIV measurement plane;  $\blacktriangle$: separation location; $\blacktriangledown$: reattachment location; white markers: transition location. Error bars indicate uncertainty interval ( $95\,\%$ confidence). (a) Airfoil $\alpha =6^\circ$ $z/c=1.75$ $Re_c=5.4\times 10^{4}$. (b) Airfoil $\alpha =6^\circ$ $z/c=1.75$ $Re_c=7.4\times 10^{4}$. (c) Airfoil $\alpha =5^\circ$ $z/c=1.75$ $Re_c=5.4\times 10^{4}$. (d) Airfoil $\alpha =5^\circ$ $z/c=1.75$ $Re_c=7.4\times 10^{4}$. (e) Wing $\alpha =6^\circ$ $z/c=1.75$ $Re_c=5.4\times 10^{4}$. (f) Wing $\alpha =6^\circ$ $z/c=1.75$ $Re_c=7.4\times 10^{4}$. (g) Wing $\alpha =6^\circ$ $z/c=1.13$ $Re_c=5.4\times 10^{4}$. (h) Wing $\alpha =6^\circ$ $z/c=1.13$ $Re_c=7.4\times 10^{4}$. (i) Wing $\alpha =6^\circ$ $z/c=0.63$ $Re_c=5.4\times 10^{4}$. ( j) Wing $\alpha =6^\circ$ $z/c=0.63$ $Re_c=7.4\times 10^{4}$. (k) Wing $\alpha =6^\circ$ $z/c=0.25$ $Re_c=5.4\times 10^{4}$. (l) Wing $\alpha =6^\circ$ $z/c=0.25$ $Re_c=7.4\times 10^{4}$.
For both the airfoil and the wing, substantially higher maximum values of Reynolds shear stress occur at  $\textit {Re}_c=7.4\times 10^4$ than at $\textit {Re}_c=5.4\times 10^4$ for $z/c>0.25$, enabling reattachment at the higher Reynolds number. In all cases, the transition point shifts upstream as the Reynolds number is increased. The largest upstream shift in transition location occurs on the wing at $z/c=1.13$, where there is notably earlier growth of Reynolds shear stress at $\textit {Re}_c=7.4\times 10^4$. The relatively large distance between transition and reattachment compared with the distance between separation and transition on the wing at $z/c=1.13$ is a typical feature of long LSBs (Marxen & Henningson Reference Marxen and Henningson2011). In contrast to the other spanwise locations on the wing, a reduction in the maximum Reynolds shear stress with increasing Reynolds number occurs for the wing at $z/c=0.25$. This reduction is attributed to a reduction in disturbance growth rates when separation is almost entirely suppressed near the wing root at the higher Reynolds number (figure 7l).
3.2.2. Transient flow development
The transient flow development over the airfoil and wing during the ramp changes in free-stream velocity between Reynolds numbers of  $5.4\times 10^4$ and $7.4\times 10^4$ is examined in this section. The discussion focuses on a comparison of the flow over the wing at $\alpha ={6}^{\circ }$ to the airfoil at ${5}^{\circ }$, because the effective angle of attack near the wing root is approximately equal to ${5}^{\circ }$, and the resulting mean LSB size and location on the wing at $z/c=0.63$ is most similar to that on the airfoil at $\alpha ={6}^{\circ }$ (figure 7). Contours of instantaneous streamwise velocity are plotted for single runs of the transient reattachment and stalling processes during the ramp up and ramp down in free-stream velocity in figures 9 and 10, respectively. The corresponding complete sequences of instantaneous streamwise velocity measurements are available in supplementary movies 1 and 2 available at https://doi.org/10.1017/jfm.2024.321.

Figure 9. Instantaneous snapshots of streamwise velocity during ramp up of free-stream velocity. Black lines in (c) indicate the time instants of the snapshots in (a,b). Grey areas masked out due to noise from light reflections. Full sequence available in supplementary movie 1. (a) Airfoil  $\alpha =5^\circ$. (b) Wing $\alpha =6^\circ$. (c) Reynolds number.

Figure 10. Instantaneous snapshots of streamwise velocity during ramp down of free-stream velocity. Black lines in (c) indicate the time instants of the snapshots in (a,b). Grey areas masked out due to noise from light reflections. Full sequence available in supplementary movie 2. (a) Airfoil  $\alpha =5^\circ$. (b) Wing $\alpha =6^\circ$. (c) Reynolds number.
At the beginning of the ramp up, the recirculation region downstream of boundary layer separation contains a turbulent flow of slow-moving fluid over the majority of the span in the top-view PIV measurements on the wing and airfoil (figure 9). For the airfoil, the observed recirculation region extends up to approximately  $0.1c$ from the test section wall at $z/c=0$ (figure 9a). On the wing, the recirculation region is suppressed near the wing root for $z/c<0.15$ and near the wing tip for $z/c>2.2$ (figure 9b). As the free-stream velocity increases, the recirculation region contracts in its spanwise extent on both the airfoil and wing. For the wing during $0< t\overline {\widetilde {u_\infty }}/c<50$, the contraction occurs primarily from the wing tip. The increase in velocities measured within the turbulent flow region that occurs for the airfoil between $t\overline {\widetilde {u_\infty }}/c=29$ and $t\overline {\widetilde {u_\infty }}/c=42$, and for the wing between $t\overline {\widetilde {u_\infty }}/c=42$ and $t\overline {\widetilde {u_\infty }}/c=54$ suggests a reduction in the distance of the separated shear layer from the model surface. For the airfoil, a notable change in the flow field occurs between $t\overline {\widetilde {u_\infty }}/c=42$ and $t\overline {\widetilde {u_\infty }}/c=54$, where the streamwise velocity rapidly increases over the entire recirculation region. In contrast, a more gradual progression towards the reattaching limiting state is observed for the wing.
In the reattaching limiting state, spanwise bands of increased velocity are observed for the airfoil, which are associated with spanwise vortex shedding from the LSB (e.g. Kurelek, Lambert & Yarusevych Reference Kurelek, Lambert and Yarusevych2016). On the wing, similar but shorter bands are seen near the edges of the central region of low-velocity turbulent flow because of the local increase in LSB thickness at  $z/c\approx 1.13$ (figure 7h) that shifts the formed vortices above the plane of top-view measurements.
For the ramp down in free-stream velocity (figure 10), the flow field development is essentially reversed. On both the airfoil and wing, the ramp down begins with the LSB formed on the suction surface, and spanwise vortex shedding from the LSB being visible in the top-view measurements. As the free-stream velocity decreases, a substantial region of turbulent reverse flow appears on the airfoil at  $t\overline {\widetilde {u_\infty }}/c=54$ (figure 10a), which subsequently spreads towards the test section wall at $z/c=0$. On the wing, the transient flow field is characterised by an earlier cessation of reattachment near the midspan and a gradual spreading of the region of low-velocity turbulent flow towards the root and tip in the measurement plane.
To qualitatively explore repeatable features of the spanwise progression of LSB formation and bursting, contours of the minimum streamwise velocity versus spanwise location and time are presented in figure 11 for the ensemble-averaged top-view PIV measurements. The minimum is taken over  $x$ for each PIV snapshot. The regions of negative streamwise velocity illustrated by the two lowest contour levels can be used to roughly approximate the spanwise extent of the region where reattachment does not occur. For the airfoil during the ramp up in free-stream velocity (figure 11a), largely spanwise uniform LSB formation is indicated at $t\overline {\widetilde {u_\infty }}/c\approx 45$ by the relatively abrupt increase in minimum streamwise velocity across the span of the PIV measurements. During the ramp down for the airfoil (figure 11b), a more gradual decrease in minimum streamwise velocity occurs in the region influenced by end effects ( $z/c<1$). For the wing during the ramp up (figure 11c), there is a slow initial contraction in the spanwise extent of the separation region beginning from the wing tip for $0\leq t\overline {\widetilde {u_\infty }}/c\leq 45$, before a relatively abrupt cessation of reverse flow at $t\overline {\widetilde {u_\infty }}/c\approx 50$ for $0.5\leq z/c \leq 1.7$. In contrast, stall on the wing occurs more gradually, beginning near $z/c=1.13$ at $t\overline {\widetilde {u_\infty }}/c=25$ and spreading towards the wing root and tip (figure 11d).

Figure 11. Contours of minimum ensemble-averaged streamwise velocity during ramp up (a,c) and ramp down (b,d) in free-stream velocity for the airfoil (a,b) and wing (c,d). (a) Airfoil  $\alpha =5^\circ$ $Re_c \uparrow$. (b) Airfoil $\alpha =5^\circ$ $Re_c\ \downarrow$. (c) Wing $\alpha =6^\circ$ $Re_c\ \uparrow$. (d) Wing $\alpha =6^\circ$ $Re_c\ \downarrow$. (e) Lift coefficient $Re_c \uparrow$. (f) Lift coefficient $Re_c\ \downarrow$. (g) Reynolds number $Re_c\ \uparrow$. (h) Reynolds number $Re_c \downarrow$.
The ensemble-averaged top-view PIV measurements also display evidence of spanwise-travelling disturbances in the recirculation region. Because the streamwise velocity contours in figure 11 are plotted against spanwise position and time, spanwise-travelling disturbances appear as diagonal streaks in the contour plots. Specifically, diagonal bands of increased streamwise velocity are seen to originate from the edge of the recirculation region closest to the test section side wall at  $z/c\approx 0.5$ after LSB bursting on both the airfoil at $t\overline {\widetilde {u_\infty }}/c=60$ (figure 11b) and on the wing at $t\overline {\widetilde {u_\infty }}/c=38$ (figure 11d). When the spanwise-travelling disturbance on the wing reaches the side of the recirculation region closest to the wing tip ( $z/c\approx 1.75$, $t\overline {\widetilde {u_\infty }}/c\approx 45$), there is a temporary pause in the spanwise expansion of the recirculation region towards the wing tip. This event temporally aligns with a transient increase in the ensemble-averaged lift coefficient (figure 11f). On the airfoil, a transient increase in lift is observed as the spanwise-travelling region of faster moving fluid reaches the midspan of the airfoil at $t\overline {\widetilde {u_\infty }}/c\approx 65$. As noted in the discussion of figure 3, the transient increase in lift is associated with the formation of a vortex from the leading edge shear layer. The spanwise motion of the region of faster moving flow on the wing from the root towards the tip suggests that leading edge vortex growth occurs more slowly near the wing tip, similar to the results of Visbal & Garmann (Reference Visbal and Garmann2019b). The delayed increase in velocity at the midspan of the airfoil associated with the spanwise-travelling disturbance is consistent with the merging of two adjacent arch vortices as observed in the numerical simulations of Visbal & Garmann (Reference Visbal and Garmann2019b) for an airfoil between side walls with $0.02c$ gaps, similar to the gaps between the airfoil and test section side walls in the present study. The presence of these spanwise-travelling disturbances in the ensemble-average data suggests that they are characteristic of the LSB bursting process under these conditions.
Since the inherent run-to-run variability in the LSB formation and bursting processes leads to smearing in ensemble averages, it is also informative to consider the top-view results for a single ramp up or down of the free-stream velocity. Minimum streamwise velocity contours, analagous to those of the ensemble-average in figure 11, are plotted for single runs in figures 12(a) and 12(b), and the corresponding instantaneous and ensemble-averaged lift coefficients are plotted in figures 12(c) and 12(d). The results from the single ramp up presented largely resemble those of the ensemble average (figure 11c). However, intermittent reverse flow is also present near the midspan after the end of the ramp up because the measurement plane intersects the turbulent shear layer at this location. The abrupt increase in velocity that occurs over a wide portion of the span at  $t\overline {\widetilde {u_\infty }}/c=55$ corresponds to an abrupt increase in instantaneous lift coefficient near the same time as the most rapid increase in the ensemble-averaged lift coefficient (figure 11c). The minimum streamwise velocity contours for the single ramp down (figure 12b) exhibit a notable decrease in the spanwise extent of reverse flow near $t\overline {\widetilde {u_\infty }}/c=43$. As in the ensemble-averaged results, a spanwise-travelling region of relatively faster fluid forms near the wing root at $z/c=0.5$, $t\overline {\widetilde {u_\infty }}/c=35$ and propagates towards the wing tip as the separated flow region expands. As the region of faster fluid reaches the outboard end of the separated flow region, a transient contraction of the spanwise extent of reverse flow occurs. This contraction is accompanied by a local maximum in lift coefficient (figure 12d), indicative of the formation of a leading edge vortex. Subsequently, the separated flow region expands back towards the wing tip as the leading edge vortex is shed and the flow settles to the limiting stalled state. For both the ramp up and ramp down, the reduction in the spanwise width of the region of reverse flow correlates with an increase in the lift coefficient.

Figure 12. Contours of minimum streamwise velocity (a,b), lift coefficient (c,d) and Reynolds number (e,f) for ramp up (a,c,e) and ramp down (b,d,f). (a) Wing  $\alpha =6^\circ$ $Re_c\ \uparrow$. (b) Wing $\alpha =6^\circ$ $Re_c\ \downarrow$. (c) Lift coefficient $Re_c\ \uparrow$. (d) Lift coefficient $Re_c\ \downarrow$. (e) Reynolds number $Re_c\ \uparrow$. (f) Reynolds number $Re_c\ \downarrow$.
The changes in the extent of the separated flow region, position of the separated shear layer and the formation and bursting of an LSB inferred from the transient top-view PIV measurements are confirmed using the transient side-view PIV measurements discussed hereafter. Comparisons of ensemble-averaged top-view and side-view measurements during the ramp up and ramp down for the wing are available in supplementary movies 3 and 4, respectively. Instantaneous spanwise vorticity contours from the side-view PIV measurements during the ramp up and ramp down in free-stream velocity are presented in figures 13 and 14, respectively, for the airfoil at  $\alpha ={5}^{\circ }$ and the wing at $\alpha ={6}^{\circ }$. Note that the instantaneous spanwise vorticity snapshots at each spanwise location were recorded during separate runs, and are therefore uncorrelated. During the ramp up (figure 13), the spanwise vorticity fields reveal a reduction in the angle between the separated shear layer and the airfoil surface as the turbulent shear layer reattaches, whereas during the ramp down (figure 14), this angle increases. The results from the airfoil at $\alpha ={5}^{\circ }$ (figures 13a and 14a) largely resemble those from the wing at $z/c=0.63$ and $1.75$ (figures 13b,d and 14b,d). At $z/c=1.13$ (figures 13c and 14c), shear layer roll-up in the reattaching flow occurs farther upstream than on the airfoil and the other locations on the wing. The spanwise vorticity contours at $z/c=0.25$ (figures 13e and 14e), which are influenced by wing root effects, also differ from those on the airfoil in that the distance of the shear layer from the surface is notably reduced when reattachment occurs.

Figure 13. Instantaneous snapshots of spanwise vorticity during ramp up in free-stream velocity. Black lines in (c) indicate the time instants of the snapshots in (a–e). (a) Airfoil  $\alpha =5^\circ$ $z/c=1.75$. (b) Wing $\alpha =6^\circ$ $z/c=1.75$. (c) Wing $\alpha =6^\circ$ $z/c=1.13$. (d) Wing $\alpha =6^\circ$ $z/c=0.63$. (e) Wing $\alpha =6^\circ$ $z/c=0.25$. (f) Reynolds number.

Figure 14. Instantaneous snapshots of spanwise vorticity during ramp down in free-stream velocity. Black lines in (c) indicate the time instants of the snapshots in (a–e). (a) Airfoil  $\alpha =5^\circ$ $z/c=1.75$. (b) Wing $\alpha =6^\circ$ $z/c=1.75$. (c) Wing $\alpha =6^\circ$ $z/c=1.13$. (d) Wing $\alpha =6^\circ$ $z/c=0.63$. (e) Wing $\alpha =6^\circ$ $z/c=0.25$. (f) Reynolds number.
Although the lift coefficient and top-view PIV measurements provide evidence of leading edge vortex shedding during the LSB bursting process, identification of the DSV using the  $\lambda _2$ criterion (Jeong & Hussain Reference Jeong and Hussain1995) and visual inspection of spanwise vorticity contours was inconclusive due to the lack of time-resolved velocity data, the small wall-normal extent of the side-view PIV field of view and the reduced coherence of vortical structures in the turbulent flow downstream of transition.
The spanwise contractions and expansions of the separated flow region inferred from the top-view PIV measurements (figures 9 to 12) during LSB formation and bursting, respectively, suggest that LSB formation and bursting occur at different times at different spanwise locations. Using data from the side-view PIV measurement planes outside of direct end effects ( $z/c\geq 0.63$), the spanwise variations of the locations of separation, transition and reattachment on the airfoil and wing are examined in figure 15. The data presented in the figure were obtained by averaging the ensemble average of these locations over a sliding temporal window of $5c/\overline {\widetilde {u_\infty }}$ (§ 2.2).

Figure 15. Transient movement of separation, transition and reattachment locations for airfoil at  $\alpha ={5}^{\circ }$ and finite wing at $\alpha ={6}^{\circ }$. Shaded areas indicate the uncertainty interval ( $95\,\%$ confidence). (a) Separation $Re_c\ \uparrow$. (b) Separation $Re_c\ \downarrow$. (c) Transition $Re_c \uparrow$. (d) Transition $Re_c\ \downarrow$. (e) Reattachment $Re_c\ \uparrow$. (f) Reattachment $Re_c \downarrow$. (g) Reynolds number $Re_c\ \uparrow$. (h) Reynolds number $Re_c\ \downarrow$.
During the ramp up in free-stream velocity for the airfoil, LSB formation is indicated by reattachment starting at  $t\overline {\widetilde {u_\infty }}/c=41$ (figure 15e). As the free-stream velocity increases, the transition location on the airfoil remains largely unchanged (figure 15c), although there is a small downstream movement of the separation point indicative of a decrease in adverse pressure gradient (figure 15a).
During the ramp up in free-stream velocity for the wing, reattachment occurs at  $t\overline {\widetilde {u_\infty }}/c=45$, $43$ and $41$ for $z/c=0.63$, $1.13$ and $1.75$, respectively (figure 15e). The delay in LSB formation near the wing root is consistent with the expected spanwise progression of reattachment on a rectangular stalled wing of uniform cross-section (Gudmundsson Reference Gudmundsson2014). As the flow over the wing settles to the reattached state, there is a relatively small downstream shift in the locations of separation and transition at $z/c=0.63$ and $1.75$ (figure 15a,c). However, at $z.c=1.13$, there is an upstream shift in separation and transition during the ramp up in free-stream velocity. This is reflected in the notably different LSB structure observed near the midspan of the wing (figure 7h).
During the ramp down in free-stream velocity for the airfoil, LSB bursting is marked by the cessation of reattachment at  $t\overline {\widetilde {u_\infty }}/c=50$ (figure 15f). Relative to the ramp up, the movement of the reattachment point is slower during the ramp down. For $55\leq t\overline {\widetilde {u_\infty }}/c\leq 75$, there is a notable oscillation in the location of transition (figure 15d) centred near the time when there is a transient increase in lift coefficient (figure 3e). Transition reaches its farthest downstream location at $t\overline {\widetilde {u_\infty }}/c=67$, while the local maximum in lift coefficient occurs at $t\overline {\widetilde {u_\infty }}/c=69$. Thus, the temporary increase in lift coefficient for the airfoil during the ramp down is associated with a delay in transition. It should be noted that relatively minor movements of the location of separation on the airfoil are observed during the ramp down.
During the ramp down for the wing, there is a substantial spanwise variation in the time at which reattachment ceases (figure 15f). In agreement with the extent of reattachment inferred from top-view PIV measurements, the reattachment locations calculated from side-view PIV measurements indicate that reattachment ceases first near the midspan of the wing. This occurs at  $t\overline {\widetilde {u_\infty }}/c=25$ at $z/c=1.13$ before reattachment ceases at $t\overline {\widetilde {u_\infty }}/c=38$ and $50$ at $z/c=0.63$ and $1.75$, respectively. These results are consistent with the spanwise expansion of the separated flow region on the wing during LSB bursting (figures 11d and 12b). The trends in the locations of separation and transition on the wing during the ramp down are largely the opposite of those during the ramp up. At $z/c=1.13$, there is a measurable downstream movement in transition during the period $40\leq t\overline {\widetilde {u_\infty }}/c \leq 55$ (figure 15d) where the lift coefficient plateaus (figure 3e) and the rate of spanwise expansion of the separated flow region towards the wing tip is reduced (figure 11d), implying lower disturbance growth rates in the separated flow during this time interval.
Because the reattachment process depends on transition in the separated shear layer, the wavelet transform of the wall-normal velocity fluctuations (§ 2.3) is employed to characterise the dynamics of the vortices shed from the separated shear layer during ramp changes in free-stream velocity. Figures 16 and 17 present ensemble-averaged wavelet amplitude scalograms for selected time instants during the ramp up and ramp down, respectively. The scalograms illustrate how the magnitudes of the wall-normal velocity fluctuations at each time instant vary with respect to normalised wavenumber ( $kc$) and streamwise location ( $x/c$).

Figure 16. Ensemble-averaged wavelet amplitude scalograms of wall-normal velocity fluctuations during ramp up in free-stream velocity. White dotted lines: transition location; white dashed lines: reattachment location. Black lines in (c) indicate the time instants of the snapshots in (a–e). (a) Airfoil  $\alpha =5^\circ$ $z/c=1.75$. (b) Wing $\alpha =6^\circ$ $z/c=1.75$. (c) Wing $\alpha =6^\circ$ $z/c=1.13$. (d) Wing $\alpha =6^\circ$ $z/c=0.63$. (e) Wing $\alpha =6^\circ$ $z/c=0.25$. (f) Reynolds number.

Figure 17. Ensemble-averaged wavelet amplitude scalograms of wall-normal velocity fluctuations during ramp down in free-stream velocity. White dotted lines: transition location; white dashed lines: reattachment location. Black lines in (c) indicate the time instants of the snapshots in (a–e). (a) Airfoil  $\alpha =5^\circ$ $z/c=1.75$. (b) Wing $\alpha =6^\circ$ $z/c=1.75$. (c) Wing $\alpha =6^\circ$ $z/c=1.13$. (d) Wing $\alpha =6^\circ$ $z/c=0.63$. (e) Wing $\alpha =6^\circ$ $z/c=0.25$. (f) Reynolds number.
On the airfoil (figures 16a and 17a) the magnitudes of wall-normal velocity fluctuations upstream of the transition location are comparable to the noise level in the PIV measurements. A rapid increase in the amplitudes of the wall-normal velocity fluctuations is resolved near the transition location, with the largest amplitude fluctuations observed near the location of reattachment for conditions where an LSB forms. Downstream of the transition location, there is a progressive decrease in the wavenumber of the largest amplitude fluctuations. The decrease in wavenumber with downstream distance can be attributed to the increasing thickness of the shear layer (e.g. Nati et al. Reference Nati, de Kat, Scarano and van Oudheusden2015). During the ramp up and ramp down, there is an increase and decrease in the wavenumber of the largest amplitude fluctuations, respectively, which settles on  $kc\approx 70$ and $kc\approx 100$ in the stalled and reattaching limiting states, respectively. These wavenumbers and the locations of maximum amplitude are consistent with the shear layer vortex shedding illustrated in figures 13(a) and 14(a). The frequencies associated with these wavenumbers can be estimated taking the mean streamwise velocity at the $y$ coordinate equal to the displacement thickness and the $x$ location of the maximum wavelet coefficient amplitude as the phase velocity. For the stalled and reattaching states of the airfoil, these frequencies are $9u_\infty /c$ and $12u_\infty /c$, respectively. During the ramp up, there is a relatively abrupt increase in the wavenumber and amplitude of the largest amplitude fluctuations between $t\overline {\widetilde {u_\infty }}/c=40$ and $57$, which corresponds to the time period where reattachment begins (figure 15e) and there is a rapid increase in lift (figure 3e). Likewise, during the ramp down, there is an abrupt decrease in the wavenumber and amplitude of the largest amplitude fluctuations between $t\overline {\widetilde {u_\infty }}/c=40$ and $57$, which corresponds to the time period where reattachment ceases and there is a rapid decrease in lift. A comparison of the middle panels in figures 16(a) and 17(a) reveals hysteresis in the shear layer velocity fluctuations, with larger amplitudes during the ramp down compared with the ramp up. Throughout the LSB formation and bursting process on the airfoil, the streamwise location of maximum wavelet amplitude remains largely constant, in agreement with the relatively small changes in transition location identified using the Reynolds shear stress-based transition criterion in figures 15(c) and 15(d). The hysteresis in the amplitudes of velocity fluctuations is consistent with the lift coefficient hysteresis (figure 4), as larger amplitude fluctuations enable reattachment to persist at lower Reynolds numbers, increasing measured lift.
The duration of the time period over which the rapid changes in wavenumber and maximum velocity fluctuations occur ( $<17c/\overline {\widetilde {u_\infty }}$) in figures 16 and 17 is comparable to the ensemble-averaged transient period of the lift coefficient (figure 5b) at this angle of attack, which is substantially shorter than the duration of the imposed change in free-stream velocity. These results suggest that, for quasi-steady changes in operating conditions, changes in disturbance wavenumbers and wavelet amplitudes are driven indirectly by the formation or bursting of the LSB, rather than directly by the change in Reynolds number.
The evolution of the wall-normal velocity fluctuations on the wing at  $z/c=0.63$ (figures 16d and 17d) and $1.75$ (figures 16b and 17b) is largely similar to that on the airfoil. However, the changes in amplitude and wavenumber of the largest amplitude fluctuations at these two locations on the wing are more gradual than on the airfoil or at $z/c=1.13$ on the wing (figures 16c and 17c). At $z/c=1.13$, the wavenumber of the largest amplitude fluctuations when reattachment occurs ( $kc\approx 125$) is greater than that observed at $z/c=0.63$ and $1.75$ ( $kc\approx 90$). An upstream shift in the location and increase of the maximum fluctuation amplitudes also occurs at $z/c=1.13$. These changes are attributed to the increase in LSB thickness at this location, since the larger distance of the velocity profile inflection point from the airfoil surface is expected to increase the wavenumber and growth rate of the most unstable disturbances (Dovgal et al. Reference Dovgal, Kozlov and Michalke1994). At $z/c=0.25$ on the wing (figures 16e and 17e), root effects cause the shear layer to remain closer to the wing surface when the LSB forms. Such a reduction in the distance of the inflection point of the velocity profile from the wing surface is expected to decrease the growth rates of unstable disturbances (Dovgal et al. Reference Dovgal, Kozlov and Michalke1994), and this is reflected in the substantial reduction in measured amplitudes relative to the other planes when an LSB forms on the wing. The occurrence of lower disturbance growth rates closer to the wing root and tip, where the LSB is thinner, has also been observed at a higher Reynolds number ( $Re_c=1.25\times 10^5$, Toppings & Yarusevych Reference Toppings and Yarusevych2022). The wavelet analysis of velocity fluctuations in the separated shear layer shows that the relatively gradual spanwise progression of LSB formation and bursting observed on the wing is associated with a more gradual change in the wavenumbers and amplitudes of velocity fluctuations in the regions near the root and tip. The hysteresis in velocity fluctuation amplitudes on the wing is less pronounced than on the airfoil, consistent with the observed reduction in lift coefficient hysteresis on the wing (figure 4). Because the base flow and the superimposed velocity fluctuations in reattaching flows are strongly coupled (e.g. Dovgal et al. Reference Dovgal, Kozlov and Michalke1994; Sandham Reference Sandham2008), the overall changes in LSB structure during formation and bursting should be considered interdependent on the transition dynamics.
The foregoing results show that substantial differences in LSB formation and bursting transients occur at different spanwise locations on the wing. However, in previous studies, bubble bursting criteria have been almost exclusively applied to two-dimensional flows (e.g. Gaster Reference Gaster1967; Horton Reference Horton1969; Diwan et al. Reference Diwan, Chetan and Ramesh2006; Serna & Lazaro Reference Serna and Lazaro2015; Mitra & Ramesh Reference Mitra and Ramesh2019). Therefore, it is of interest to evaluate the three-dimensional LSB forming on the wing using an established bursting criterion to understand how bursting criteria may be applied to real flows where three-dimensionality is always present to some extent. Because bursting can be caused by either a change in adverse pressure gradient or Reynolds number, the two-parameter criterion of Gaster (Reference Gaster1967) is employed here since it allows the relationship between these two effects to be examined.
In figure 18 the pressure gradient parameter  $P=(\widetilde {\theta _s}^2/\nu )(\Delta u_e/\Delta x)$ is plotted versus the momentum thickness Reynolds number at separation ( $\widetilde {\textit {Re}_{\theta _s}}$) for the ensemble-averaged velocity field during the ramp changes in free-stream velocity. The results for the airfoil pertaining to $\alpha ={5}^{\circ }$ and those for the wing at $\alpha ={6}^{\circ }$ are presented for the planes outside of direct root effects ( $z/c=0.63$, $1.13$ and $1.75$). Although four momentum thickness components are required to describe the momentum deficit in a three-dimensional boundary layer, the mean spanwise velocities at these locations in the reattaching limiting state are less than $6\,\%$ of the free-stream velocity, and the criterion of Gaster (Reference Gaster1967) has been applied in its two-dimensional form. Since the separation location falls just upstream of the PIV field of view for all cases presented, upstream linear extrapolation of the separation streamline was used to estimate the separation point location (e.g. Kurelek et al. Reference Kurelek, Tuna, Yarusevych and Kotsonis2021). The edge velocity and momentum thickness at separation ( $\theta _s$), required to calculate $\textit {Re}_{\theta _s}$ and $P$ were also computed from the PIV data using linear extrapolation. The mean inviscid velocity gradient over the LSB ( $\Delta u_e/\Delta x$) was estimated from the inviscid velocity distribution over the airfoil calculated using the XFOIL software (Drela Reference Drela1989). The solid black lines in the figure are the bursting line (Gaster Reference Gaster1967), above which LSBs are classified as long, and below which LSBs are classified as short. The bursting line of Gaster (Reference Gaster1967) extends only to $P=-0.09$, which was deemed as the maximum value of $P$ for which separation would occur on sharp-nosed airfoils of interest for aeronautical applications. The fact that separation occurs for higher values of $P$ on the airfoil and wing models is attributed to the relatively thick and rounded leading edge of the airfoil section employed in the present study (Owen & Klanfer Reference Owen and Klanfer1953).

Figure 18. Gaster bursting criterion during ramp changes in free-stream velocity. Solid line: bursting line; dashed line:  $\textit {Re}_{\theta _s}$ for limiting stalled state; black markers: LSB trajectory; white markers: LSB in reattaching limiting state. Shaded regions indicate the uncertainty interval ( $95\,\%$ confidence) and are coloured by $\widetilde{Re_c}$. (a) Airfoil $\alpha =5^\circ$ $z/c=1.75$ $Re_c\ \uparrow$. (b) Airfoil $\alpha =5^\circ$ $z/c=1.75$ $Re_c\ \downarrow$. (c) Wing $\alpha =6^\circ$ $z/c=1.75$ $Re_c\ \uparrow$. (d) Wing $\alpha =6^\circ$ $z/c=1.75$ $Re_c\ \downarrow$. (e) Wing $\alpha =6^\circ$ $z/c=1.13$ $Re_c\ \uparrow$. (f) Wing $\alpha =6^\circ$ $z/c=1.13$ $Re_c\ \downarrow$. (g) Wing $\alpha =6^\circ$ $z/c=0.63$ $Re_c\ \uparrow$. (h) Wing $\alpha =6^\circ$ $z/c=0.63$ $Re_c\ \downarrow$.
The obtained data trajectories in the  $P\unicode{x2013}\textit {Re}_{\theta _s}$ plane during the ramp up and ramp down in free-stream velocity are examined in figures 18(a,c,e,g) and 18(b,d,f,h), respectively. The location of the LSB in the reattaching limiting state is indicated by the white $\times$ marker. When reattachment does not occur, the parameter $P$ is undefined and only $\textit {Re}_{\theta _s}$ can be calculated. Consequently, the value of $\textit {Re}_{\theta _s}$ for the stalled limiting state is indicated by the vertical dashed line. The trajectory of the LSB from the initiation of reattachment up to the reattaching limiting state during the ramp up in free-stream velocity (or vice versa for the ramp down) is indicated by the black markers, and the uncertainty in the location of this trajectory is indicated by the shaded region that is coloured according to the corresponding chord Reynolds number ( $\textit {Re}_c$) to help connect the data to free-stream conditions during transients. As expected, the LSB in the reattaching limiting state on the airfoil is in the short bubble region, close to the bursting line. During the ramp up (figure 18a), the parameter $P$ remains relatively constant from the initiation of reattachment until the reattaching limiting state is reached, while there is an increase in $\textit {Re}_{\theta _s}$ from $116$ to $134$ that moves the LSB towards the short bubble region. During the ramp down, $\textit {Re}_{\theta _s}$ decreases, moving the LSB towards the bursting line as $P$ remains relatively constant until reattachment ceases at $\textit {Re}_{\theta _s}=108$. For both the ramp up and ramp down for the airfoil, the trajectories of the LSBs form a shallow angle with the bursting line, typical of the ‘smooth-expansion’ burst type described by Gaster (Reference Gaster1967).
Similar to the airfoil, the LSB in the reattaching limiting state on the wing at  $z/c=0.63$ and $1.75$ (figure 18c,d,g,h) is within the short bubble regime, close to the bursting line. However, the LSB in the reattaching limiting state at $z/c=1.13$ has significantly lower values of $P$ and $\textit {Re}_{\theta _s}$, which place it outside of the short LSB region identified by Gaster (Reference Gaster1967). Considering the substantial increase in the distance between transition and reattachment observed at $z/c=1.13$ (figure 8h) that is characteristic of long LSBs (Marxen & Henningson Reference Marxen and Henningson2011), the LSB in the reattaching limiting state at this location is deemed long. The agreement between qualitative observations of the LSB structure and dynamics at this location and the criterion of Gaster (Reference Gaster1967) suggests that this criterion is applicable in mildly three-dimensional regions of LSBs on finite lifting surfaces. Although spontaneous LSB formation and bursting can occur on airfoils and wings at low Reynolds numbers in a steady free stream near the stall conditions (Zaman, Mckinzie & Rumsey Reference Zaman, Mckinzie and Rumsey1989), the long LSB observed at $z/c=1.13$ did not spontaneously change into a short LSB or massively separated flow under steady free-stream conditions at $\textit {Re}_c=7.4\times 10^4$. This observation is notable because, although the LSB forming on the wing in the reattaching limiting state is both short at some spanwise locations and long at others, this flow state is globally quasi-stable, and spontaneous switching between reattaching and fully stalled states does not occur at $\textit {Re}_c=7.4\times 10^4$. Thus, partial LSB bursting and formation of a long LSB over part of the wing is necessary but not sufficient to cause bursting of the entire LSB on the finite wing.
During the ramp up for the wing, there is an overall increase in  $\textit {Re}_{\theta _s}$ from the initiation of reattachment up to the reattaching limiting state at $z/c=0.63$ and $z/c=1.75$ (figure 18c,g), similar to the trend seen for the airfoil. However, there is an overall decrease in $\textit {Re}_{\theta _s}$ at $z/c=1.13$ (figure 18e) that points to a different dynamics involved with the formation of a long LSB at the midspan of the wing. Also, large variations in $\textit {Re}_{\theta _s}$ and $P$ occur for the LSB at $z/c=1.13$ after the ramp up in free-stream velocity is complete, as indicated by the dark red colour of the shaded region encompassing the limiting reattaching state. Unlike the airfoil, during the ramp down at $z/c=0.63$ and $1.75$ on the wing (figure 18d,h), there is a significant initial decrease in $P$ and increase in $\textit {Re}_{\theta _s}$ as the LSB initially moves into the long bubble regime, similar to the ‘violent burst’ type of trajectory described by Gaster (Reference Gaster1967). In this case, such a trajectory is the result of a large transient increase in momentum thickness that occurs between the time that reattachment ceases at $z/c=1.13$ and the time that reattachment ceases at $z/c=0.63$ and $1.75$. As the flow approaches the stalled limiting state, there is a subsequent decrease in $\textit {Re}_{\theta _s}$ and a return of $P$ to a similar value as the reattaching limiting state at $z/c=0.63$ and $1.75$. Compared with the ramp up at $z/c=1.13$, the ramp down at this $z/c$ location features the LSB remaining relatively close to the reattaching limiting state before reattachment ceases, consistent with the small change in chord Reynolds number undergone before the separated flow region begins to expand from this spanwise location (figure 11d). The foregoing application of the bursting criterion of Gaster (Reference Gaster1967) to the LSB on the wing shows that this criterion correctly classifies the limiting LSB state as near bursting conditions. However, marked differences in the trajectories of the LSB in the $P\unicode{x2013}\textit {Re}_{\theta _s}$ plane are seen when comparing the airfoil to the wing, or when comparing different spanwise locations on the wing during the transient changes in free-stream velocity. The relatively shallow approach of the LSB trajectory to the bursting line on the airfoil (figure 18b) and on the wing near its midspan ( $z/c=1.13$, figure 18f) compared with the locations on the wing closer to the root and tip ( $z/c=0.63$ and $1.75$, figure 18d,h) suggests that end effects may induce the ‘violent burst’ type of trajectory characterised by an increase in $\textit {Re}_{\theta _s}$ and $P$ as the bursting line is approached. The application of the two-parameter bursting criterion of Gaster (Reference Gaster1967) to the transient flow over the wing model reveals that end effects may lead to substantial spanwise variations in quasi-steady and transient LSB classification on finite wings.
4. Discussion
It is instructive to compare the results of the current study with those from previous related investigations conducted on different airfoil geometries and flow parameters, so as to identify any general trends in the observed transient flow development and, when possible, the associated changes in aerodynamic loading.
The degree to which the measured flow field transients are dependent on the duration of the free-stream velocity ramp can be assessed by comparing the estimated transient periods from the present study (figure 5b) to the duration of stall and reattachment transients reported from other investigations. Because the lift response of the wing does not deviate substantially from quasi-steady behaviour (figure 4d–f), this comparison focuses on the airfoil. Although there are relatively few previous studies that consider transient free-stream velocity changes causing stall or reattachment on an airfoil, several studies have considered transients caused by pitching motions or active flow control strategies and are compared with the present study in table 3. For studies of ramp-type pitching motions, the non-dimensional pitch rate, defined as  $r=\dot {\alpha }c/(2u_\infty )$, where $\dot {\alpha }$ is the pitch rate in ${\rm rad}\ {\rm s}^{-1}$, is listed. For the studies involving active flow control, the reattachment and stall transients are produced by turning the flow control on and off, respectively.
Table 3. Comparison of stall and reattachment durations from selected previous studies.

The results in table 3 suggest that, across a variety of airfoil geometries and flow parameters, the stall transient durations tend to be longer than the reattachment transient durations, consistent with the present study. Additionally, the transient durations do not appear to strongly depend on Reynolds number. The range of transient durations observed in the present study overlaps those of both quasi-steady, unsteady and impulsive changes in operating conditions from previous studies. This suggests that there is a minimum time required for reattachment of approximately  $7c/u_\infty -10c/u_\infty$, and for stall of $20c/u_\infty -30c/u_\infty$, regardless of the type of imposed change in operating conditions.
The flow development over the wing in the stalled limiting state of the present study bears a strong resemblance to that observed on a semi-span NACA 0015 wing with aspect ratio four at a higher angle of attack and Reynolds number ( $\alpha ={22}^{\circ }, \textit {Re}_c=3.3\times 10^5$) reported by Neal & Amitay (Reference Neal and Amitay2023). In their study, three-dimensional end effects were seen to dominate the near-surface flow development within $0.75c$ of the wing tip and within $0.5c$ of the wing root. Similarly, reverse flow is not observed in the top-view PIV measurements of the present study within $0.5c$ of the wing root and tip (figure 6e), indicating the regions where three-dimensional end effects suppress the wall-normal extent of flow separation. The similarity of the spanwise extent of tip effects in the massively separated flow at different aspect ratios points to an insensitivity of overall structure of the stalled limiting state to this parameter when the aspect ratio is sufficiently large to separate the regions under direct end effects.
In the reattaching limiting state, the PIV measurements indicate that a three-dimensional LSB forms on the wing, with an increase in thickness near the midspan and a reduction in wall-normal extent towards the root and tip. This type of LSB structure is qualitatively similar to that described by Henk (Reference Henk1990, figure 6.2) resulting from the impulsive imposition of a three-dimensional pressure gradient on a flat plate. However, the results of experiments on the same wing geometry at higher Reynolds numbers (Toppings & Yarusevych Reference Toppings and Yarusevych2022) reveal a notably different spanwise structure to the LSB, with two local maxima in LSB thickness located in the intermediate regions between the areas dominated by end effects and the flow over the midspan. The maximum displacement thickness computed from the side-view PIV measurements of the present study at  $z/c=1.13$ is $\delta^*/c=0.05$, compared with local maxima of $\delta^*/c\approx 0.01$ at $z/c=0.35$ and $2.00$ measured on the same wing model at $\textit {Re}_c=1.25\times 10^5$ (Toppings & Yarusevych Reference Toppings and Yarusevych2022). Given the substantial change in maximum displacement thickness with Reynolds number coinciding with the location where reattachment first ceases during the LSB bursting transient, it is conjectured that LSB bursting may not initiate from near the midspan of the wing at higher Reynolds numbers where the maximum displacement thickness does not occur near the midspan. Instead, it is speculated that LSB bursting proceeds by the outboard progression of massive separation initiating closer to the wing root, as often occurs on wings at Reynolds numbers typical of manned aircraft (Gudmundsson Reference Gudmundsson2014). Furthermore, during the LSB formation process on the wing, the side-view PIV measurements indicated that earlier reattachment occurred at the planes closer to the wing tip (figure 15e), as expected for a rectangular wing. Thus, the initiation of LSB bursting at $z/c=1.13$ is likely a consequence of the shape of the preceding LSB.
It is important to note that the imposed free-stream accelerations in this study were relatively small, with  $|ac/u_\infty ^2|\leq 0.011$. For faster free-stream accelerations, the magnitude of the free-stream streamwise pressure gradient is expected to become significant in the transient flow development. This may lead to more substantial lift hysteresis for the wing, such as that observed for a stalled wing in a periodic free stream by Gloutak, Jansen & Farnsworth (Reference Gloutak, Jansen and Farnsworth2022), and to measurable differences in roll-up vortex size and shedding frequency for positive and negative free-stream accelerations, similar to the results of Nati et al. (Reference Nati, de Kat, Scarano and van Oudheusden2015). However, more rapid changes in free-stream velocity may not necessarily lead to more rapid LSB formation and bursting, because the more favourable pressure gradient during the ramp up has been shown to cause a delay in separation and transition, whereas the more adverse pressure gradient during the ramp down produces the opposite effect (Greenblatt, Müller-Vahl & Strangfeld Reference Greenblatt, Müller-Vahl and Strangfeld2023).
Although relatively few previous studies have considered the stall of a wing due to a change in free-stream velocity, the dynamic stall of pitching airfoils and wings has received greater attention (e.g. McCroskey Reference McCroskey1981). Dynamic stall may occur through the formation of a single DSV that grows as it remains in place over the suction surface before being shed, or by the convective growth of a series of vortices. Mulleners & Raffel (Reference Mulleners and Raffel2013) termed these two modes of dynamic stall as the wake mode and shear layer mode, respectively. Typical DSV formation periods are of the order of  $c/u_\infty$ (Mulleners & Raffel Reference Mulleners and Raffel2013), which is sufficiently long to be captured by the side-view PIV, whose sampling frequency is $0.5c/u_\infty$. In the present investigation, the formation of a series of downstream convecting vortices and the absence of a stationary DSV during the ramp down in free-stream velocity suggests that the stall due to LSB bursting precipitated by the change in free-stream velocity can be classified as a shear layer mode stall.
The dynamic stall of finite aspect ratio wings has been investigated in multiple studies where wake mode dynamic stall was reported (e.g. Andreu Angulo & Ansell Reference Andreu Angulo and Ansell2019; Visbal & Garmann Reference Visbal and Garmann2019b; Hammer, Garmann & Visbal Reference Hammer, Garmann and Visbal2022). Although the stall mode is different, there are similarities between the topological changes in flow development along the span in these studies and the present. The wake mode dynamic stall of a finite wing is characterised by DSV pinning at the leading edge of the wing tip as a result of downwash from the wing tip vortex that suppresses DSV formation in its vicinity (Coton & Galbraith Reference Coton and Galbraith1999). This leads to the formation of an arch-shaped DSV (e.g. Visbal & Garmann Reference Visbal and Garmann2019a). For semi-span wings, the arch-shaped DSV curves back towards the wing surface near the root (Visbal & Garmann Reference Visbal and Garmann2019a), reaching its greatest wall-normal distance from the wing surface near the midspan (Schreck & Hellin Reference Schreck and Hellin1994). Similarly, the spanwise variation of the distance of the separated shear layer from the wing surface in the reattaching limiting state of the present study is expected to result in the formation of arch-shaped roll-up vortices in the LSB over the midspan of the wing. Near the wing tip and root, the downwash produced by the tip and wing root vortices suppress boundary layer separation and roll-up vortex formation. On finite wings undergoing dynamic stall, the suppression of boundary layer separation and DSV formation due to tip vortices has been linked to a reduction in nonlinear lift overshoot (Andreu Angulo & Ansell Reference Andreu Angulo and Ansell2019). Analogously, the results of the present study indicate that the presence of a wing tip leads to a substantial reduction in lift hysteresis, rendering the lift response to the ramp change in free-stream velocity nearly quasi-steady.
5. Concluding remarks
An experimental study on the formation and bursting of an LSB on a NACA 0018 airfoil and a finite wing with the same airfoil section was undertaken in a wind tunnel for angles of attack between  ${3}^{\circ }$ and ${9}^{\circ }$. Simultaneous direct-force and PIV measurements were employed to relate the lift produced by the airfoil and wing to transient flow field development over the suction surface. The lift coefficients and velocity field measurements of the airfoil and wing were compared at equivalent geometric and effective angles of attack. The formation and bursting of an LSB on the suction surface of the airfoil and wing models was triggered by imposing controlled ramp changes in free-stream velocity. With non-dimensional accelerations of $|ac/u_\infty ^2|\leq 0.011$, the changes in free-stream velocity were essentially quasi-steady.
The results from the airfoil and wing at equivalent effective angles of attack are used to explore the influence of end effects on the transient process of LSB formation and bursting on the wing at a geometric angle of attack of  ${6}^{\circ }$. The corresponding limiting Reynolds numbers for the ramp changes used for this case are $\textit {Re}_c=5.4\times 10^4$ and $7.4\times 10^4$. At $\textit {Re}_c=5.4\times 10^4$, the airfoil and wing are stalled, and at $\textit {Re}_c=7.4\times 10^4$ reattachment occurs and an LSB forms on the suction surface of both models. The presence of wing root and tip effects leads to substantial three-dimensionality of the flow over the wing. These end effects also cause notable changes in LSB thickness along the span of the wing in the reattaching limiting state, with the LSB becoming thickest near the midspan and thinner near the wing root and tip.
The LSB bursting begins near the midspan on both the airfoil and wing. On the airfoil, cessation of reattachment spreads from the midspan rapidly towards the test section walls. On the wing, cessation of reattachment spreads more gradually from the location of maximum LSB thickness towards the root and tip. During LSB formation, reattachment occurs first near the ends of the airfoil and wing and spreads towards the midspan. The location of reattachment moves upstream more rapidly when the LSB forms during the ramp up than it moves downstream when the LSB bursts during the ramp down. The duration of the transient adjustment for the lift coefficient and flow development on the airfoil ranges from 10 to 22 convective time scales during LSB formation, and from 22 to 30 convective time scales for LSB bursting. This range of transient durations, and the longer duration of the bursting transient, are consistent with results reported for airfoils undergoing pitching or active flow control in previous studies. In contrast, the flow over the wing geometry does not substantially deviate from quasi-steady behaviour. As reflected in the observed transient flow development, the change in lift coefficient during LSB bursting is more gradual on the wing than on the airfoil. This is a result of more gradual spanwise contraction and expansion of the region of fully separated flow during LSB formation and bursting, respectively. Contrary to the reduction in quasi-steady and transient stall Reynolds numbers expected to be caused by the reduction in effective angle of attack on the wing, an increase in the stall Reynolds number was observed relative to the airfoil at the same effective angle of attack. This finding is attributed to the increased distance of the separated shear layer from the surface in the three-dimensional LSB forming on the wing near the midspan, which inhibits turbulent shear layer reattachment.
Substantial Reynolds number hysteresis is observed for the lift coefficient of the airfoil during the ramp changes in free-stream velocity, taking the form of a counter-clockwise hysteresis loop, with the lift coefficient during the ramp up being lower than that during the ramp down. The lift produced by the wing during the ramp changes in free-stream velocity is less hysteretic than the airfoil, following the quasi-steady lift coefficients more closely. Consequently, the duration of lift coefficient deviations from quasi-steady values are reduced for the wing relative to the airfoil. The lift coefficient hysteresis is linked to hysteresis of the velocity fluctuations in the separated shear layer, with larger amplitude velocity fluctuations associated with the higher lift observed during the ramp down, and smaller amplitudes associated with lower lift during the ramp up.
During the ramp down at moderate angles of attack, the ensemble-averaged lift coefficients do not change monotonically despite the imposed monotonic change in free-stream velocity. For the airfoil and the wing, a local maximum occurs in the ensemble-averaged lift coefficient after the initial rapid loss of lift caused by LSB bursting. This local maximum in lift is linked to an oscillation in the spanwise and wall-normal extent of the recirculating flow region associated with a spanwise-travelling wave of higher velocity fluid. The presence of this phenomenon in the ensemble average indicates that it is a repeatable process connected to the transient flow development triggered by the imposed change in free-stream velocity.
The LSB bursting criterion of Gaster (Reference Gaster1967) correctly identifies the LSB on the airfoil in the reattaching quasi-steady limiting state as near bursting. During the ramp up, the formed LSB on the airfoil moves from the long bubble regime to the short bubble regime. During the ramp down, the opposite is observed. The LSB on the wing in the reattaching limiting state is also classified as a short bubble near the root and tip. However, near the midspan, the LSB on the wing falls within the long regime. As a result, the relationship between the bursting criterion parameters during ramp changes in free-stream velocity vary with spanwise position on the wing. Therefore, a precise knowledge of the conditions under which LSB bursting and formation occurs and the associated changes in aerodynamic forces on finite wings at moderate angles of attack requires the consideration of three-dimensional effects.
Supplementary movies
Supplementary movies are available at https://doi.org/10.1017/jfm.2024.321.
Acknowledgements
The authors thank Mr J. Benninger for manufacturing the airfoil model.
Funding
The authors gratefully acknowledge the Natural Sciences and Engineering Research Council of Canada for funding this work.
Declaration of interests
The authors report no conflict of interest.
Data availability statement
The data that support the findings of this study are available from the corresponding author upon reasonable request.
Author contributions
Connor Toppings: Conceptualization, Methodology, Software, Formal analysis, Investigation, Data curation, Writing – original draft, Writing – review & editing, Visualization.
Serhiy Yarusevych: Conceptualization, Methodology, Formal analysis, Resources, Data curation, Writing – review & editing, Visualization, Supervision, Project administration, Funding acquisition.


 Open access