


1. Introduction
The number of wineries and vineyards in the United States has rapidly expanded. There were 9,654 wineries in 2018, up from about 1,000 in 2001; about 25,000 farms are engaging in viticulture (Bureau of Labor Statistics, 2018; Statista, 2019). While California accounts for 86% of U.S. wine production, more than half of the wineries are in other states, which are in general less famed than the Golden State in winemaking (Statista, 2019). Vintners and winemakers in these less-prestigious regions have used the American Viticultural Area (AVA) to establish designated wine regions (Chace and Smith, Reference Chace and Smith2013). There are now 248 AVAs nationwide, noteworthy given that the first prestigious U.S. wine region, Napa, was relatively unremarkable until the 1960s (Alcohol and Tobacco Tax and Trade Bureau, 2020a; Taber, Reference Taber2006). Nevertheless, the proliferation has prompted suggestions that AVAs are both confusing and meaningless, thus having no positive effect on consumer preference (Atkin and Johnson, Reference Atkin and Johnson2010; Johnson and Bruwer, Reference Johnson and Bruwer2007b).
On the other hand, some winemakers argue that AVA’s merit exists in a more nuanced way. In replacing a less-prestigious origin with an AVA, it causes consumers to overlook potentially negative quality that the less-prestigious origin implied, even though the AVA is itself unknown to consumers (Davidson, Reference Davidson2013; Smith, Reference Smith2013). This claim, however, has received little attention in the literature.
If AVAs do little to stimulate consumer preference, it substantiates the opponents’ claim, resources are wasted in creating meaningless identities of appellations. Conversely, if AVAs stimulate consumer preference, AVA is transformative in marketing terms, which enhances less-prestigious wine regions; AVA can thus provide economic development opportunities for the less-prestigious wine regions and potentially enhances land value in these rural regions (Cross, Plantinga, and Stavins, Reference Cross, Plantinga and Stavins2011b).
To shed more light on AVAs’ merit, the impact of a New Jersey AVA on consumer willingness to pay (WTP) is examined with a choice experiment. From the results, consumers are willing to pay more for wines with the AVA label than other alternatives where “New Jersey” is noted. The respondents also rated the quality of the wine with the AVA label higher than wines from New Jersey. Given that these labels can apply to the same wine, the results suggest a spillover effect—AVAs might be confounding consumers. In sum, this study supplies empirical insights, which can stimulate discussions to advance and safeguard AVA’s policy.
1.1. Background and Literature
AVAs transform the experience attribute of American terroirs into a search attribute (Caswell and Mojduszka, Reference Caswell and Mojduszka1996). The policy allows vintners, wineries, and sellers to capture the premium that the origin might generate. The importance of AVA is rooted in the concept of terroir, a belief that wine’s quality is shaped by a place’s soil, climate, and culture (Demossier, Reference Demossier2011; Gergaud and Ginsburgh, Reference Gergaud and Ginsburgh2008; Gilbert, van der Lelie, and Zarraonaindia, Reference Gilbert, van der Lelie and Zarraonaindia2014). Among the established AVAs are Fennville, Lancaster Valley, Bell Mountain, and High Valley—a dizzying array of names that hold little hints about their true geographical origins (Alcohol and Tobacco Tax and Trade Bureau, 2020a). Others like Napa Valley and Willamette Valley have become seals of quality to oenophiles around the world.
Terroirs have well-established links to the price of wines. Nine of the most expensive wines, averaging from $4,975 to $19,327, are from Côte de Nuits—a wine region in France; all American wines above $500 per bottle originate from the Napa Valley (wine-searcher.com, 2018). Many studies have observed that wines’ regions of origin generate price premium. For instance, small-scale cool-climate regional wines of Australia exhibit a higher price premium (Oczkowski, Reference Oczkowski1994). Wines from Pauillac, Pomerol, and St. Estephe are priced higher than the average Bordeaux wines (Cardebat and Figuet, Reference Cadebat and Figuet2004; Combris et al., Reference Combris, Lecocq and Visser1997; Landon and Smith, Reference Landon and Smith1997). Rioja and Duero produce higher-priced bottles among Spanish wines (Angulo et al., Reference Angulo, Gil, Gracia and Sánchez2000). And Napa has a premium over other California, Washington, and most New World wines (Costanigro, McCluskey, and Mittelhammer, Reference Costanigro, McCluskey and Mittelhammer2007; Delmas and Lessem, Reference Delmas and Lessem2017; Schamel, Reference Schamel2009). Overall, the evidence that the place of origin is an important consideration in wine purchases is convincing.
Studies have examined various aspects of terroir. The geographical factor has been found to impact the prices of vineyards (Cross, Plantinga, and Stavins, Reference Cross, Plantinga and Stavins2011a, Reference Cross, Plantinga and Stavins2011b, Reference Cross, Plantinga and Stavins2017). Gokcekus and Finnegan (Reference Gokcekus and Finnegan2017) found that sub-AVA elevates the prices of wines produced in Willamette County. Gergaud and Ginsburgh (Reference Gergaud and Ginsburgh2008) found that the impact of the natural endowment—which embodies terroir—has a negligible impact on wine quality; terroir affects the level of technological investment, which may cause quality to be misattributed to terroir; nevertheless, AVA may be needed to protect the technological investment. Overall, an argument exists for a place of origin trademark—to prevent infringement and to allow promotion of regional identity (U.S. Department of the Treasury, 2018a).
While often seen as such, AVAs are not seals of quality but strictly designations of places (Mendelson, Reference Mendelson2016). The law stipulates that an AVA petition must meet the requirement of Distinguishing Features—which describes how a geographical area’s climate, geological features, soils, and other features that may affect viticulture and make it distinctive (Office of the Federal Register, 1979). However, wine quality is not an essential requirement; the panel overseeing AVA petitions does not include experts in the evolving science of viticulture, enology, and other aspects of terroir (Mendelson, Reference Mendelson2016). The AVA is unlike the French’s System, where each Appellation d’origine Controlee (AOC) region specifies its production methods, minimum levels of alcohol, vine age, and other measurements (Munsie, Reference Munsie2002; Puckette, 2016). Therefore, if an AVA increases consumer preference and they are not rewarded with an elevated wine quality, it then raises the question if AVAs are merely marketing ploys, which may suggest an inherent flaw in the AVA policy.
Since the first AVA—Augusta in Missouri—was established in 1980, AVAs are now scattered across 33 states (U.S. Department of the Treasury, 2018a). Many of the AVAs are said to be unknown, uninformative, have no real premium to protect, and meaningless (Atkin and Newton, Reference Atkin and Newton2012; Gray, Reference Gray2014; Johnson and Bruwer, Reference Johnson and Bruwer2007b; Mendelson, Reference Mendelson2016). Johnson and Bruwer (Reference Johnson and Bruwer2007a) suggest that the industry is “marketing unknown” by the rapid creation of AVA. The notion is supported by the observation that 55% of respondents have “no opinion of quality” for the Knight Valley AVA, but only 1% professed to have no opinion of Sonoma County, when in fact Knight Valley is a premier partition of Sonoma County (Johnson and Bruwer, Reference Johnson and Bruwer2007b).
Consumer preference for appellations is influenced by subjective knowledge. For instance, German participants willing to pay more for the cheaper Passé Tout Grains AOC wine than the pricier Burgundy AOC wines, showing that knowledge and awareness moderate preference (Bazoche et al., Reference Bazoche, Combris, Giraud-Héraud, Traversac, Giraud-Héraud and Pichery2013). Further, consumers expect better quality when the wine is presented with both a sub-AVA label and county, e.g., “Bennett Valley, Sonoma County,” as opposed to just the sub-AVA label “Bennett Valley” alone (Bruwer and Johnson, Reference Bruwer and Johnson2010). Atkin and Newton (Reference Atkin and Newton2012) show that consumers claimed to be more knowledgeable about “Sonoma County” than its sub-AVAs, despite that the sub-AVAs are more selective and prestigious. Atkin and Johnson (Reference Atkin and Johnson2010) observe that consumers use brands, regions, counties, vintage, and states more than AVAs as indicators of wine quality. These evidence cast doubts on the overall marketing value of AVAs; while some, such as Napa Valley, have established a reputation to be protected; most AVAs are likely unknown entities to consumers, which thus—in theory—hold little value as a marketing device, asssuming that consumers’ knowledge is essential to create value.
1.2. Objectives
While regional identity is an important element in wine marketing, little is known if an obscure AVA can be beneficial as a marketing tool, and if so, at what cost in terms of Pareto efficiency. Without clarity on these questions, it is uncertain if AVAs are fulfilling its mandates to promote producers’ and consumers’ interests simultaneously. There are 19 pending petitions, indicating a strong and sustained interest in the industry for AVA, which highlights the value of this study (Alcohol and Tobacco Tax and Trade Bureau, 2020b).
With the goal to highlight the value created by a not-well-known AVA, this study investigates the effect of a New Jersey AVA on consumer preference. The results generate useful insights to illuminate the impact of an unknown AVA on consumers. Based on the results, relevant discussions about policy implications are carried out.
2. Methods
This study focuses on an AVA that fits the criteria of being relatively unknown and nested within a state with a traditionally weaker winemaking reputation, namely the Outer Coastal Plain (OCP) AVA, an AVA established in 2007, of Southern New Jersey (Office of the Federal Register, 2007).
In an ideal setting, we would regress the consumer preference of wines against AVAs—with perceived quality and other relevant factors controlled to ascertain the value of AVAs. Nevertheless, consumer preference is not directly observable; with 248 established AVAs and a general void of data about consumer preference of the AVAs, a comprehensive evaluation of all AVAs is relatively unreachable. A compromise in scope is necessitated by the challenge posed by the numerous AVAs in a controlled setting; many factors affect consumer preference for wines (Angulo et al., Reference Angulo, Gil, Gracia and Sánchez2000; Lockshin and Corsi, Reference Lockshin and Corsi2012; Orth, McGarry Wolf, and Dodd, Reference Orth, McGarry Wolf and Dodd2005).
Our main hypotheses surround the impact of the OCP appellation label on consumer preference. We ask if consumers’ WTP for the AVA label is systematically different from labels where “New Jersey” is denoted.
A choice experiment is used as it is easy to deploy on a wide sample, and it accommodates examination of multiple attributes in a controlled manner, fitting the purpose of this study (Hensher, Rose, and Greene, Reference Hensher, Rose and Greene2005). Furthermore, it has been applied in studies of consumer preference, including wine, which further justifies its use (Delmas and Lessem, Reference Delmas and Lessem2017; Lusk, Reference Lusk2003; Meas et al., Reference Meas, Hu, Batte, Woods and Ernst2015; Perrouty, d’Hauteville, and Lockshin, Reference Perrouty, d’Hauteville and Lockshin2006). The choice experiment is conducted online with a U.S.-wide sample of wine consumers.Footnote 1
In the choice experiment, wines that differ according to a selected set of appellation labels, prices, and other attributes are generated (Figure 1). These alternatives of wines are distributed in choice sets; each choice set simulates a purchase situation, where respondents were asked to choose the most desirable alternatives within a choice set or to forego the purchase should the presented wines are not appealing. Note that these purchases are hypothetical; no actual money and products are exchanged. Consumer preference is inferred from the observed choices econometrically, where utility and WTP estimates are generated to gauge the economic impact of an AVA.

Figure 1. The map of Outer Coastal Plain and approximate location of Pilesgrove, New Jersey.
Source: https://www.atwineries.com/wineries/united-states/new-jersey/outer-coastal-plain/
3. Choice Experiment Design and Hypotheses
The experiment features 750 ml cabernet sauvignon—the most widely produced and consumed varietal in the United States; it is also the most widely planted varietal in the OCP region (Karlsson and Karlsson, 2018; Outer Coastal Plain Vineyard Association, 2020; Thach, 2015).
Six appellations labels are included: OCP; New Jersey, USA; Pilesgrove, New Jersey (Figure 1); California, USA; Napa Valley; and Product of USA (Table 1). These appellations will henceforth be referred to as OCP, NJ, Pilesgrove, California, Napa, and USA, where the italic denotes appellations.
Table 1. Attributes of the choice experiment

a Base Categories of Dummy Variables, Prices are continuous.
A Southern New Jersey winery in Pilesgrove could use the first three labels. OCP allows the wine to be marketed by its AVA, where the state name is omitted. Whereas NJ and Pilesgrove advertise the state name. As the same wine can be marketed under these labels, any differences in WTP (ceteris paribus) thus result from the appellation labels, which teases out the effect of the AVA.
The design leverages OCP’s fine wine production aspiration, which has been hindered by its state’s weaker reputation (Smith, Reference Smith2013; Thompson, Reference Thompson2018). In 2012, OCP wines competed against Bordeaux wines in a blind tasting, in a format similar to the Judgement of Paris that had propelled Napa into the first premier American wine region; the OCP wines were competitive, rank-sum tests found only 1 out of 12 OCP wines were deemed statistically inferior to the significantly higher-priced Bordeaux wines (Quandt et al., Reference Quandt, Taber, Quandt, Taber and Quandt2012).
Despite it, New Jersey has not been traditionally seen as a fine wine producing region. The state produces 2.7 million gallons of still wine in 2017, which is 0.17% of the U.S. production by volume (U.S. Department of the Treasury, 2018b). Its winemaking reputation may have been somewhat negative. Media depictions demonstrate such sentiment; for example, George Taber, a renowned wine journalist, points to the state’s history of “mass production of rotgut,” referring to the sweet Welch-like wines that the state is known for (Davidson, Reference Davidson2013). The negative reputation was said to be an obstacle to the region’s aspiring winemakers, prompting the creation of the OCP AVA as a means to shed the negative reputation of New Jersey wine (Chace and Smith, Reference Chace and Smith2013; Davidson, Reference Davidson2013; Smith, Reference Smith2013). The Wine Enthusiast magazine noted the rise of New Jersey wine quality, claiming that “New Jersey is ready for its time in the spotlight,” but its subtext imply that the state’s winemaking reputation is relatively lower (Thompson, Reference Thompson2018).
In this study, the degree to which OCP elevates the competitiveness of the New Jersey wine is a point of interest, specifically:
 $$H_0^1{:}\ WT{P_{NJ}} - WT{P_{OCP}} = 0$$
Hypothesis 1 tests for the difference in WTP between the state appellation of New Jersey and OCP. Failure to reject the null indicates that the AVA is ineffective for price premium generation.
If hypothesis 1 is rejected with $WT{P_{NJ}} \lt WT{P_{OCP}}$
, hypothesis 2 would suggest whether the premium could be due to the omission of “New Jersey” from the label,
$WT{P_{NJ}} \lt WT{P_{OCP}}$
, hypothesis 2 would suggest whether the premium could be due to the omission of “New Jersey” from the label,
 $$H_0^{2a}{:}\ WT{P_{Pilesgrove}} - WT{P_{OCP}} = 0$$
 $$H_0^{2b}{:}\ WT{P_{Pilesgrove}} - WT{P_{NJ}} = 0$$
Pilesgrove is a town within the OCP; the Pilesgrove label thus represents a hypothetical sub-AVA of OCP in the vein of Calistoga AVA.Footnote
2
Rejection of hypothesis 2a with $WT{P_{Pilesgrove\;}} \lt WT{P_{OCP}}$
, and the failure to reject hypothesis 2b would suggest that respondents fail to recognize the geographical relations of these New Jersey-based appellations. Also, the inclusion of Pilesgrove could inform producers of the potential of such townships sub-AVA.
$WT{P_{Pilesgrove\;}} \lt WT{P_{OCP}}$
, and the failure to reject hypothesis 2b would suggest that respondents fail to recognize the geographical relations of these New Jersey-based appellations. Also, the inclusion of Pilesgrove could inform producers of the potential of such townships sub-AVA.
As a rational and fully informed consumer would not have significantly different WTP for the same wine, the pattern above would indicate that the assumption of perfect information is violated. Therefore, the WTP for OCP is likely stemming from consumer’s lack of knowledge. This strategic use of AVA is reflected in real-world examplesFootnote 3 and as noted in Smith (Reference Smith2013).
As with all choice experiments, the number of required choice sets increases exponentially with the number of attributes, which renders a larger number of appellation labels impractical (Hensher et al., Reference Hensher, Rose and Greene2005). Nevertheless, the setting is sufficient to draw implications about marketing with relatively unknown AVAs.
In addition to appellations, the design also includes the Organic wine label and the Sustainable Winemaking label. These ecolabels are included to enhance realism, as it reflects wine sold in the market.Footnote 4 The role of these increasingly popular labels to consumer preference has been discussed, where there remains a general lack of consensus regarding whether the labels appeal to consumers (Abraben, Grogan, and Gao, Reference Abraben, Grogan and Gao2017; Delmas and Grant, Reference Delmas and Grant2014; Di Vita et al., Reference Di Vita, Pappalardo, Chinnici, La Via and D’Amico2019; Sogari et al., Reference Sogari, Corbo, Macconi, Menozzi and Mora2015; Waldrop, McCluskey, and Mittelhammer, Reference Waldrop, McCluskey and Mittelhammer2017). This is despite that the market for organic wine has been expanding steadily, and various claims of sustainability have been increasingly used in marketing (Berghoef and Dodds, Reference Berghoef and Dodds2011; de La Hamaide and Denis, Reference de La Hamaide and Denis2018; Ecolabel Index, 2019; Sogari, Mora, and Menozzi, Reference Sogari, Mora and Menozzi2016). Nevertheless, these ecolabels have been included here for realism, as the property is essential for data quality (Hensher et al., Reference Hensher, Rose and Greene2005; Louviere, Hensher, and Swait, Reference Louviere, Hensher and Swait2000; Train, Reference Train2003). Additionally, the inclusion may minimize experimenter demand bias, which arises from respondents being overly focused on the research objectives (Sawyer, Reference Sawyer1975).
Lastly, four levels of prices are used, which range from $7.99 to $16.99 in increments of $3.00. These prices correspond to the $10 per 750 ml bottle after-tax mean retail price nationally (Bekkerman and Brester, Reference Bekkerman and Brester2019; Quackenbush, 2017; Wine and Vines, 2017). Bekkerman and Brester (Reference Bekkerman and Brester2019) show that wine purchases above the price of $20 represent only a smaller segment of the market. Thus, the price range is sensible given the goal of charting the consumer’s preference at the mean level, rather than the narrower preferences of connoisseurs. The chosen range implies that the results might not reflect the market for higher-priced wines, where different evaluation criteria are likely used. Nevertheless, the proposed implementation satisfies our main objective, which is to understand how AVA affects most consumers.
The choice experiment features graphical representations of wine labels as depicted in Figure 2. In particular, the attributes appear as text on the wine labels, where the exact form is denoted in Table 1. In cases where a product is without Sustainable Winemaking or the organic grape claim, the space where the labels occupy are left blank, reflecting the common practice in the marketplace.

Figure 2. A sample choice set.
The study, as a positive analysis, intends to simulate the actual preference in the marketplace. Thus, respondents were not told the exact locations of the geographical labels and the definitions of Sustainable Winemaking and organic wine. This is so that consumers’ preference for the attributes is not altered with the provision of information, as previous experiments have shown that such information can alter preference (Uchida et al., Reference Uchida, Roheim, Wakamatsu and Anderson2013).
To reduce hypothetical bias, i.e., respondents’ tendency to inflate their stated WTP, a cheap talk script from Lusk (Reference Lusk2003) is used in the study. The script has been shown to reduce hypothetical bias (Lusk, Reference Lusk2003; Tonsor and Shupp, Reference Tonsor and Shupp2011).
The choice sets are generated with D-efficiency criteria with the Partial Factorial Algorithm in JMP 13 (Crabbe and Vandebroek, Reference Crabbe and Vandebroek2012). The final design scores highly at 93.84%, where all main effects can be estimated (Kuhfeld, Reference Kuhfeld2010). The algorithm yields 24 unique choice profiles; the choice profiles are distributed into 48 choice sets (Hensher et al., Reference Hensher, Rose and Greene2005). Then, the choice sets are distributed into six blocks. Each respondent completes eight choice sets, which is below the threshold of fatigue (Czajkowski, Giergiczny, and Greene, Reference Czajkowski, Giergiczny and Greene2014).
4. Model
A mixed logit (ML) model estimates the consumer preference. The model uses random coefficients to represent taste variation, allowing consumer WTP at different percentiles to be estimated (Train, Reference Train2003). Following the Random Utility Model,
 $${U_{ijt}} = \alpha {p_{ijt}} + {\bf{\mu }}{{\bf{x}}_{ijt}} + {{\rm{\varepsilon }}_{ijt}}{\rm{\;\;\;}}\left( 1 \right)$$
where ${U_{ijt}}$
represents the utility level of respondent i from the wine in the choice set t’s alternative j. The variable p represents the price level; its fixed coefficient avoids unrealistic WTP estimates implied by a random price coefficient (Hensher et al., Reference Hensher, Rose and Greene2005). The model sets OCP, non-ecolabeled wines as the reference category. The dummy-coded vector x depicts the non-price attributes, x = [Opt Out, Organic, Sustainable, NJ, Pilesgrove, California, Napa, USA].Footnote
5
The coefficients associated with x are assumed to be normally distributed. Formally,
${U_{ijt}}$
represents the utility level of respondent i from the wine in the choice set t’s alternative j. The variable p represents the price level; its fixed coefficient avoids unrealistic WTP estimates implied by a random price coefficient (Hensher et al., Reference Hensher, Rose and Greene2005). The model sets OCP, non-ecolabeled wines as the reference category. The dummy-coded vector x depicts the non-price attributes, x = [Opt Out, Organic, Sustainable, NJ, Pilesgrove, California, Napa, USA].Footnote
5
The coefficients associated with x are assumed to be normally distributed. Formally, ${\bf{\mu }}\sim{\rm{N}}\left( {{\bf{\beta }},{\rm{\;}}{{\bf{\sigma }}^2}} \right)$
:
${\bf{\mu }}\sim{\rm{N}}\left( {{\bf{\beta }},{\rm{\;}}{{\bf{\sigma }}^2}} \right)$
: ${\bf{\beta }}$
corresponds to the mean;
${\bf{\beta }}$
corresponds to the mean; $ {\sigma ^2}\;$
corresponds to the variance term that captures unobserved taste variation. The random coefficients are specified correlated to account for correlated taste among the attributes (Hensher et al., Reference Hensher, Rose and Greene2005).
$ {\sigma ^2}\;$
corresponds to the variance term that captures unobserved taste variation. The random coefficients are specified correlated to account for correlated taste among the attributes (Hensher et al., Reference Hensher, Rose and Greene2005).
The model’s likelihood function involves an integral without a closed-formed solution. It is thus estimated with the Maximum Simulated Likelihood Method of STATA 15’s Mixlogit module (Hole, Reference Hole2007; Train, Reference Train2003). The results are simulated with 2000 Halton draws, where the stability of the estimates is established (Walker, Reference Walker2002).
WTP estimates are derived from the ML model. Means of the WTP are calculated as $ - {\beta _{attribute}}/\alpha $
, and their standard errors are derived with the delta method (Hensher et al., Reference Hensher, Rose and Greene2005). To illustrate taste heterogeneity, the median and the 25th percentile of the WTP are simulated with the Krinsky and Robb method; specifically, 1,000 vectors of
$ - {\beta _{attribute}}/\alpha $
, and their standard errors are derived with the delta method (Hensher et al., Reference Hensher, Rose and Greene2005). To illustrate taste heterogeneity, the median and the 25th percentile of the WTP are simulated with the Krinsky and Robb method; specifically, 1,000 vectors of ${\beta _{attribute}}$
are generated, wherein the random coefficients’ correlation is accounted (Hensher et al., Reference Hensher, Rose and Greene2005).
${\beta _{attribute}}$
are generated, wherein the random coefficients’ correlation is accounted (Hensher et al., Reference Hensher, Rose and Greene2005).
5. Sampling
Per the Tailored Design Method (Dillman, Reference Dillman2007), the survey was pilot-tested with a small panel of 18 respondents which include several experts of the method; the panel’s comment was used to enhance the clarity of the survey. After this, the sampling was carried out online in November 2017 over a period of 21 days by Qualtrics, a professional survey company that also provided the survey software (Qualtrics, 2019). The average time taken to complete the survey is around 13 min. The respondents, per common practice, were compensated with token gifts for their participation by the online panel company.
The study targets a national distributed sample, where it elicited responses from 1,047 American wine consumers. Those who claimed no consumption of wine per week on average are screened out of the sample; the mode and median glasses of wine per week are 1–3 glasses (Table 2). Slightly more than half of the sample is female (52.15%). Most (62.2%) have some college experience, which corresponds to the U.S. population statistics of 59% (Ryan and Bauman, 2016). The reported mean household income is about $52,000—slightly lower than the median household income of $59,000 (United States Census Bureau, 2017). The lower income is potentially due to the way the top income group is coded in this study (above $100,000 is coded as $105,000). Overall, the sample corresponds reasonably to the characteristics of the U.S. population. Additionally, the sample also corresponds reasonably to the range of demographic characteristic noted in other reports (Thach and Camillo, 2018; Wine Intelligence, 2018); in particular, the education profile matches those reported in Thach and Camillo (2018) and the gender distribution to Wine Intelligence (2018); higher income than this study is noted in both reports, which again may be due to the way our data is categorized.
Table 2. Summary statistics of the sample

Notes: N = 1,047, 8 missing values in income data. Income of less than $10,000 is coded as $10,000; income of more than $100,000 is coded as $105,000; mid-points are used otherwise.
Source: Gender distribution (Kaiser Family Foundation, 2017).
We evaluate if the results is skeewed by the preference of New Jersey residents, particularly if they exhibit a strong preference for OCP. Residents of New Jersey make up 3.4% of the sample, which tracks the population statistics (United States Census Bureau, 2017). To verify the potential bias, a ML model is tested. This model includes additional terms, where a dummy variable indicating that the respondent is New Jersey resident interacts with the appellation variables (Appendix Table A1). The results show that none of the interaction terms is statistically significant, indicating that the collective preference for the appellations of New Jersey residents is not different from the whole sample. Thus, the concern of the bias is minimal.
6. Results
For a fuller context, the respondents’ perceived quality of wines is included as a preview. The ratings are tabulated in Table 3.Footnote 6 As expected, Napa implies the highest quality for the respondents; more than 70% of the sample perceives that the appellation implies higher than average quality. The ratings given to USA and OCP are statistically equivalent (P = 0.64; mean [USA] = mean [OCP]), but lower than the ratings for Napa (P < 0.001 in both cases). However, in this setting, “USA” was attached to “Outer Coastal Plain,” which might have elevated the ratings given to OCP. The ratings given to NJ and Pilesgrove are the lowest, where the mean scores are around the “average” rating; t-tests suggest that both are rated lower than OCP (P < 0.001 in both cases). These results thus suggest that OCP is perceived as better than NJ and Pilesgrove. While the data are not directly available, the respondents are unlikely to mistake OCP as a California appellation, since the percentage of respondents who rated OCP as being above average is vastly less than the percentage who rated Napa highly; also, Californian wine, in general, is perceived positively (Orth et al., Reference Orth, McGarry Wolf and Dodd2005).
Table 3. Quality rating by appellations

Notes: N = 1,047. 1 = far below average; 2 = somewhat below average; 3 = average; 4 = somewhat above average; 5 = far above average. The question is worded as: “Based on your intuition, what do these tell about the wine quality?”
We analyze ratings by the subsample of New Jersey residents. The main distinction is that NJ and Pilesgrove receive higher ratings than the full sample, where both are statistically equivalent to USA. The ratings given to the pair are also higher than OCP (P = 0.013 for mean [NJ] > mean [OCP]; P = 0.06 for mean [Pilesgrove] > mean [OCP]). The state’s residents value products with the “New Jersey” relatively higher than the full sample. Further, the lower relative rating of OCP suggests that New Jersians are uninformed since the three New Jersey appellations are closely related.
7. Econometric Estimates
The ML model converges with McFadden R
2 of 26% (Table 4) (Hensher et al., Reference Hensher, Rose and Greene2005). The price coefficient ( $\alpha $
) is negative (P < 0.01) as expected. The opt-out coefficient
$\alpha $
) is negative (P < 0.01) as expected. The opt-out coefficient $\;({\beta _{opt - out}}$
) is negative (P < 0.01)—a sign of successful sample screening, as the respondents are interested in the products. The positive coefficient
$\;({\beta _{opt - out}}$
) is negative (P < 0.01)—a sign of successful sample screening, as the respondents are interested in the products. The positive coefficient $\;({\beta _{organic}}$
) indicates that organic is a preferred attribute, although at the mean level, consumers are indifferent toward sustainable winemaking.Footnote
7
Six of eight diagonal elements of the random coefficient’s Cholesky matrix are statistically significant, suggesting substantial taste heterogeneity toward the attributes (Hensher et al., Reference Hensher, Rose and Greene2005). A joint test that all the tested appellations are equivalent to OCP is rejected (P < 0.01), indicating that the origin labels affect consumer choice.
$\;({\beta _{organic}}$
) indicates that organic is a preferred attribute, although at the mean level, consumers are indifferent toward sustainable winemaking.Footnote
7
Six of eight diagonal elements of the random coefficient’s Cholesky matrix are statistically significant, suggesting substantial taste heterogeneity toward the attributes (Hensher et al., Reference Hensher, Rose and Greene2005). A joint test that all the tested appellations are equivalent to OCP is rejected (P < 0.01), indicating that the origin labels affect consumer choice.
Table 4. Mixed Logit (ML) estimates
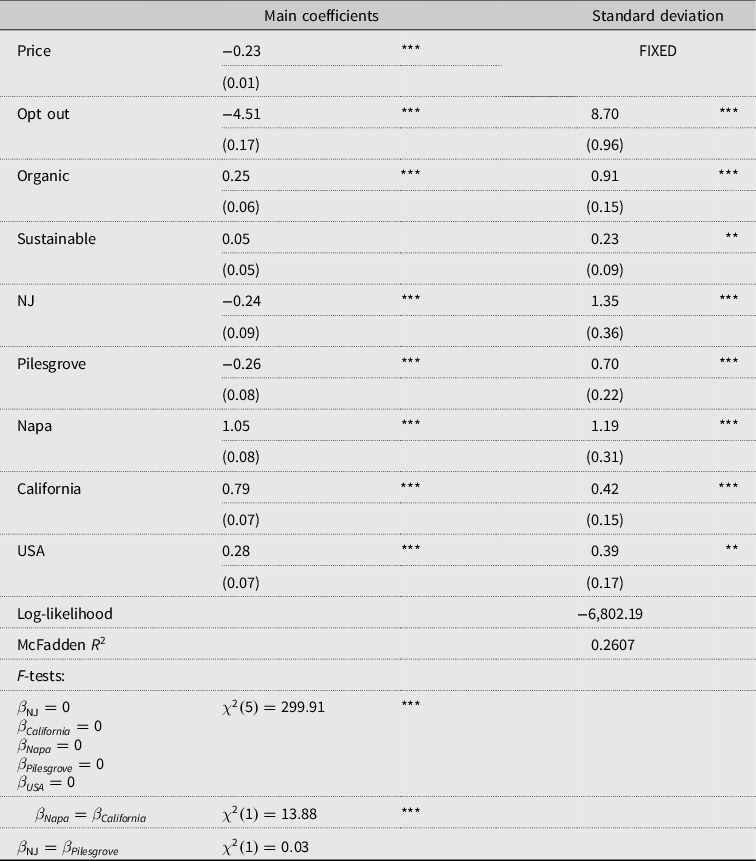
Notes: Single, double, and triple asterisks (*, **, ***) indicate statistical significance at the 10%, 5%, and 1% level. Standard errors in brackets.
The utility estimates infer a hierarchy of appellations. Napa is the most preferred, followed by California; their difference is statistically significant (P < 0.01), suggesting Napa is more preferred among the two. The Product of USA comes third. OCP, the omitted category, ranks fourth. The last pair is the New Jersey and Pilesgrove wines, where they are not statistically different (P = 0.86). These estimates largely fit the expected hierarchy of appellations, and our key interest is that the utility associated with OCP is significantly different from all other examined appellations.
With the negative $WT{P_{NJ}}$
(P < 0.01), consumers prefer OCP over the NJ state appellation (Table 5). The average consumer is willing to pay about $1.00 more for the OCP wines. And 25% of the consumers are willing to pay $4.00 per bottle more for the OCP wines (Table 5). Thus, the result supports the benefit of switching from state appellation to the AVA.
$WT{P_{NJ}}$
(P < 0.01), consumers prefer OCP over the NJ state appellation (Table 5). The average consumer is willing to pay about $1.00 more for the OCP wines. And 25% of the consumers are willing to pay $4.00 per bottle more for the OCP wines (Table 5). Thus, the result supports the benefit of switching from state appellation to the AVA.
Table 5. WTP derived from the ML model

Notes: Single, double, and triple asterisks (*, **, ***) indicate statistical significance at the 10%, 5%, and 1% level. Standard errors are calculated with the delta method. Percentile is calculated by Krinsky and Robb simulation that account for the correlated random coefficients. Standard errors in brackets. $WT{P_{Pilesgrove}}$
is statistically equivalent to
$WT{P_{Pilesgrove}}$
is statistically equivalent to $WT{P_{NJ}}$
(P = 0.86), but it is lower against
$WT{P_{NJ}}$
(P = 0.86), but it is lower against $WT{P_{OCP}}$
(P < 0.01). Consumers are indifferent between both wines explicitly noted as from New Jersey, despite one indicates the township and another only the state. However, OCP elicited a higher WTP than Pilesgrove when both could have been identical wines. Given that the state of origin is omitted from the OCP label, the omission may have contributed to the preference of OCP wines, as previously observed.
$WT{P_{OCP}}$
(P < 0.01). Consumers are indifferent between both wines explicitly noted as from New Jersey, despite one indicates the township and another only the state. However, OCP elicited a higher WTP than Pilesgrove when both could have been identical wines. Given that the state of origin is omitted from the OCP label, the omission may have contributed to the preference of OCP wines, as previously observed.
The OCP label affects competitiveness. There are substantial differences in WTP between Napa and California wines to New Jersey wines ($5.71 and $4.53, respectively). The OCP label lowers the gaps considerably. Switching from New Jersey to OCP reduces the gaps by $1.05 on average. The effect is pronounced at the niche level; 25% of the consumers are willing to pay only around $1.50 less for the OCP wine than the wines from Napa and California. These results again support that the AVA label is competitiveness enhancing.
Finally, the average consumer prefers Product of USA to OCP, for which they are willing to pay $1.25 higher. The preference is in line with observations that the average consumer would rely more on broader and more recognizable appellation than AVA (Atkin and Johnson, Reference Atkin and Johnson2010; Atkin and Newton, Reference Atkin and Newton2012; Bruwer and Johnson, Reference Bruwer and Johnson2010; Johnson and Bruwer, Reference Johnson and Bruwer2007b). However, the preference is not generalized to the whole sample; the WTP at the 25th percentile suggests that consumers are willing to pay more ($0.42) for OCP than for the USA-labeled wine. The contrast may be due to the differences in consumers’ characteristics, where the niche consumers may make use of AVAs more as a quality indicator. A question is nevertheless raised if denoting the American origin of an AVA label could be advantageous—e.g., OCP, USA—which future studies tailored for this purpose can verify.
8. Discussion and Policy Recommendations
To the question “do AVA labels affect consumer preference,” the answer from the results is a resounding yes. The level of preference is systematically different by appellation labels. Appellations serve as a quality cue; Napa is sought after, New Jersey wines labeled as such are less desirable. The preference for OCP is stronger on average than the preference for NJ and Pilesgrove. These observations bolster the position that the AVA may be elevating consumer preference for the New Jersey wines. The answer to should AVAs be adopted, however, is more nuanced.
The Cumulative Prospect Theory explains the observed behavior intuitively. In nutshell, the theory suggests that risk attitude is outcome dependent (Tversky and Kahneman, Reference Tversky and Kahneman1992). In context, the perception ratings imply buying New Jersey wines is viewed as a probable bad outcome. The theory observes that people are more risk-seeking when a bad outcome is more likely, i.e., in the choice between New Jersey wines and OCP, OCP’s unknown quality is more appealing. The strategy of “don’t say it’s from New Jersey” thus has its merit (Smith, Reference Smith2013).
Nevertheless, there may be exceptions especially for wineries targeting local consumers. Residents of New Jersey have given higher ratings for the wines where the state name is mentioned than from OCP.Footnote 8 The discrepancy shows that consumers can be uninformed even if the AVA is within one’s home state. When the primary market is local, the wineries should instead use appellation labels with the state name, as responding to consumers’ desire to support local farmers and businesses may be more rewarding (Darby et al., Reference Darby, Batte, Ernst and Roe2008; Di Vita et al., Reference Di Vita, Pappalardo, Chinnici, La Via and D’Amico2019; Lim and Hu, Reference Lim and Hu2016; Martinez et al., Reference Martinez, Hand, Da Pra, Pollack, Ratson, Smith and Newman2010).
Also, the strategy to adopt AVA can be less appealing in the short term. As the results show, the generic American appellation may appeal to certain segments of consumers. Nevertheless, adopting the American appellation would forego the potential to forge a regional identity, where the success—as Napa and Willamette Valley show—can bring about long-term rewards (Cross et al., Reference Cross, Plantinga and Stavins2011b; Hira and Swartz, Reference Hira and Swartz2014).
While the analysis shows a potential benefit, it is insufficient to claim that all AVAs are preferred over state appellations. The effect likely depends on the quality projected by the specific AVA, which is dependent on the semantics. Also, the context of our analysis is specific to New Jersey; while many states’ winemaking reputation may be comparable, others such as Washington and Oregon have advanced considerably in recent years. Additionally, the validity of our findings could be verified against reveal preference data in future studies. Interested winemakers should carefully gauge the cost-benefit of their proposed AVA, as well as the winemaking reputation of their state, of which our analysis may serve as a template.
The fact that AVA influences consumer preference shows that the appellation label could be valuable for wineries to shape their regional identity. This suggests that AVA should be viewed as a common asset, of which the Collective Action Theory can be a useful guide (Ostrom, Reference Ostrom1998). Wineries within an AVA can work collaboratively to increase the reputation of an AVA by sharing production knowledge and resource (Hira and Swartz, Reference Hira and Swartz2014; Johnson and Bruwer, Reference Johnson and Bruwer2007b). The reward for an improved quality image of an AVA could be immense; reputation increases of even a subset of wineries within an AVA may feed into the appellation’s wine prices, especially for wines that are in the lower price ranges (Costanigro, McCluskey, and Goemans, Reference Costanigro, McCluskey and Goemans2010).
Conversely, the AVA should not be abused as a tool to deceive; in repeated purchases, consumer experience unveils the mystique of an unknown AVA. After this, the AVA may serve either as a signal of good or bad quality contingent on consumers’ experience (Steenkamp, Reference Steenkamp1990). AVAs should be viewed as a tool for aspiring wine regions to gain competitiveness and to form a regional brand reputation, but it should not be viewed as a substitute for long-term improvements in quality.
The Mississippi Delta AVA serves as a testament that AVA is not a panacea, the AVA—established in 1984—has failed to jump-start production volume of the AVA, which covers northwestern Mississippi, parts of Tennessee, and Louisiana (Appellation America, n.d.). While AVA appears a promising but supplemental tool, quality improvement should remain the top priority for aspiring wine regions.
Noteworthily, the results unveil an inherent conflict in the dual purposes of AVA in simultaneously promoting producer interest and consumer interest. AVA can be valuable as a marketing tool, but it can arguably harm consumers when pursued as a disguise of poor wine quality. If the decision to use AVA rests upon disguising a negative with an unknown, whether the practice constitutes exploitation of consumers’ lack of information is concerning. Parallels can be drawn from the “Natural” label, which is misunderstood by consumers and yet effective as a marketing tool (Abrams, Meyers, and Irani, Reference Abrams, Meyers and Irani2010). The issue should be critically examined in future research and policy debates, especially on what AVA implies to consumers.
If it is deemed that consumers are misguided by AVAs, this deleterious effect could be addressed with a mandate of full disclosure. This suggestion follows the calls from previous studies that a more meaningful, broader regional name should be attached to an AVA label (Atkin and Johnson, Reference Atkin and Johnson2010; Johnson and Bruwer, Reference Johnson and Bruwer2007a, Reference Johnson and Bruwer2007b; McCutcheon, Bruwer, and Li, Reference McCutcheon, Bruwer and Li2009). Such disclosure can reduce the information gap and enable consumers to make better-informed decisions.
Also, the ethical issue may be resolved if AVA is elevated to an official seal of quality. Such a quality stipulation might be necessary to legitimatize and preserve the health of the AVA system; consumers who are repeatedly disappointed by AVA could conceivably discount the designation as merely a marketing ploy. To prevent the devaluation of AVA, quality standards can be established such that all products under an AVA must meet the distinctive characteristics of terroir—such as sugar content of grapes, the alcohol content of wines, to the molecular characteristics of an appellation (Mendelson, Reference Mendelson2016). The change involves production guidelines, putting the AVA more in line with the French AOC system, which many see as more substantive than the present set-up of the AVA system (Johnson and Bruwer, Reference Johnson and Bruwer2007a; Mendelson, Reference Mendelson2016).
9. Conclusions
Many AVAs have been created, and more will likely be created, despite the substantial costs of such endeavor (Alcohol and Tobacco Tax and Trade Bureau, 2020b; Johnson and Bruwer, Reference Johnson and Bruwer2007b). Yet relatively little is known about the effect of an AVA to a less renowned wine region. This study examines consumer WTP of such AVAs, using the OCP of New Jersey as an example.
The OCP AVA generates a higher WTP, in general, vis-à-vis its state appellation. Further, the AVA label reduces the WTP gap between the New Jersey wines to Californian and Napa wines, suggesting that the AVA label adds a competitive advantage. Cumulative Prospect Theory may explain the preference of an unknown AVA over a less-prestigious appellation, as consumers are risk-seeking when facing a probable bad outcome (Tversky and Kahneman, Reference Tversky and Kahneman1992).
AVA may be a double-edged sword. Its dual mandate may be increasingly fractious with ever more AVAs. If consumers deem as deception the intention to disguise an unglamorous wine origin with an AVA, the marketing benefits come at a cost to consumers. Whether the AVA system can truly benefit producers and consumers in all situations must be further scrutinized.
Appendix
Table A1. ML model with New Jersey residents interaction terms

Note: NJR denotes New Jersey Residents.


 Open access