


Impact Statement
In recent years, new technologies have been developed for combustion chambers that aim to improve the global efficiency of aeronautical engines. However, these new technologies have resulted in an increased thermal stress on the walls of the combustors, leading to the need to investigate the cooling performance of cooling liners in greater detail. The present study provides insights into the importance of considering the presence of obstacles in the design of cooling systems to ensure efficient cooling and prevent hot spots. Furthermore, the high computational costs associated with simulating the flow within a multiperforation in high fidelity simulations of combustors are out of reach for industrial use. Therefore, the study provides a database that can be used as a support to further developments of accurate models for multiperforations, accounting for the proper mass flow rate distribution.
1. Introduction
To respect current and upcoming environmental regulations, aeronautical engine manufacturers are in constant need of improving the gas turbine efficiency (Reference SchulzSchulz, 2001). To do so, thermodynamic principles point to the increase of the pressure ratio of the compressor, which also leads to a larger temperature of the burn gases. Because current materials composing the combustion chamber have a melting point well below the temperature of these burnt gases, it is mandatory, for engine safety and durability, to cool (at least some parts of) the chamber's walls. Effusion cooling, which relies on walls perforated by thousands of submilimetric holes (the wall becoming a multiperforated liner), is a method widely used for this purpose. In this approach, thanks to the existing pressure difference between the combustor casing and the combustion chamber, coolant air coming from the casing is driven through the plate and forms a film cooling on the combustor side, shielding this face from the high temperature stream induced by combustion. As illustrated in figure 1, jets of cold air downstream of each perforation coalesce on the combustor side to create a shielding cold film (Reference LefebvreLefebvre, 1999) that remains on the surface.

Figure 1. Principle of effusion cooling by multiperforation.
Table 1 compiles aerodynamic and geometrical parameters extracted from experimental and numerical investigations of effusion cooling. The first studies on effusion cooling focused on the experimental characterisation of the shielding film, i.e. its capacity to control the temperature of the plate. To this respect, it is useful to introduce the adiabatic cooling effectiveness  $\eta _{ad}$, which is nothing but the wall temperature properly scaled by the temperature of the cold and hot air streams:
 \begin{equation} \eta_{ad} = \frac{T_{hot} - T_w}{T_{hot} - T_{cold}}, \end{equation}
where hot and cold designate the hot, injection side and the cold, suction side of the plate, respectively. In addition, T w stands for the temperature of the flow at the wall. Besides quantifying the cooling effectiveness  $\eta _{ad}$, a substantial number of experiments led to the observation that several geometric parameters and aerodynamic properties have a strong impact on the cooling efficiency. In particular, the blowing ratio, $M$ of (1.2), is known to scale the thermal transport capacity (Reference Coletti, Elkins and EatonColetti, Elkins, & Eaton, 2013) and the momentum flux ratio, $J$ of (1.3), is related to detachment–reattachment of the jet (Reference Sinha, Bogard and CrawfordSinha, Bogard, & Crawford, 1991):
 $$\begin{gather} M = \dfrac{\rho_{jet} U_{jet}}{\rho_{hot} U_{hot}}, \end{gather}$$
 $$\begin{gather}J = \dfrac{\rho_{jet} U^2_{jet}}{\rho_{hot} U^2_{hot}}. \end{gather}$$
In these expressions,  $\rho _{jet}$ and $U_{jet}$ stand for the jet density and velocity, respectively, while $\rho _{hot}$ and $U_{hot}$ correspond to the density and the streamwise velocity in the injection vein. For instance, Reference Sasaki, Takahara, Kumagai and HamanoSasaki, Takahara, Kumagai, and Hamano (1979) measured the cooling effectiveness created by both a single row and multiple rows of perforations in atmospheric conditions. A dependency on the blowing ratio of the jets was clearly evidenced, showing that, for single-row holes, the maximum cooling effectiveness is reached for $M$ smaller than unity. The effect of the presence of several rows on the cooling effectiveness is also demonstrated and $\eta _{ad}$ is found to increase with the blowing ratio, an effect which reduces with an increasing number of the rows. Likewise, Reference Andrews, Asere, Gupta and MkpadiAndrews, Asere, Gupta, and Mkpadi (1990) measured the influence of the number of holes on the cooling effectiveness. More relevant to gas turbines and aeronautical engines, the influence of dilution jets on cooling has been evaluated by Reference Scrittore, Thole and BurdScrittore, Thole, and Burd (2008). They observe that the turbulence activity produced downstream of the dilutions jets tends to increase the spreading of the jets and thus improve the cooling efficiency of the liner. Note that the high temperature and pressure conditions of actual gas turbines make experiments particularly challenging. Despite such a challenge, Reference Andreini, Facchini, Picchi, Tarchi and TurriniAndreini, Facchini, Picchi, Tarchi, and Turrini (2014) has evaluated the cooling performance of multiperforations under several geometric configurations as well as flow conditions representative of an actual gas turbine. It was found that an increase of the cross-flow turbulence activity leads to an increased mixing and spreading of near-wall jets, thereby resulting in an improved cooling efficiency. It was also highlighted that tilted holes offer better wall protection at low blowing ratios, while normal holes provide better results for high blowing ratios. Experiments of Reference Sinha, Bogard and CrawfordSinha et al. (1991) evaluated how changes in the momentum flux ratio affect the cooling effectiveness of the jet and how this ratio relates to the detachment–reattachment behaviour of the jet.
Table 1. Review of studies on effusion film cooling. Here,  $M$ and $J$ stand for the blowing and momentum ratios, respectively, when applicable. The studies either involve experimental or numerical investigations on a certain number of rows in the suction or injection regions of the plate, as indicated in the ‘Type’, ‘Rows’ and ‘Regions’ columns. The ‘Acoustic’ column specifies whether the analysis includes an acoustic analysis. The ‘Accident’ column indicates whether the effusion flow is investigated with respect to an accident.

Although of major value, experiments have difficulties in matching effective gas turbine operating conditions while providing proper optical access or precise measurements. Complementarily and thanks to the progress of numerical simulations, a new way to evaluate cooling effectiveness and to study in detail complex flow mechanisms has emerged. The capability of numerical simulations has been evaluated by, among others, Reference Harrington, McWaters, Bogard, Lemmon and TholeHarrington, McWaters, Bogard, Lemmon, and Thole (2001), who compared cooling effectiveness in realistic engine conditions by comparing experiments with Reynolds-averaged Navier–Stokes (RANS) simulations for different blowing ratios and cross-flow turbulent intensities. Likewise, the flow inside and downstream of a single inclined hole for different blowing ratios has been described by Reference Leylek and ZerkleLeylek and Zerkle (1994), finding adiabatic cooling effectivenesses similar to the available experimental data. Going further, Reference Yuan, Street and FerzigerYuan, Street, and Ferziger (1999) and Reference Tyagi and AcharyaTyagi and Acharya (2003) used large eddy simulation (LES) to investigate the complex structures of a single jet in cross-flow, respectively normal to the wall and inclined to it. To take into account the impact of upstream rows, Reference Mendez, Nicoud and PoinsotMendez, Nicoud, and Poinsot (2007) and Reference Mendez and NicoudMendez and Nicoud (2008) performed LES of a bi-periodic single hole plate providing insights into the flow structure of a fully established film. Finally, Reference MacManus and EatonMacManus and Eaton (2000) performed experimental and numerical studies to describe the complex flow structures upstream of the hole inlet for super-scale and micro-perforations, under low-speed as well as transonic flight conditions.
To conclude, a substantial number of studies have demonstrated the capability of numerical simulations to predict flows associated with multiperforated plates. Compared with experiments, numerical simulations have the advantage of being applicable to operating conditions that are representative of aeronautical gas turbines. Most of the encountered studies focus either on a single hole configuration or on an array of holes unperturbed by external elements. These specific features are, however, known to be locally of importance. Typically, the presence of any geometrical singularity like a spark plug or dilution holes is expected to affect the effusion flow. A direct consequence is that the homogeneity of the shielding film is expected to be locally modified, potentially reducing locally the cooling effectiveness of the plate and thereby jeopardising the integrity of the wall. Reference Mendez, Nicoud and PoinsotMendez et al. (2007) underlined that the representation of effusion cooling is also known to have effects on the flow structure, and thus on the flame position and temperature field. With the notable exception of the work of Reference Scrittore, Thole and BurdScrittore et al. (2008), the way effusion cooling is modified by local geometric details has been overlooked in the literature. This study proposes to get closer to realistic conditions of aeronautical combustors by integrating the difficulty of the non-homogeneity of the flow around a multiperforated plate due to geometric accidents. The aim of this paper is thus to evaluate numerically the behaviour of the flow around a multiperforated liner in the presence of a geometric obstacle and to assess and evidence the impact of the latter on the mass flow distribution and cooling efficiency. The flow configuration is first described in § 2 together with the numerical strategy. The analysis of the flow structure is provided in § 3 with or without the presence of the obstacle to better illustrate the effect of the effusion inhomogeneities on the cooling efficiency.
2. Flow configuration and numerical set-up
The configuration is inspired by the work of Reference Petre, Dorignac and VulliermePetre, Dorignac, and Vullierme (2003) and was designed to be as simple as possible while relevant to an actual perforated liner in a combustor. Geometric details about the configuration are provided in figure 2. It is composed of a perforated plate of thickness  $e$ containing an array of 17 staggered rows of 12 inclined holes separating two veins: a lower suction vein standing for the cold high pressure casing and an upper injection vein standing for the hot low pressure combustor. The streamwise row spacing and the spanwise hole spacing are $\varDelta =3.5$ mm. The plate is of dimension $30\varDelta \times 12\varDelta$ and the perforations are located between $x/\varDelta =6$ and $x/\varDelta =22$. A spark plug guide is modelled by a solid cylindrical obstacle located in the suction vein only and centred at $x/\varDelta =12$ on the seventh row of the multiperforation. Note the absence of 19 perforations due to the presence of the cylinder. Two configurations are considered, as illustrated in figure 3: case WO, without obstacle, will be used as a reference for comparison, whereas case W represents the case with the added cylindrical obstacle. To reduce the computational cost and assuming that the domain of case WO is periodic in the $z$-direction, only one sixth of the corresponding domain is simulated, as presented in figure 2. Note that, for clarity, for case WO all $(x,z)$ views correspond to a duplication of the truly computed domain. Note also that, for the analyses to come, several geometric planes and markers are introduced in figures 2, and 3. For example, $\mathcal {P}_{xz}$ is a plane parallel to the perforated plate located at mid-height of the suction vein at $y=-e-h/2$; $\mathcal {P}_{xy,0}$ and $\mathcal {P}_{xy,4}$ are normal to the $z$-axis (spanwise direction) at $z/\varDelta =0$ and $z/\varDelta =4$, respectively. Specific perforations are also identified by red and blue markers. The main geometric characteristics are summarised in table 2.

Figure 2. Detailed geometry: ( $x,y$)-view at $z=0$ of case W (a), ( $x,z$)-view at $y=-e$ of case WO (b) and ( $x,z$)-view at $y=-e$ of case W (c). Elements relevant for discussions are displayed: planes $\mathcal {P}_{xz}$, $\mathcal {P}_{xy,0}$ and $\mathcal {P}_{xy,4}$, and perforations (blue and red markers).

Figure 3. Three-dimensional view of the set-ups of case W (left) and case WO (right). Elements relevant for discussions are displayed: planes  $\mathcal {P}_{xz}$, $\mathcal {P}_{xy,0}$ and $\mathcal {P}_{xy,4}$, and perforations (blue and red colours).
Table 2. Geometric parameters.

The operating point is based on helicopter engine conditions with an air mixture. The mean static pressure is  $4.5\, {\times}\, 10^5$ Pa with a relative pressure drop of approximately 3 % across the plate. The main inlet and outlet flow conditions of the injection and suction veins are given in table 3. The corresponding blowing and momentum flux ratios are $M=4$ and $J=7$, respectively. Likewise, for the case considered, the Reynolds number based on the obstacle diameter and cold flow stream properties equals $Re_D=3 \times 10^4$.
Table 3. Boundary flow conditions.

In terms of simulations, all reported predictions use the LES AVBP solver (Reference Gicquel, Gourdain, Boussuge, Deniau, Staffelbach, Wolf and PoinsotGicquel et al., 2011; Reference Schonfeld and RudgyardSchonfeld & Rudgyard, 1999) developed by CERFACS (Centre Européen de Recherche et de Formation Avancée en Calcul Scientifique). For the present work, the  $\sigma$ subgrid-scale model of Reference Nicoud, Toda, Cabrit, Bose and LeeNicoud, Toda, Cabrit, Bose, and Lee (2011) and Reference Baya Toda, Cabrit, Truffin, Bruneaux and NicoudBaya Toda, Cabrit, Truffin, Bruneaux, and Nicoud (2014) is used along with a second-order accurate scheme in space and time (Reference Lax and WendroffLax & Wendroff, 1960; Reference Schonfeld and RudgyardSchonfeld & Rudgyard, 1999). Navier–Stokes characteristic boundary conditions described by Reference Poinsot and LelePoinsot and Lele (1992) are used for the inlet and the outlet boundary conditions. Walls are assumed adiabatic, neglecting the effect of pre-heating of the effusion flow by the plate. Finally, and to alleviate the mesh resolution requirements, walls are dealt with a law of the wall (Reference Schmitt, Poinsot, Schuermans and GeigleSchmitt, Poinsot, Schuermans, & Geigle, 2007). For proper flow prediction and dynamics, the mesh used has been adapted using MMG3D (Reference Dobrzynski and FreyDobrzynski & Frey, 2008) along with the loss in kinetic energy criterion (Reference Daviller, Brebion, Xavier, Staffelbach, Müller and PoinsotDaviller et al., 2017), which ensures a proper representation of the energy dissipation and pressure loss. This led to 20 million tetrahedra for case WO and 110 million tetrahedra for case W. As a result, cells are mostly concentrated inside the perforations, ensuring that approximately 20 tetrahedra per diameter are present in the vicinity of the plate and around the obstacle, figure 4.

Figure 4. Crinkle view of the mesh on the centreplane  $\mathcal {P}_{xy,0}$ of the set-up for case WO (a) and case W (b), along with a zoom on the mesh of perforation H108.
A reference characteristic time,  $\tau$, is defined from the cold flow velocity and the obstacle diameter, i.e. $\tau ={D}/{U_{cold}} \sim 0.56$ ms. Before analysis, all simulations are conducted for at least 16 $\tau$, so that the total mass flow rate through the multiperforation shows less than 1 % deviation from its mean. Results are then averaged over $21\tau$, for a total of 2.6 million iterations and 20 million nodes (for case W). In terms of the characteristic time of the multiperforated plate $\tau _j = {l}/{U_{jet}}$ (based on the length of the perforation, $l={e}/{\sin {\alpha }}$, and the velocity of the jet, $U_{jet}$), simulations are averaged for a duration of $420 \tau _j$.
3. Results and discussion
The following intends first to analyse the impact of the presence of the obstacle on the multiperforation efficiency. The different flow features are then investigated to understand the results found. The behaviour of the multiperforated plate in presence of the obstacle is then studied in more details.
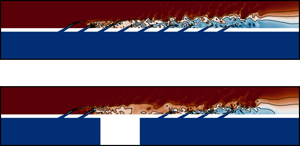
The main objective of a multiperforation is to insulate the wall from the hot gas by use of fresh gases film. The establishment of the film cooling on the injection side of the plate is presented by the instantaneous view of the temperature field on the  $(x,y)$-centreplane, $\mathcal {P}_{xy,0}$, in figure 5 for cases WO and W. The initial observation is the interruption of the cooling film within this plane for case W in comparison with the continuous establishment observed along the streamwise direction in case WO. The primary reason for this disruption in the establishment of the film is the absence of perforations above the obstacle location, which leads to the interruption of the fresh air supply into the cooling film. After the obstacle, on row 11, the film establishment resumes but never reaches the cooling state observed at the end of the plate of case WO. The time-averaged cooling effectiveness $\eta _{ad}$ is shown over the entire plate figure 6(a) while figure 6(b) displays its streamwise evolution over lines belonging to plane $\mathcal {P}_{xy,0}$. In this view, note that the efficiency coefficient is span averaged over a width $\varDelta$ centred on the centreplane $\mathcal {P}_{xy,0}$. To evaluate the behaviour away from axis of symmetry of the obstacle, an additional profile centred on plane $\mathcal {P}_{xy,4}$ is shown for case W only, as the cooling effectiveness variation is found to be mainly axial for case WO.

Figure 5. Fields of instantaneous static temperature on the centreplane  $\mathcal {P}_{xy,0}$ for case WO (a) and case W (b).

Figure 6. Time-averaged adiabatic cooling effectiveness for case WO and case W on the injection sidewall, i.e.  $y/\varDelta =0$. (a) The $(x,z)$ field of case WO (top) and case W (bottom). (b) Axial profile, space averaged over a distance $\varDelta$ in the spanwise direction and centred on $\mathcal {P}_{xy,0}$ (——– and – – –, red) and $\mathcal {P}_{xy,4}$ (– - – - –, blue).
As first evidenced by the temperature field in figure 5, the jets of the first rows remain coherent and it takes around three rows for the coolant air to reach the wall. As a result, no cooling is found up to row 3 both for case WO and case W. The first wall cooling effect appears between rows 3 and 4, where  $\eta _{ad}$ increases from 0 % to around 40 %. Afterwards, the cooling effectiveness evolution is found to be mainly axial in case WO, with a continuous increase of $\eta _{ad}$ from 40 % to 75 % when reaching the last row of perforations. Contrarily, in case W, the presence of the obstacle is seen not only to impact the axial evolution of $\eta _{ad}$ but also its spanwise distribution. Along $\mathcal {P}_{xy,0}$, above the obstacle, $\eta _{ad}$ levels at 40 % before the interruption of the film cooling feeding process. The maximum impact of the obstacle on the cooling effectiveness is observed near row 11 ( $x/\varDelta =17$), where the produced delay shows a decrease of $\eta _{ad}$ below 40 % compared with case WO. From row 11 on, the increase of $\eta _{ad}$ resumes and rises to reach a value of around 67 % for the last row of perforations, i.e. 10 % lower than for case WO. Note, however, that by moving away from the centreplane by a distance of $4\varDelta$, the cooling effectiveness recovers the behaviour found without the obstacle with an even higher cooling of around 5 % near row 12.
Although the absence of perforations above the obstacle is assumed to be the main cause, the differences of cooling effectiveness between case W and case WO are also produced by the impact of the obstacle on the local mass flow rate of coolant air through the liner. The mean spatial distribution of the mass flow rate through the multiperforations has been extracted numerically and is provided through the maps displayed in figure 7. This specific view was built by interpolating the time-averaged individual perforation mass flow rates on a Cartesian grid covering the entire perforated region. The mass flow rate map is shown specifically in figure 7(a), comparing the mass flow distributions of case WO (top half) and case W (bottom half). For the sake of clarity, the obstacle and the perforations are drawn on top of the view. As a complement, the map of relative difference between case W and case WO is displayed in figure 7(b). Finally, a more quantitative description along the streamwise axis is given in figure 8 for the perforations intersecting the centreplane  $\mathcal {P}_{xy,0}$ for both cases as well as for plane $\mathcal {P}_{xy,4}$ for case W only.

Figure 7. Time-averaged maps. (a) Map of the perforation-wise mass flow rate of case WO (top) and case W (bottom). (b) Map of the perforation-wise relative difference between case W and case WO.

Figure 8. Time-averaged mass flow rate of the perforations intersecting plane  $\mathcal {P}_{xy,0}$ and $\mathcal {P}_{xy,4}$.
In the absence of an obstacle, the mass flow rate evolves mainly in the streamwise direction and can be assumed converged after row 9. Contrarily, the presence of the obstacle in the suction vein of case W results in a heterogeneous distribution of the mass flow rate on the plate. Namely, the mass flow rate of the perforations located in the wake of the obstacle is significantly affected, decreasing approximately by 7 % before gradually reaching nominal values after five rows. On the other part of the plate, the mass flow rate is found to globally increase by approximately 4 % compared with case WO, except for the perforations located just upstream of the obstacle: row 4. Therefore, the decreased mass flow rate for the jets in the wake of the obstacle contributes to reducing the cooling effectiveness while the latter is enhanced by the increased mass flow rate found on the side of the plate. Going further, the highest values of mass flow rates on the sides of the plate, i.e. on  $\mathcal {P}_{xy,4}$, are axially located between the obstacle's abscissa and row 10. However, at the same spanwise location, case W exhibits an improved cooling compared with case WO only from row 12. This shift is attributed to the high blowing ratio ( $M=4$), under which condition the jets experience significant penetration, consequently postponing their thermal impact on the wall. This finding is coherent with observations of the initial rows, where a spatial latency exists between the first row of jet and its influence on the wall temperature.
The mass flow rate through a perforation results from the aerodynamics of the flow near the plate as well as the pressure loss occurring within the perforation. The heterogeneity in the mass flow rate distribution through the plate in case W can therefore be attributed to such factors. An instantaneous view of the velocity field on the  $(x,y)$-centreplane, $\mathcal {P}_{xy,0}$, is shown in figure 9 for both cases WO and W. In case WO, the velocity of the flow in the suction vein decreases linearly from the first row to the last row of the plate, due mainly to the fact that mass is transferred from the suction to the injection vein. In contrast, the presence of the obstacle in case W results in the formation of a turbulent wake ( $Re_D=3 \times 10^4$ based on the obstacle diameter and flow conditions in the suction vein), which impacts the flow through the holes located directly behind the cylinder and therefore their alimentation.

Figure 9. Fields of instantaneous velocity magnitude on the centreplane  $\mathcal {P}_{xy,0}$ for case WO (a) and case W (b).
The time-averaged velocity field on the mid-height  $(x,z)$-plane of the suction vein, $\mathcal {P}_{xz}$, figure 10(a), shows that the velocity magnitude is significantly reduced in the wake of the obstacle. The presence of a stagnation point upstream of the obstacle and an increase in the flow velocity on its side due to the restriction of section can also be noted. Likewise, figure 10(b) shows that the static pressure field in the suction vein is directly impacted by the obstacle compared with case WO. Indeed, in the latter case, the static pressure increases with the rows as the velocity decreases so that the total pressure is conserved (figure 10c). However, the presence of the obstacle in the flow produces an over-pressure on the stagnation point upstream of it, as well as a decrease of the pressure on the side of the plate, resulting in the conservation of the total pressure. In the wake of the obstacle, however, the total pressure loss is found to be of the order of magnitude of 10 % compared with the mean pressure drop across the plate, i.e. around 1300 Pa. Since the local pressure drop is the primary driver of the mass flow rate through the perforation, the observed decrease in flow rate in the wake of the obstacle is expected to be the print of the total pressure loss that occurs at this particular location.

Figure 10. Fields of time-averaged aerodynamic quantities on the mid-height plane  $\mathcal {P}_{xz}$ of the suction vein of case WO (top) and case W (bottom). (a) Velocity magnitude. (b) Static pressure. (b) Total pressure.
In addition to the local pressure drop across the plate, the specific pressure loss inside each perforation is expected to have an impact on the heterogeneous distribution of mass flow rate through the plate. These losses take into account the effect of friction or turbulence and are usually quantified by the dimensionless discharge coefficient  $C_d$, defined by (3.1)
 \begin{equation} C_d = \dfrac{\dot{m}}{\dot{m}_{th}}, \end{equation}
which relates the actual mass flow rate  $\dot {m}$ and the theoretical mass flow rate $\dot {m}_{th}$ obtained by assuming a one-dimensional isentropic expansion along with negligible compressibility effects (3.2) (Reference Champion, Di Martino and CoronChampion, Di Martino, & Coron, 2008)
 \begin{equation} \dot{m}_{th} = S\sqrt{2 \rho_{jet} (\varDelta p_{t,cold} - p_{s,hot})}. \end{equation}
In this expression,  $S$ is the cross-section of the perforation, $\rho _{jet}$ is the jet density and $p_{t,cold}$ and $p_{s,hot}$ stand for the total and static pressures on the suction and injection sided of the perforation, respectively.
Figure 11 presents a comparison of  $C_d$ obtained with and without an obstacle, represented by a qualitative map as well as a quantitative plot using the same format as in figure 8. In the absence of obstacle, the discharge coefficient is nearly constant, ranging from $C_d=0.85$ to 0.86. On the contrary, in case W, the presence of the obstacle results in a heterogeneous spatial behaviour of $C_d$; the discharge coefficient ranges from $C_d=0.84$ upstream and in the wake of the obstacle to $C_d=0.89$ on the side of the plate. Note that the behaviour of the discharge coefficient map globally matches the mass flow rate map in figure 7. The pressure losses are therefore likely to have a significant impact on the mass flow rate through the plate.

Figure 11. Time-averaged discharge coefficient results. (a) Maps of case WO (top) and case W (bottom). (b) Values of the perforations intersecting planes  $\mathcal {P}_{xy,0}$ and $\mathcal {P}_{xy,4}$.
As discussed by Reference Hay and LampardHay and Lampard (1998), Reference Champion, Di Martino and CoronChampion et al. (2008) and Reference Gritsch, Schulz and WittigGritsch, Schulz, and Wittig (2001), the discharge coefficient depends on several geometric characteristics, fluid properties and flow conditions such as the perforation diameter, the inclination angle, the Reynolds number inside the hole or the inlet and the outlet cross-flow conditions. Since neither the geometry of the perforations nor the fluid properties are changed between the two cases, only the local flow conditions are likely to create the differences of  $C_d$ observed in figure 11.
To better comprehend the impact of the obstacle on the local flow and its influence on the pressure losses inside the perforations between case WO and case W, a closer examination is carried out on perforation H108 located on row 11 just downstream of the obstacle of case W. Figure 12 presents the time-averaged view of the velocity field on the ( $x,y$)-centreplane, $\mathcal {P}_{xy,0}$, focused on perforation H108 (see figure 2) for cases WO and W. As a consequence of the sharp turn of the flow entering this hole, a low-momentum region described by Reference Mendez, Nicoud and PoinsotMendez et al. (2007), Reference Iourokina and LeleIourokina and Lele (2006) and Reference Leylek and ZerkleLeylek and Zerkle (1994) appears on the leading edge of the perforation. The decrease in the effective cross-section results in energy losses within the perforation. As previously evidenced by the instantaneous velocity field in figure 9, the obstacle creates a turbulent wake that modifies the direction and the magnitude of the flow velocity at the entry of the perforations downstream of the obstacle. Due to the alterations in the flow velocity entering perforation H108 in case W, the low-momentum region is enlarged, resulting in an augmented pressure loss and subsequent reduction in the discharge coefficient. By extending this development to the entire multiperforation, the velocity field depicted in figure 10(a) correlates with the discharge coefficient map.

Figure 12. Time-averaged velocity fields of the perforation H108 on the centreplane  $\mathcal {P}_{xy,0}$ for case WO (a) and case W (b).
In addition to this overall trend, specific attention is now directed towards the two perforations positioned immediately upstream of the obstacle in case W (blue marks in figure 2). A singularity is visible in the velocity field in figure 9 directly beneath row 4 at  $x/\varDelta =9$. This singularity can be identified as a steady vortex that penetrates through the two specific perforations, and is characterised by the iso-contour of Q-criterion depicted in figure 13, where $Q$ is defined as the second invariant of the velocity gradient tensor, $Q = \frac{1}{2} \bigl( \lVert \Omega \rVert ^2 - \lVert S \rVert ^2 \bigr)$. As a result, the vortex is responsible for a higher pressure loss, which is illustrated by the lower discharge coefficient observed just upstream of the obstacle in figure 11.

Figure 13. The Q-criterion iso-contour highlighting a vortex located just upstream of the obstacle and entering the two perforations (bluemarks in figure 2).
Besides the time-averaged spatial behaviour of the mass flow rate through the multiperforation, the presence of the obstacle also induces temporal variations in the mass flow rate. The time evolution of the minimum, mean and maximum mass flow rates per perforation are shown in figure 14 as well as the mass flow rate of perforation H108 (see figure 2). The mass flow rate of case WO is nearly constant over time, with 5 % difference between the minimum and the maximum values. Meanwhile, in case W, despite a constant mean mass flow rate over the perforations, the presence of the obstacle induces a highly unsteady mass flow rate. The amplitude of the perforation-wise mass flow rate fluctuations is of the order of 18 % on average from the mean value and reaches 37 % at  $t=37.1$ ms. With regards to perforation H108, the amplitude of the fluctuations is approximately 20 % compared with 2 % in case WO, at the same location. Note also that, as discussed through the map of mass flow rate in figure 7, the mean mass flow rate, averaged over the whole liner, is found to be higher in case W than in case WO while the opposite is true when considering H108.

Figure 14. Time evolution of the minimum, mean and maximum mass flow rates through the multiperforation for case WO (a) and case W (b). The red curve corresponds to the perforation H108 (see figure 2).
Since the cooling air supply varies locally between cases WO and W, it is reasonable to assess quantitatively the establishment of film cooling by comparing the streamwise momentum profile at the exit of several holes. Figure 15 shows the streamwise momentum profiles over three different holes located on the centreplane  $\mathcal {P}_{xy,0}$ of the set-up (red marks in figure 2): row 3 ( $-2\varDelta$ from obstacle), row 11 ( $+2\varDelta$ from the obstacle) and row 15 ( $+6\varDelta$ from the obstacle). The profiles are time-averaged and space-averaged in the streamwise and spanwise directions over a box of size $\varDelta \times \varDelta$ centred on the perforation exit, as described in figure 16. They are plotted in the direction normal to the plate, as a function of the dimensionless distance to the wall $y/\varDelta$. The velocity at $x/\varDelta =4$ from the leading edge of the domain, in a fully established flow region upstream of the first row of the multiperforation, is also shown for reference. Perforation row 3, located just upstream of the obstacle, demonstrates the influence of the first rows on the cooling film as the streamwise momentum within the multiperforation boundary layer increases in comparison with the reference profile. At this location, the obstacle has no influence on the momentum profile. Nevertheless, downstream of the obstacle, the impact of the obstacle becomes evident, as case W exhibits a reduction in the maximum momentum of 30 % at row 11 and 20 % at row 15, in comparison with case WO.

Figure 15. Time- and space-averaged streamwise momentum  $\rho U_x$ profiles at different holes located on the centreline. The reference is taken at $x/\varDelta =4$ upstream of the first multiperforation row.

Figure 16. Averaging area for space-averaged velocity profiles.
The overall trend of the maximum streamwise momentum values in the near-wall region at the exit of the perforations located on the centreplane,  $\mathcal {P}_{xy,0}$, can be assessed in figure 17. A secondary curve is provided for case W for the perforations in the plane, $\mathcal {P}_{xy,4}$. Firstly, it is noteworthy that the behaviour of the maximum streamwise momentum along the streamwise axis is consistent with the axial trend of the cooling effectiveness (see figure 6(b)). In both cases WO and W, the maximum momentum at the exit of the perforations globally increases with the number of rows. While the trend is nearly linear for case WO, a shift in the maximum momentum is observed after the obstacle in case W. This shift tends to reduce gradually but never completely disappears within the range of the set-up. The lower momentum values in case W are first and mainly due to the absence of perforations at the obstacle's location and thus of injected mass flow rate into the boundary layer. Similar to the cooling effectiveness, the streamwise momentum is even higher within the boundary layer of the cooling film on the side of the plate for case W, which can be attributed to the higher mass flow rate found at this location (see figures 7 and 8).

Figure 17. Time- and space-averaged maximum streamwise momentum  $\rho U_x$ evolution with the row number.
4. Conclusion
The objective of this study was to examine the behaviour of the flow around a multiperforated plate under conditions that are representative of aeronautical combustion chambers. Specifically, this study aimed to investigate the effects of a geometric obstacle, such as a spark plug guide, on the multiperforation capabilities to decrease the wall temperature. To achieve this, two three-dimensional LESs were conducted: a reference case with no obstacle and a case with a solid obstacle modelled as a cylinder located in the suction vein.
As a result of the presence of the obstacle, the establishment of the film cooling and the resulting cooling effectiveness have been observed to be locally affected, with a decrease of up to 40 % in the wake of the obstacle. This reduction is attributed to both the absence of perforations above the obstacle and a decrease of 7 % in mass flow rate through the perforations located in the wake. Indeed, the spatial distribution of the mass flow rate has been observed to be non-uniform and influenced by several aerodynamic phenomena, including the local pressure drop across the plate and pressure loss within the perforation. Moreover, this simulation allows for the characterisation of a mass flow rate and discharge coefficient database, which can be used in subsequent stages to develop a mass flow rate model for multiperforations.
In tackling the issue of reduced cooling effectiveness due to the presence of an obstacle, several strategies are worth considering. Firstly, increasing the density of perforations locally upstream of the obstacle, through either the number of holes or their diameter, may preventively offset the loss of air introduction. This approach could, however, compromise the wall's mechanical integrity. In the same vein, a strategy could involve employing shaped holes upstream of the obstacle, which are gaining research attention as they demonstrate reduced jet penetration for enhanced localised cooling efficiency. As a third approach, carefully positioned perforations featuring deviation angles could strategically channel coolant air from the sides towards the obstacle's centreline, thereby achieving more uniform cooling effectiveness in the spanwise direction.
Supplementary material
Raw data are available from the corresponding author (T.D.).
Declaration of interests
The authors declare no conflict of interest.
Funding statement
This work was granted access to the HPC resources of IDRIS under the allocation 2022-[A0122A06074] made by GENCI.


 Open access