


Introduction
Intelligence—the ability to learn, reason, and solve problems [Reference Arvey, Bouchard, Carroll, Cattell, Cohen and Dawis1]—is associated with greater physical health and longevity. And yet, some researchers report that highly intelligent individuals are at a higher risk of developing mental health and somatic disorders [Reference Karpinski, Kolb, Tetreault and Borowski2–Reference Smith, Anderson, Zammit, Meyer, Pell and Mackay5]. The majority of studies that report a negative effect of intelligence on mental and somatic health, however, often suffer from sampling bias, the lack of a control group, or insufficient sample size [Reference Gauvrit6, Reference Martin, Burns and Schonlau7]. The present study addresses these caveats by examining the difference in the prevalence of mental health and somatic disorders and other traits between the highly intelligent (2 SD above mean) and averagely intelligent (within 2 SD of the mean) individuals of the UK Biobank (N ≃ 261,500).
The notion of general intelligence (g) stems from the positive correlation in performance across most cognitive tests [Reference Spearman8]. It is formally defined as the common source of variance underlying performance across a wide range of tests and is usually computed using factor analysis. Intelligence quotient (IQ) reflects a person’s average performance across cognitive tests relative to a representative sample of the same-age national population. Henceforth, IQ and g will be used interchangeably for general intelligence (g-factor) scores.
Over the last decades, intelligence has proved to be a strong predictor of education [Reference Deary, Strand, Smith and Fernandes9], socioeconomic success [Reference Schmidt and Hunter10, Reference Strenze11], and health outcomes [Reference Calvin, Batty, Der, Brett, Taylor and Pattie12–Reference Wrulich, Brunner, Stadler, Schalke, Keller and Martin15]. For instance, having a childhood IQ one standard deviation (SD) above the mean decreases one’s risk of accidents and developing heart, respiratory, and digestive disease by 20–25% [Reference Wraw, Der, Gale and Deary14, Reference Wrulich, Brunner, Stadler, Schalke, Keller and Martin15]. And yet, whether intelligence serves as a protective factor for mental health disorders is still subject to debate. Whereas some postulate that high intelligence serves as a protective factor for several mental and somatic disorders[Reference Burdick, Gunawardane, Woodberry and Malhotra16–Reference Sjölund, Hemmingsson and Allebeck19], others suggest that high intelligence is a risk factor for these phenotypes [Reference Karpinski, Kolb, Tetreault and Borowski2, Reference Lancon, Martinelli, Michel, Debals, Auquier and Guedj4, Reference Smith, Anderson, Zammit, Meyer, Pell and Mackay5, Reference Kanazawa20–Reference Williams, Hysi, Yonova-Doing, Mahroo, Snieder and Hammond22] or that the effects of intelligence vary across mental health phenotypes [Reference Wraw, Deary, Der and Gale23].
The most recent study examining the prevalence of mental health and somatic (i.e., allergies, asthma, and immunodeficiencies) disorders in highly intelligent individuals reported that high IQ was a risk factor for affective disorders, neurodevelopmental disorders, and diseases related to the immune system [Reference Karpinski, Kolb, Tetreault and Borowski2]. However, the study suffers from sampling bias because participants were recruited from the American Mensa Ltd.—a society open to individuals that at some point scored in the top 2% on a verified intelligence test (N = 3,715). Since IQ tests are typically administered to children when parents or teachers notice behavioral problems or by individuals experiencing stereotypical characteristics associated with IQ, selecting individuals from a sample of individuals who actively decided to take an IQ test or become members of a highly intelligent society may exacerbate the correlation between having a high IQ and mental health disorders and/or behavioral problems [Reference Gauvrit6, Reference Martin, Burns and Schonlau7]. The present study thus aims to address these limitations.
We investigated the difference in prevalence between individuals with high (2 SD above the population mean) and average (within 2 SD from the population mean) g-factor scores [Reference Williams, Labouret, Wolfram, Peyre and Ramus24] in the UK Biobank across mental health disorders, somatic disorders, and certain traits. We examined group differences in the prevalence of available mental health and somatic disorders in the UK Biobank, as well as phenotypes that are thought to differ in prevalence in highly intelligent individuals, such as subjective well-being phenotypes (e.g., well-being and social isolation; [Reference Li and Kanazawa25, Reference Zettergren and Bergman26]), myopia [Reference Czepita, Lodygowska and Czepita27], chronotype [Reference Ujma, Baudson, Bódizs and Dresler28], and trauma [Reference McGuire and Jackson29]. Finally, we included sexual behaviors because studies have shown heterogeneous results concerning the relationship between sexual behaviors and IQ [Reference Rahman, Bhanot, Emrith-Small, Ghafoor and Roberts30, Reference Rowe31]. As a point of comparison, we report differences in prevalence across phenotypes between the average and low (2 SD under the population mean) g-factor groups as exploratory analyses.
Methods
Analyses were conducted using R [32]. R Packages are listed in Section S3 of the Supplementary Material and the preregistration, code, and supplementary materials are available at: https://osf.io/cywd6/?view_only=fa9f5091de124d96be3eb1a55a4e7f01.
Participants
Participants were taken from the UK Biobank, an open-access large prospective study with phenotypic, genotypic, and neuroimaging data from more than 500,000 participants recruited between 2006 and 2011 at 40–69 years old [Reference Sudlow, Gallacher, Allen, Beral, Burton and Danesh33]. All participants provided informed consent (“Resources tab” at https://biobank.ctsu.ox.ac.uk/crystal/field.cgi?id=200). All procedures involving human subjects/patients were approved by the Research Ethics Committee (reference 11/NW/0382). The present study was conducted based on the UK Biobank application 46007.
G-factor
We defined our g-factor groups using g-factor scores from a previous study that are relative to the UK population [Reference Williams, Labouret, Wolfram, Peyre and Ramus24]. In brief, we calculated g-factor scores for individuals that completed at least one of the UK Biobank cognitive tests.
UK Biobank participants completed a variety of cognitive tests upon each of their visits to the UK Biobank assessment center (Category 100026) and online (Category 116), including: Fluid Intelligence, Matrix Pattern Completion, Tower Rearranging, Numeric Memory, Pairs Matching, Symbol Digit Substitution, Reaction Time, and Trail Making tests (Section S1.1 of the Supplementary Material). Most tests were completed at the first visit and we used the score of the first instance of completion if the test was completed several times.
Although the UK Biobank cognitive battery contains adapted versions of commonly used tests and tests designed for the UK Biobank, the g-factor from well-validated tests correlates highly with the g-factor from the UK Biobank cognitive tests (r = 0.83; [Reference Fawns-Ritchie and Deary34]).
Because UK Biobank participants tend to live in less socioeconomically deprived areas and are healthier than the UK population [Reference Fry, Littlejohns, Sudlow, Doherty, Adamska and Sprosen35], we expected more than 2% of UK participants in the highly intelligent group (aka individuals with g-factor > 2 SD from the UK mean). To accurately identify highly intelligent individuals in the UK Biobank, we created a g-factor that would be relative to the UK mean.
To adjust for sampling bias, we calculated weights for each UK Biobank participant based on their country of residence, sex, age range, occupation status, and occupation SOC group using public the 2001 UK census data. We then adjusted for age with a semiparametric continuous norming method that considers weights [Reference Lenhard, Lenhard, Suggate and Segerer36].
From the age-standardized cognitive tests that are relative to the UK population, we extracted a g-factor from a single-factor model. We then computed the g-factor scores’ weighted mean and SD, using the census weighting factors. Finally, we standardized each person’s g-factor score with the weighted sample mean and weighted sample SD for a general population mean of 0 and SD of 1.
We estimated the quality of the g-factor based on the combination of completed tests, and we selected participants who had a reliable estimate of the g-factor (correlation with full g-factor > 0.7; N = 261,701 participants; Section S1.2 of the Supplementary Material). Participants were excluded when there was a mismatch between the self-reported (field 31) and genetic sex (field 22001). Self-reported sex was coded −0.5 for men and 0.5 for women.
G-factor groups
We created three g-factor groups: a high g-factor group (g-factor 2 SD above the population mean), a low g-factor group (g-factor 2 SD below the population mean), and an average g-factor group (g-factor within 2 SD from the population mean). About 90% of individuals were in the average g-factor group (236,273/261,701), 6.2% in the high g-factor group (16,137/261,701), and 3.6% in the low g-factor group (9,291/261,701; sex differences in Section S1.2 of the Supplementary Material).
Phenotypes
To maximize the number of participants with a diagnosis, each phenotype was created by combining questions and diagnoses from mental health professionals and self-reported questionnaires ([Reference Davis, Coleman, Adams, Allen, Breen, Cullen, Dickens, Fox, Graham, Holliday, Howard, John, Lee, McCabe, McIntosh, Pearsall, Smith, Sudlow, Ward, Zammit and Hotopf37–Reference Smith, Nicholl, Cullen, Martin, Ul-Haq and Evans39]; Supplementary Table SA and Section S1.3 of the Supplementary Material). We examined 32 phenotypes using one or several binary, ordinal, or continuous variables (Supplementary Table SA, and Supplementary Tables SB1 and SB2).
Since the age of onset of disorders was not available for all participants and/or measures, we used the maximum age at which an individual provided the most recent measure of a disorder to approximate lifetime prevalence (Section S1.4 of the Supplementary Material).
Table 1. Phenotypic prevalence in the UK Biobank across and by sexes.

Note. Probable depression and cannabis use are ordinal but here reflect the prevalence of ever meeting the criteria regardless of severity.
Statistical analyses
To reduce the number of statistical tests when examining group differences across phenotypes, we first examined age and sex effects and interactions on each phenotype (Section S1.5.1 of the Supplementary Material). If age and sex’s main effects or interactions did not predict a phenotype (p > 0.05), they were excluded from the g-factor group analyses. Equation 1 corresponds to the model with all possible predictors (f corresponds to the logit function for binary and ordinal phenotypes and to the linear function for continuous phenotypes).
Participants were included in the g-factor group analyses if they had a g-factor measure and answered all of the questions used to create that phenotype, except when the same question was asked several times. If participants responded as having the phenotype across any of the questions, they were marked as having the phenotype, otherwise, they were marked as not having the phenotype.
Age was mean-centered in ordinal and binary regressions, whereas age and continuous phenotypes were mean-centered and divided by 1 SD in linear regressions to report standardized betas.
Equation 1:
 $$ {\displaystyle \begin{array}{l} f(Phenotype)\\ {}\hskip1.479999em =\hskip1.5pt \beta 0+\beta 1\hskip1.5pt \ast \hskip1.5pt age+\beta 2\hskip1.5pt \ast \hskip1.5pt {age}^2+\beta 3\hskip1.5pt \ast \hskip1.5pt sex+\beta 4\hskip1.5pt \ast \hskip1.5pt {CA}_{Group}+\beta 5\\ {}\hskip1.479999em \hspace{1.5pt}\ast \hskip1.5pt age\hskip1.5pt \ast \hskip1.5pt sex+\beta 6\hskip1.5pt \ast \hskip1.5pt {age}^2\hskip1.5pt \ast \hskip1.5pt sex+\beta 7\hskip1.5pt \ast \hskip1.5pt sex\hskip1.5pt \ast \hskip1.5pt {CA}_{Group}+\beta 8\hskip1.5pt \ast \hskip1.5pt age\\ {}\hskip1.479999em \hspace{1.5pt}\ast \hskip1.5pt {CA}_{Group}+\beta 9\hskip1.5pt \ast \hskip1.5pt {age}^2\hskip1.5pt \ast \hskip1.5pt {CA}_{Group}+\beta 10\hskip1.5pt \ast \hskip1.5pt age\hskip1.5pt \ast \hskip1.5pt sex\hskip1.5pt \ast \hskip1.5pt {CA}_{Group}\\ {}\hskip1.479999em +\hskip1.5pt \beta 11\hskip1.5pt \ast \hskip1.5pt {age}^2\hskip1.5pt \ast \hskip1.5pt sex\hskip1.5pt \ast \hskip1.5pt {CA}_{Group}\end{array}} $$
We report results with the g-factor group predictor that survived a Bonferroni correction for multiple comparisons of 0.05 divided by the number of coefficients in the equation with the g-factor group term times the number of coefficients of interest times the number of investigated phenotypes (e.g., 0.05/[6*32] for equation 1). Since the analyses on the low g-factor group were exploratory, we applied the same multiple comparison correction as for the high g-factor group (e.g., 0.05/[6*32] for equation 1). Odds ratio (OR) reflect the odds that a person will have a phenotype or disorder given that they are highly compared to averagely intelligent. ORs were calculated as the exponent of the regression estimate.
Results
The model assumptions of low-powered phenotypes with few cases in the UK Biobank (including, anorexia, eating disorder, schizophrenia, bipolar disorder, obsessive–compulsive disorder [OCD], social anxiety, and other hazardous substance use) were not met and should be interpreted with caution (Supplementary Files S9–S40). We additionally ran the analyses with the g-factor scores instead of the g-factor group and found consistent results with our group analyses (Section S2.4 of the Supplementary Material, Supplementary Figures S5–S8, and Supplementary Files S9–S40).
Differences in the prevalence of phenotypes between participants with high and average CA
Sex and age effects across phenotypes are described in Section S2.1 of the Supplementary Material and in Supplementary Table SC. In Supplementary Table SD, we provide the phenotypic prevalence by g-factor group and the mean and SD of the g-factor, Townsend Index, birth year, number of children, and number of individuals in the household of each g-factor group by diagnosis to describe the investigated populations. Regression results are reported in Supplementary Table SE.
Across the 32 phenotypes, the prevalence differed between the high g-factor and average g-factor groups in 15 phenotypes (47%) and between the low g-factor and average g-factor groups in 12 phenotypes (38%; Figure 1). Phenotypic differences between the low and average g-factor are discussed in Section S2.3 of the Supplementary Material. There were no significant interactions in the analyses comparing the average to the high g-factor groups.

Figure 1. Group differences in prevalence between high and average and low and average g-factor Groups across phenotypes and scores. OCD, obsessive–compulsive disorder; PTSD, post-traumatic stress disorder. Correction for multiple comparisons varies by phenotype. See Supplementary tables standard error (SE) for p-value thresholds for multiple comparison corrections. High g-factor, participants with a g-factor score 2SD above the mean; low g-factor, participants with a g-factor score 2SD under the mean; average g-factor, participants with a g-factor score between ±2 SD from the mean.
Mental health disorders
Compared to individuals in the average g-factor group, there was a 33% decrease in the odds of suffering from post-traumatic stress disorder (OR = 0.67, 95% CI [0.61;0.74]) and a 31% decrease in the odds of having general anxiety (OR = 0.69, 95% CI [0.64;0.74]) in the high g-factor group (Table 2). There was no significant difference across other mental health disorders (Figure 1).
Table 2. Phenotypes that differ in prevalence between average and high general intelligence groups.
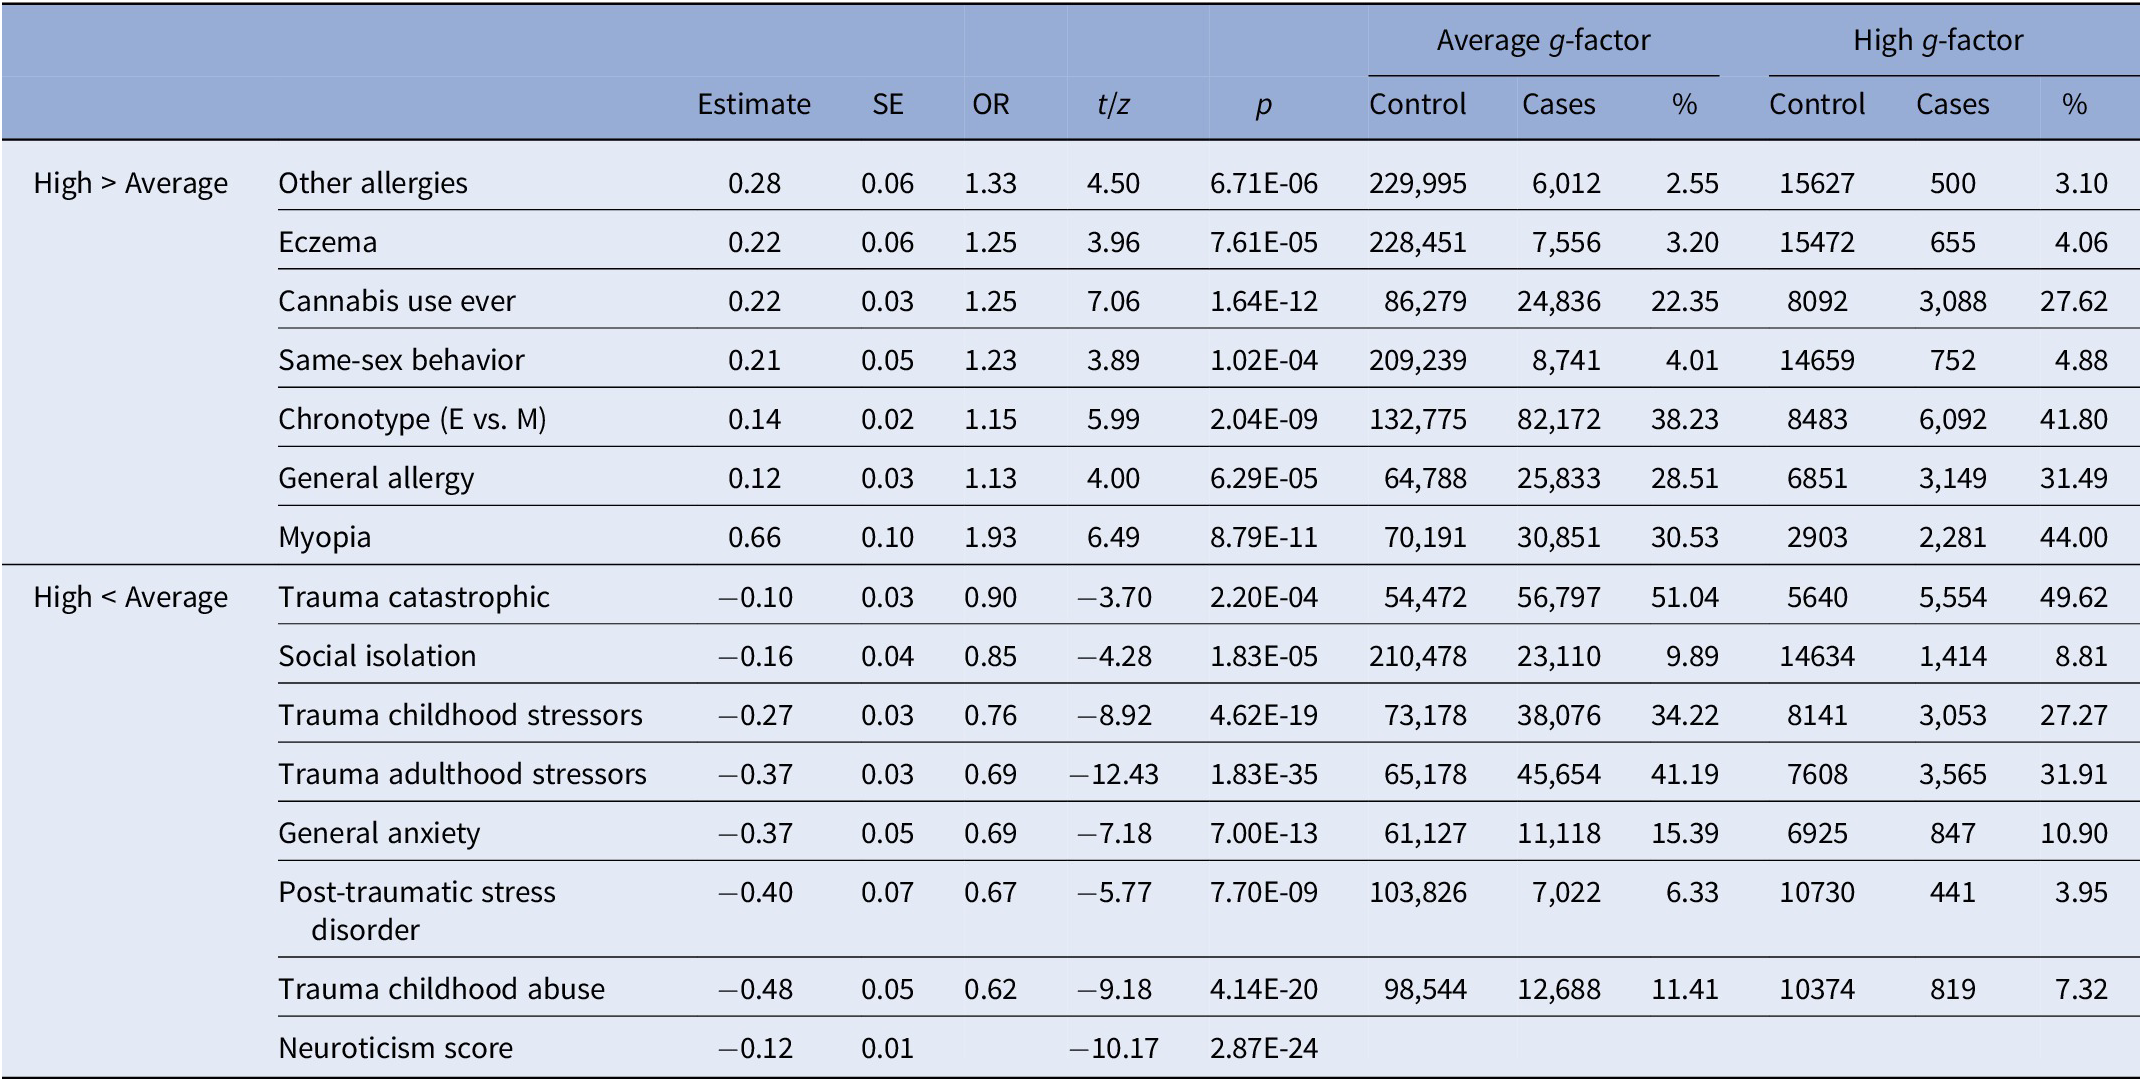
Note. Neuroticism estimate is a standardized beta.
Abbreviations: g-factor, general intelligence; high g-factor, participants with a g-factor score 2 SD above the mean; average g-factor, participants with a g-factor score between ±2 SD from the mean; Cannabis use, never used versus used at least once; E, evening; M, morning.
Somatic phenotypes
Compared to individuals in the average g-factor group, the odds of having some type of allergy increased by 13% for individuals in the high g-factor group (OR = 1.13, 95% CI [1.08;1.18]). This was explained by their greater propensity to having eczema and other allergies (e.g., food; respectively, 1.25 and 1.33 times more likely), which were included in the general allergy diagnosis (Table 2). The odds of being myopic increased by 93% in the high g-factor group (OR = 1.93, 95% CI [1.82;2.04]) and this remained significant when controlling for educational attainment (OR = 1.75; Section S2.2 of the Supplementary Material).
Trauma
Compared to individuals in the average g-factor group, the odds of experiencing catastrophic trauma, adulthood stressors, childhood abuse, and childhood stressors decreased by 10% (OR = 0.90, 95% CI [0.87;0.94]), 31% (OR = 0.69, 95% CI [0.66;0.72]), 38% (OR = 0.62, 95% CI [0.58;0.67]), and 24% (OR = 0.76, 95% CI [0.73;0.79]; Table 2) in the high g-factor group, respectively.
Traits
Compared to individuals in the average g-factor group, the odds of feeling more socially isolated decreased by 15% in the high g-factor group (OR = 0.85, 95% CI [0.80;0.90]), whereas the odds of having an evening-like chronotype, ever engaging in same-sex behavior, and ever using cannabis increased by 15% (OR = 1.15, 95% CI [1.11;1.19]), 23% (OR = 1.23, 95% CI [1.14;1.33]), and 25% (OR = 1.25, 95% CI [1.20;1.31]), respectively, in the high g-factor group. Supplementary Figure S4 shows that there are more individuals with a higher-than-average g-factor that have used cannabis 1 to 100 times and that over 100 times there are no group differences. The high g-factor group had a lower neuroticism score than individuals in the average g-factor group (β = −0.12, SE = 0.01; Table 2).
Phenotypes with group differences between both the high and average and the low and average g-factor groups
Childhood stressors, childhood abuse, adulthood stressors, PTSD, and social isolation were more prevalent in the low compared to the average g-factor group (Supplementary Table S2) and were more prevalent in the average compared to the high g-factor group (Table 2), suggesting that the prevalence of these phenotypes decreases with an increasing g-factor. The low g-factor group had a higher neuroticism score than the average g-factor group (β = 0.22, SE = 0.02), which had a higher neuroticism score than the high g-factor group. The odds of ever trying cannabis and having an evening-like chronotype, respectively, decreased by 41% (OR = 0.59, 95% CI [0.53;0.65]) and 14% (OR = 0.86, 95% CI [0.82;0.90]) in the low compared to the average g-factor group.
Discussion
We examined differences in the prevalence of mental health disorders, somatic disorders, and certain traits between individuals with high (2 SD above mean) and average g-factor scores (within 2 SD of the mean) in the UK Biobank (N ≃ 7,266–252,249). We contrasted these results with differences observed between individuals with low and average g-factor scores.
We found that the high g-factor group did not have more mental health disorders than the average g-factor group and that they were less likely to have general anxiety and PTSD. Individuals with higher intelligence were also less likely to have experienced trauma and stressors, except for adulthood abuse, which may be part of the explanation for the latter finding. The high g-factor group was also less neurotic and felt less socially isolated than the average g-factor group. In contrast, the low g-factor group was more neurotic, felt more socially isolated, and had a greater prevalence of trauma, stressors, and PTSD than the average g-factor group, suggesting that the prevalence of these phenotypes decreases with increasing intelligence. Among the few somatic disorders that were examined, we found that individuals with high intelligence were more myopic and had more allergies, although they had a lower prevalence of hay fever rhinitis and asthma. Individuals with high intelligence were also more likely to present certain traits, such as having an afternoon–evening chronotype, to have ever tried cannabis, or have ever engaged in same-sex behavior, whereas the low g-factor group was less likely to have ever tried cannabis and engaged in same-sex behavior than the average g-factor group. There were no differences between groups in the prevalence of insomnia.
Our results contradicts several studies that reported an increased risk for various psychiatric disorders in individuals with high intelligence (e.g., [Reference Karpinski, Kolb, Tetreault and Borowski2, Reference Smith, Anderson, Zammit, Meyer, Pell and Mackay5]). These studies were generally based on small samples and suffered from major sampling bias or a lack of a control group [Reference Gauvrit6, Reference Martin, Burns and Schonlau7]. We find that high intelligence is not a risk factor for psychiatric disorders and even a protective factor for general anxiety. Higher intelligence was associated with a decrease in trauma exposure, and consequently PTSD. This is consistent with previous findings [Reference McGuire and Jackson29] and with the association of childhood trauma with lower intelligence [Reference Enlow, Egeland, Blood, Wright and Wright40].
With regard to somatic disorders, we replicate the increased risk of allergies in individuals with high intelligence [Reference Karpinski, Kolb, Tetreault and Borowski2, Reference Benbow41]. One possible explanation for this association is that allergies and intelligence share neural correlates [Reference Takeuchi, Taki, Nouchi, Yokoyama, Kotozaki and Nakagawa42]. Another possibility is that more intelligent individuals with a higher g-factor live in more urban areas [Reference Jokela43], where allergies are more prevalent [Reference Schröder, Li, Wong and Schaub44], or that individuals with high intelligence are more aware of allergic symptoms and have better access to health care. However, the prevalence between groups did not differ across all allergies (e.g., asthma and hay fever rhinitis).
In line with a previous literature review [Reference Czepita, Lodygowska and Czepita27], the risk of myopia was greater for individuals with high intelligence. While near-work activities (e.g., reading and computer use) seem to be a risk factor for myopia [Reference Huang, Chang and Wu45, Reference Mutti, Mitchell, Moeschberger, Jones and Zadnik46], this association appears to be distinct from that of higher intelligence and education level [Reference Williams, Hysi, Yonova-Doing, Mahroo, Snieder and Hammond22]. Although additional years of education contribute to an increase in the risk of developing myopia [Reference Mountjoy, Davies, Plotnikov, Smith, Rodriguez and Williams47], most of the evidence points towards shared genetic factors between intelligence and myopia [Reference Williams, Hysi, Yonova-Doing, Mahroo, Snieder and Hammond22], which is consistent with our observation that the risk of myopia associated with a high g-factor only slightly decreased when adjusting for educational attainment.
Our results indicate more afternoon–evening chronotypes in individuals with high intelligence than in individuals with average intelligence, which could be explained by differences in the work schedules of the different g-factor groups [Reference Ujma, Baudson, Bódizs and Dresler28]. In line with a previous study [Reference Rahman, Bhanot, Emrith-Small, Ghafoor and Roberts30], we find that individuals with high intelligence are more likely to ever have engaged in same-sex behavior. However, we note that our measure reflects sexual exploration rather than sexual orientation. We also found an association between ever trying cannabis and intelligence, but this was only true for individuals who consumed cannabis less than 101 times in their lifetime, suggesting that this measure also reflects a tendency to explore. One possibility is that individuals with higher intelligence, which is positively correlated with the “Openness to Experience” personality trait (r = 0.30; [Reference Stankov49]), may be more likely to seek out new experiences and explore alternative behaviors than the average.
This study was first limited in its ability to study neurodevelopmental disorders and some psychotic disorders, which were absent or had few cases in the UK Biobank. We nonetheless investigated phenotypic differences in prevalence between g-factor groups across a greater number of psychiatric disorders than previously done [Reference Karpinski, Kolb, Tetreault and Borowski2, Reference Brown, Wai and Chabris50] and examined additional phenotypes, including traumatic experiences.
Second, the prevalence of some psychiatric disorders and traits differs from the general population [Reference Lenhard, Lenhard, Suggate and Segerer36] because of the UK Biobank’s “healthy volunteer” bias [Reference Fry, Littlejohns, Sudlow, Doherty, Adamska and Sprosen35]. However, this should not affect the validity of the group comparisons because the phenotypes were designed with the same criterion across high and average g-factor groups.
Third, while some data may not be missing at random, our participants are more representative of highly intelligent individuals in the general population than those from previous Mensa studies, which did not have a control group and examined individuals that had to take or decided to take an IQ test and join a society for the highly intelligent.
Fourth, although we used self-report diagnoses, which are less precise than professional diagnoses, UK Biobank participants self-reporting any psychiatric diagnosis appear to have an elevated risk of any symptom-based outcome [Reference Davis, Cullen, Adams, Brailean, Breen and Coleman51]. By using professional and probable diagnoses with validated short mental health tests, we were also able to include individuals with mental health disorders that have not sought or received mental health assistance [Reference Kessler, Amminger, Aguilar-Gaxiola, Alonso, Lee and Ustun52, Reference Newson, Karlsson and Tiemeier53].
Fifth, the prevalence of psychiatric disorders and traits between g-factor groups may differ across the lifespan. However, we were interested in lifetime prevalence, making the UK Biobank, a prospective aging study, a good candidate for the question at hand.
Therefore, while this study is not without limitations, we provide a large scaled analysis of the difference in the prevalence of numerous phenotypes, including mental health and somatic disorders, across individuals of varying intelligence. We find that high intelligence is not a risk factor for psychiatric disorders and is a protective factor for general anxiety and PTSD. Whereas our results support the advantageous nature of higher intelligence [Reference Brown, Wai and Chabris50], the g-factor may still be relevant for psychiatric evaluation: higher intelligence may affect the presentation of symptoms and the available resources for recovery.
Supplementary Material
To view supplementary material for this article, please visit https://doi.org/10.1192/j.eurpsy.2022.2343.
Data Availability Statement
This research has been conducted using data from UK Biobank, a major biomedical database (http://www.ukbiobank.ac.uk/). Restrictions apply to the availability of these data, which were used under license for this study: application 46007. Preregistration, code, and Supplementary tables and data are available on OSF: https://osf.io/cywd6/?view_only=fa9f5091de124d96be3eb1a55a4e7f01. Preprint: https://doi.org/10.1101/2022.05.26.22275621.
Acknowledgments
This research has been conducted using the UK Biobank Resource.
Author Contributions
Conceptualization: C.M.W., H.P., G.L., J.F., N.G., F.R.; Data curation: C.M.W., J.F., A.G.G.; Funding acquisition: F.R.; Methodology: C.M.W., H.P., G.L., N.G., F.R.; Supervision: H.P., N.G., F.R.; Validation: C.M.W., A.G.G., F.R.; Writing—original draft: C.M.W., H.P., F.R; Writing—review and editing: C.M.W., H.P., G.L., J.F., A.G.G., N.G., F.R.
Funding Statement
This work received support under the program “Investissements d’Avenir” launched by the French Government and implemented by l’Agence Nationale de la recherche (ANR) with the references ANR-17-EURE-0017 and ANR-10-IDEX-0001-02 PSL.
Conflict of Interest
The authors declare none.
Ethical Standards
All participants provided informed consent (“Resources tab” at https://biobank.ctsu.ox.ac.uk/crystal/field.cgi?id=200). All procedures involving human subjects/patients were approved by the Research Ethics Committee (reference 11/NW/0382) and the present study was conducted based on application 46007.


 Open access
Comments
No Comments have been published for this article.