


Policy Significance Statement
Policymakers need to be aware of the limits of evidence based on survey data, including that analysis is likely to be biased toward the characteristics of more settled populations, rather than recently arrived migrants who are the subject of most migration policy decisions. While policymakers will reasonably assume that vulnerable, low-income populations are among those most likely not to respond to surveys, they may be less aware that the issue is likely to affect migrants with higher socio-economic status such as international students and work visa holders. In the long run, governments that wish to understand and evaluate the impacts of policy changes will need to develop data sources that identify the policy channel under which migrants were admitted.
1 Introduction
Official population surveys are one of the key data sources that governments use to understand the characteristics of migrants and the implications of immigration policy, particularly in countries without high-quality administrative data on their migrant populations.
Survey data provide a rich and regularly updated source of socio-economic and demographic information about people born overseas or holding foreign citizenship, and are generally readily accessible to academic and government analysts. Indeed, in many countries, surveys provide the only widely available source of data on migrants’ activities and characteristics after they arrive in the country, other than less frequently updated Census data. This is because published administrative data are often limited to relatively basic information on the numbers, and nationalities of people receive different work or residence permits (as, e.g., in the United States, the United Kingdom, and many EU countries).
Research based on survey data has an important role to play in policymakers’ understanding of migration, and has included a number of influential studies (e.g., Chiswick and DebBurman, Reference Chiswick and DebBurman2004; Manacorda et al., Reference Manacorda, Manning and Wadsworth2012; Peri, Reference Peri2012; Dustmann and Frattini, Reference Dustmann and Frattini2014). The EU Labour Force Survey (LFS) has also been an important data source for the study of migrant populations and impacts, especially for cross-country analysis (e.g., Zaiceva & Zimmerman, Zaiceva and Zimmermann, Reference Zaiceva and Zimmermann2008; Ballarino and Panichella, Reference Ballarino and Panichella2015; Martin and Radu, Reference Martin and Radu2012).
However, survey data have important limitations for our understanding of immigration policy and its impacts, some of which are common to all policy areas and others particularly relevant to the study of migration. This article examines the promises and hazards of using survey data to examine the impacts of immigration policies, illustrated using the UK’s Annual Population Survey (APS), a fairly typical data source for researchers examining immigration in high-income countries.
2 What Do Policymakers Need From Migration Data?
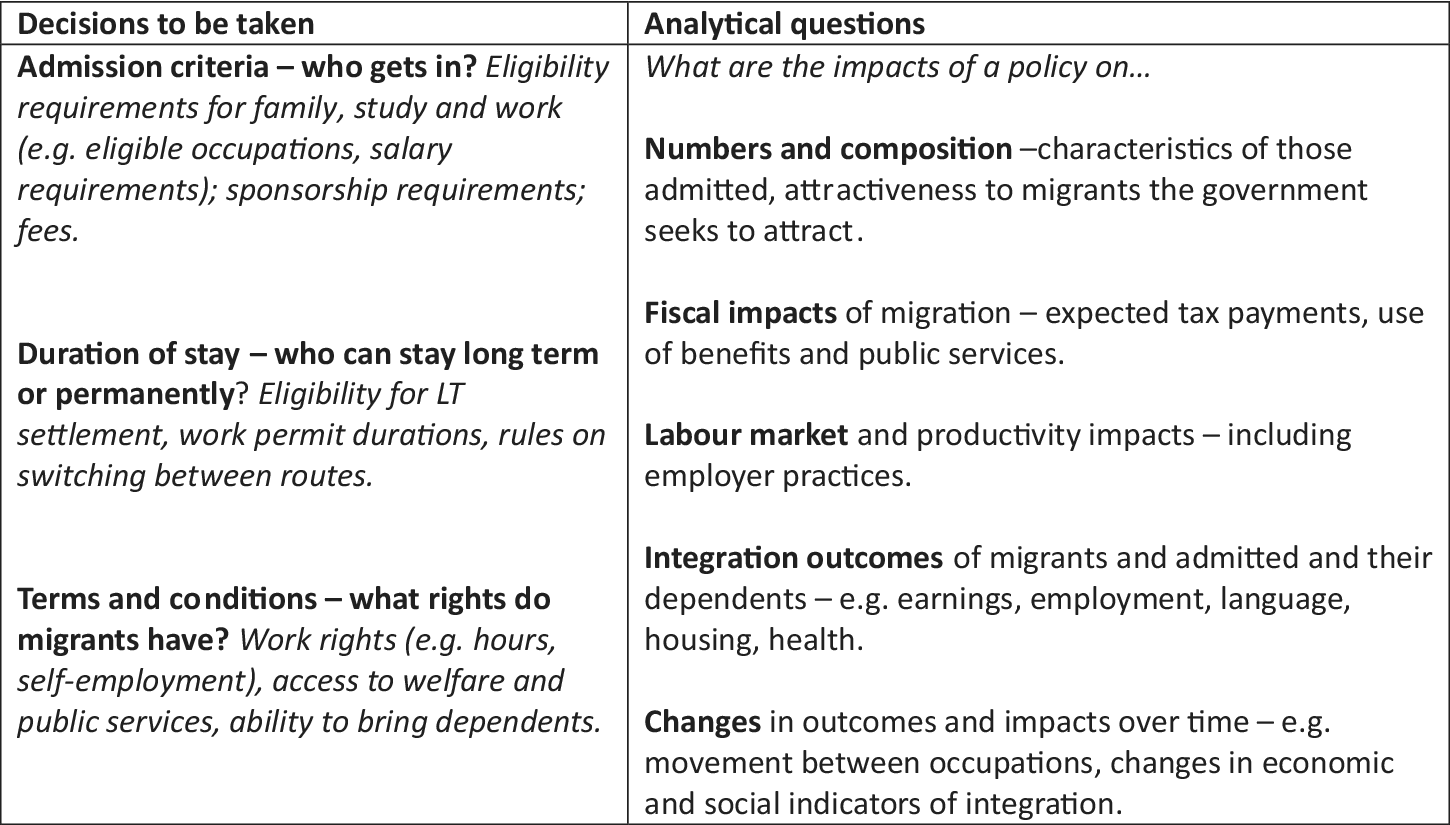
Immigration policy comprises a series of rules and regulations that govern who is admitted, for how long, and with what terms and conditions attached to their stay. Admission criteria cover a variety of reasons for moving, usually divided into four main categories: work, study, family, and asylum/refugee protection.
The analytical questions of interest to policymakers in each of these areas when evaluating existing policies or projecting the impacts of policy changes will naturally be quite different. However, some common, high-level questions are outlined in Figure 1.

Figure 1. Immigration policy decisions and analytical questions behind them.
In some cases, policymakers will want to assess the impacts of a policy that has already been implemented, potentially with a view to making further changes; in others, they will want to project the impacts of proposed policy changes. This can be methodologically complex regardless of the data source, although appropriate data are a basic minimum requirement for quantitative analysis.
3 Challenges Using Survey Data to Study Migration Policy
Population surveys have limitations for policy analysis in general, such as problems of representativeness, the policy relevance of the variables they include, and whether respondents correctly interpret what they are being asked (see, e.g., Martini and Trivallato, 1997). In addition, the changing composition of the population being surveyed can create challenges obtaining a representative sample, particularly in panel data (Duncan and Kalton, Reference Duncan and Kalton1987) but also in cross-sectional surveys that exclude or underrepresent newly arriving immigrants (Platt et al., Reference Platt, Luthra and Frere-Smith2015).
The key feature of migrant populations that makes them distinct from other subjects of policy analysis who are born in the destination country is their mobility. Migrants not only join the surveyed population at a given point in time, but may also do so temporarily or repeatedly, in the case of circular migration. Some groups of migrants may also be more mobile internally, changing addresses locally or moving to a new area as they learn more about residential and labor market opportunities. This is important from a policy perspective, since in many cases the temporariness of the migration journey is a deliberate policy choice: governments decide that certain visas (usually work or student) have limited duration, for example, because they believe that a particular group of migrants will only bring benefits in the short term and not if they are given permanent resident status (Ruhs, Reference Ruhs2015). In other cases, temporary or repeated stays will be the choice of the migrant, as it has been in the case of many mobile EU citizens (Drinkwater and Garapich, Reference Drinkwater and Garapich2015).
The following sections unpack three key problems that hinder migration policy analysis using survey data.
3.1 Understanding legal status
In liberal democracies, governments’ ability to manipulate immigration policy to achieve economic, social, or political objectives faces well-known constraints (Hollifield, Reference Hollifield1992; Joppke, Reference Joppke1998). Governments are expected to permit family unification at minimum for most partners and children, and attempts to restrict family migration can be controversial or vulnerable to legal challenges (Joppke, Reference Joppke1998). High-income countries have international obligations to offer protection to those with valid asylum claims. And even work permit policy, where one might expect governments to have substantial discretion, is limited by pragmatic considerations—most high-income countries are fairly open to high-skilled migration because of its perceived economic and fiscal benefits (Ruhs, Reference Ruhs2015).
As a result, understanding the aggregate impact of immigration in the destination country is not particularly helpful for informing policy decisions. Immigration policy is not a tap that can be turned on and off, admitting more or fewer migrants (even if politicians may discuss it in this manner, e.g., by setting targets for total immigration levels; Boswell, Reference Boswell2018). Immigration policy is instead made up of a series of decisions about specific types of migration, ranging from what conditions should be imposed on family members to be eligible for visas, to which workers should be admitted for short-term or long-term stays and whether international students should be able to stay on to work after their studies.
Governments taking decisions about migration thus need to understand the effects of policy changes at the margins, not the effects of immigration overall. Many of the best known studies on the economic impacts of migration have examined the impacts of large groups of migrants, however, such as those with similar levels of education (e.g., Borjas, Reference Borjas2003), broad nationality groups, or year of arrival (e.g., Dustmann and Frattini, Reference Dustmann and Frattini2014).
The policy implications of studies that examine the aggregate effects of migration are not always clear. For example, the common finding that the economic impacts of migration into lower-skilled work are “small” (Ruhs and Vargas-Silva, Reference Ruhs and Vargas-Silva2019; Vargas-Silva, Reference Vargas-Silva2019) could be used to argue in favor of facilitating such migration because it does not have significant negative impacts, or in favor of restricting it because the negative effects of doing so would not be large. At the same time, if policymakers conclude that restricting low-skilled migration is a good idea, it will not necessarily be clear how to do it, since much of it comes through family channels (or in some countries, refugees), over which the government has less discretionary control.
3.1.1 Migration variables in survey data
One reason that the research evidence on the impacts of migration is relatively generic is that the survey data available to researchers typically identify migrants by country of birth and nationality/citizenship, but do not contain variables that identify the policy under which a migrant was admitted, or the legal status they currently hold (e.g., the EU LFS, the UK APS, the US Current Population Survey, and the American Community Survey).
Country of birth provides no insight into a person’s legal status. Citizenship may superficially appear to do so, but in reality is rather unhelpful for policy analysis. This is because citizenship is not the main determinant of the economic and social rights a person has in the country; the type of temporary status (e.g., a work permit, family, or student visa) and whether someone is a permanent resident are much more important (Joppke, Reference Joppke2010). The key points at which immigration policies affecting migrants and the impacts of migration are mostly well before citizenship, that is, at entry, movement between status types, and transition to permanent or long-term status. (The main exception to this is the case in which citizenship alone determines legal status, as is the case for most mobile EU citizens in the European Union.Footnote 1 )
Self-reported reason for migration does provide more insight into different subcategories of migration. (This variable has been included in recent years in the EU LFS period ad hoc modules on migration, and from 2021 is a compulsory variable in the EU LFS every 2 years.) However, a person’s subjective reason for migration will not always correspond to a predictable visa category. While migrants can generally only hold one legal status, individual motivations are complex: Dubow et al. (Reference Dubow, Marchand and Siegel2019) find that intra-EU migrants typically had multiple interrelated reasons for moving, often citing up to four or five factors.
In principle, it may be possible to make assumptions about migrants’ legal status from their characteristics, and some studies have used this approach to conduct policy-focused analysis. For example, George et al. (Reference George, Meadows, Metcalf and Rolfe2011) modeled the impacts of skilled work visa holders in the United Kingdom by assuming that any non-EU citizen who arrived in the past 5 years, was working in a skilled occupation and was not a full-time student, held a skilled work visa; their narrower alternative definition also excluded people with a partner whose status could allow them to work in the United Kingdom (e.g., a UK citizen) and who might therefore have come under the family route. In a study of family migration to inform policy changes in 2011–2012, Home Office (2011) examined the economic activity and wages of people who reported that their main reason for migration was to join family.
This approach also brings challenges. First, proxies for legal status may require selecting on the dependent variable or may exclude groups with distinctive characteristics. For example, selecting work migrants on the basis of their occupation (i.e., whether they are in a job that is likely to be eligible for a work visa) may mean including highly skilled migrants from other routes (such as refugees), but not those in low-wage jobs. Selecting migrants who report family as their motivation for coming to the United Kingdom will exclude people who originally moved for another reason (such as study) before meeting a UK-resident partner and qualifying under the family visa route. In both cases, this is likely to bias any analysis of a particular group’s socio-economic outcomes.
Second, some legal routes cannot be easily modeled using observable characteristics in survey data. For example, investor and entrepreneur visas do not have any occupational restrictions, and their eligibility criteria (e.g., making specified investments or running a company that meets particular criteria) will be hard to identify in survey data.
Third, the characteristics that determine eligibility for visas will change over time, but cross-sectional surveys identify current characteristics rather than the situation at arrival. If we assume that someone is eligible for a given visa based on their current characteristics (e.g., whether someone holds an eligible job or is with an eligible partner), this will exclude people who were initially eligible but would no longer qualify at the time they are surveyed. Similarly, some people will be included, because they qualify for a given visa now even if they would not have done initially (e.g., due to upward mobility). Using current characteristics as a proxy for original visa status becomes increasingly problematic the more time passes since arrival, especially once a person moves to permanent status that no longer imposes any conditions on their stay. This is unfortunate, given that the long-term outcomes of migrants admitted through different routes are of great policy relevance and will determine much of the migrant’s overall economic impact.
MAC (2020) analyzed recently arrived non-EU citizens by reason for migration, examining their characteristics to identify immigration routes for which they are likely to have been eligible. Using data from the APS for 2016–2018, it found that for 28% of non-European Economic Area (non-EEA) citizens there was no clear route to eligibility, even though they must have been eligible for a visa of some kind (assuming that irregular migration at this level is not plausible). Thirty-six percent of people who said that they came for employment were not found to be eligible for any particular visa category, as well as 29% who said that they came as the family member of a settled person and 33% of those who said that they came as dependents of someone with permanent status in the United Kingdom.
There are several possible reasons for this, including measurement error, the difficulty in modeling certain routes (e.g., investor visa holders), and a quirk of the UK’s population survey, which does not accurately capture dual citizenship, meaning that some of the “non-EEA citizens” not found to be eligible for visas may in fact have held EU citizenship too. Nonetheless, the significant share of recent migrants with no obvious visa route underlines the difficulty in assuming that self-reported motivation for migration aligns well with visa status.
Similarly, OECD (2014) compared self-reported reason for migration in the EU LFS with standardized permit data for people moving between 2005 and 2008. The broad picture provided by administrative and survey data sources was similar in most countries. For example, the share of migrants who came for work, as calculated from the two data sources, was generally within about 10% points. However, there were also large discrepancies in several cases. Compared with the permits data, the LFS suggested a much higher share of people coming for employment in Austria and Ireland, and a significantly lower share of humanitarian migrants in Germany and Sweden. Self-reported reason for migration may thus provide a useful, broad-brush picture of different categories of migrant, but that caution is required when trying to get a fine-grained understanding of the impacts of small policy changes.
3.2 Representativeness
Survey data face well-known challenges obtaining representative samples, primarily due to nonresponse. Response rates to household surveys across the world have been declining for the past few decades, generating concerns about the bias that is likely to result [see Singer, Reference Singer2006 for a review]. In the United Kingdom, for example, the response rate to the first wave of the five-wave LFS was 53.8% in the last quarter of 2019, and this fell sharply to just 31.2% in the second quarter of 2020 due to the Covid-19 crisis (ONS, 2020a).Footnote 2
A wide range of different socio-demographic groups are at risk of being underrepresented in survey data, whether because they are less likely to be found at home (e.g., young people and students) or are less willing to participate (e.g., some marginalized individuals; e.g., Groves and Couper, Reference Groves and Couper2012; Goyder, Reference Goyder2019).
Research in several countries has identified higher rates of nonresponse among migrants in particular. For example, Deding et al. (Reference Deding, Fridberg and Jakobsen2008) examine data from Denmark and find widely varying response rates by country origin: 40% for Pakistanis, 55% for Turks, and 60% for Iranians, compared with 80% for Danes; this was largely due to either the inability to contact the sampled respondent (particularly in the case of Pakistanis) or refusal to cooperate (particularly for Turks). A similar study for the Netherlands finds lower response rates among first and second generation migrants, which is explained by their socio-economic status and particularly their concentration in urban settings (Feskens et al., Reference Feskens, Hox, Lensvelt-Mulders and Schmeets2007)—although other studies have shown independent effects of migrant status not explained by social class (e.g., Laganà et al., Reference Laganà, Elcheroth, Penic, Kleiner and Fasel2013; Lipps et al., Reference Lipps, Laganà, Pollien, Gianettoni, Font and Mendez2018). In the United Kingdom, a study of nonresponse using a comparison between the LFS and the 2011 Census found that foreign country of birth was associated with higher nonresponse in the LFS (Weeks et al., Reference Weeks, Fallows, Broad, Merad and Ashworthn.d.).
One key reason for higher nonresponse among migrants is likely to be language barriers. In the Danish study of nonresponse by Deding et al. (Reference Deding, Fridberg and Jakobsen2008), substantial minorities of the three migrant groups targeted took up the option to be interviewed in their native language, and this was particularly common among women (43% of Turkish women, 38% of Pakistani women, and 24% of Iranian women). Official surveys often do not provide translated questionnaires or interpretation, due to the cost (Feskens et al., Reference Feskens, Hox, Lensvelt-Mulders and Schmeets2006). Language barriers may compound other factors affecting nonresponse among migrants, such as lack of familiarity with the surveying organization (ibid). Even where there have been relatively extensive attempts to support nonlanguage speakers’ participation, however, as in the survey conducted by Deding et al. (Reference Deding, Fridberg and Jakobsen2008) and the UK’s LFS (Weeks et al., n.d.), nonresponse among migrants is still higher (see also Laganà et al. Reference Laganà, Elcheroth, Penic, Kleiner and Fasel2013).
In panel surveys, noncontact for second and subsequent waves of data collection is also likely to be affected by further migration. Migrants may drop out of the sample because of either internal mobility (moving to another address within the country) or emigration, and it will usually not be possible to tell between these two scenarios.
Several of the factors that are associated with higher rates of nonresponse are particularly prevalent among new arrivals, who tend to be younger, less likely to have dependent children, and less likely to speak the destination country language well compared with migrants with several years’ residence, and who may have lower trust in local institutions. One would therefore expect higher rates of nonresponse among new arrivals, with response rates rising over time.
Figure 2 shows the size of foreign-born cohorts measured in the UK’s APS in the first few years after their arrival. The size of each cohort is expected to decrease over time because of emigration. However, that expected pattern does not emerge. For example, the APS suggests that in 2012, there were 338,000 foreign-born people who had arrived in 2011. Another 3 years later, by 2015, the estimated size of this cohort remained essentially unchanged, at 350,000. This is despite the fact that a separate survey, the International Passenger Survey, estimates that from 2012 to 2014, 104,000 of the 2011 cohort emigrated long term from the United Kingdom (ONS, 2018a). Similar results are found for other arrival cohorts: the lines in Figure 2 are more or less flat for the first 3 years after the arrival year.

Figure 2. Foreign-born population by year of arrival. Source: Annual Population Survey, 2012–2019.
ONS (2019) notes that the unexpectedly constant (or even rising) size of migrant cohorts is driven by the EU born, with non-EU-born migrants showing declining cohort sizes over time.Footnote 3 Even among non-EU migrants, however, the declines are not very large.
Figure 3 compares the number of people who arrived in 2012 as measured by the APS with the number of people who were given an entry visa for work, study, or family reasons in 2012 and still had a valid status (temporary or permanent) in subsequent years. The figures are only available for non-EU migrants, because EU citizens do not require visas to live in the United Kingdom. The population and visa data are not directly comparable as the visa data only include people who came to the United Kingdom on a work, study, or family visa, and thus exclude others such as asylum seekers; they will not include visa overstayers; and they will include some people with valid visas who have left the United Kingdom. It is also likely that migrants vary in their interpretation of the APS question on their year of first arrival.
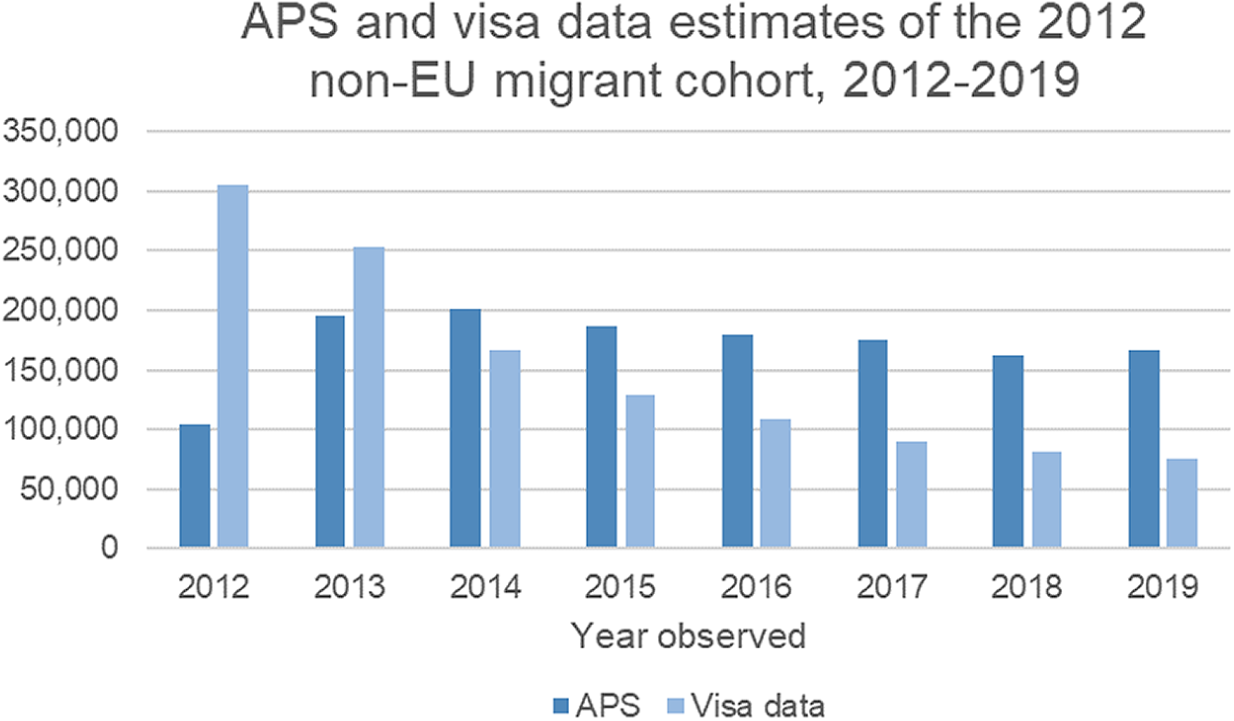
Figure 3. APS and visa data estimates of the 2012 non-EU migrant cohort, 2012–2019. Source: Home Office, Migrant Journey dataset; and ONS (2020b). Note: APS data are for country of birth, whereas Migrant Journey data are for nationality. APS data were collected throughout the year (data for 2012 are low because of migrants arriving after the data collection period); Migrant Journey data were taken on December 31 of each year. Country of birth is used in the APS data as this does not change over time; citizenship figures would understate the number of migrants still in the country after 5–6 years, due to naturalizations.
Nonetheless, two observations emerge. First, the steepest decline in the number of people holding valid visas takes place in the period of 0–2 years after arrival. Second, the decline in the number of visa holders is much steeper in the visa data than in the APS-based estimate of the non-EU-born population.Footnote 4
These trends strongly suggest that the APS is not fully capturing recently arrived migrants. The data in Figure 2, in particular, are consistent with the hypothesis that nonresponse is higher among recent arrivals and declines during the first years after arrival. This could be because over the first few years migrants learn more English (Deding et al., Reference Deding, Fridberg and Jakobsen2008; e.g., found that language problems increased nonresponse even though interpreters were available); move to more stable accommodation (including out of communal accommodation that is not part of the survey sampling frame); are more likely to have children (improving response rates because there is more likely to be someone at home); or become more trusting of UK institutions and thus more willing to participate. ONS (2019) also suggests that the complex patterns of circular migration among EU migrants, in particular, with many making repeated trips, could make it harder for them to specify year of arrival.
This poses a particular challenge for policy analysis, where there is often specific interest in either: (a) the characteristics of recently arrived migrants who are most likely to be subject to immigration policy (other migrants typically having long-term residence rights with few conditions attached, or citizenship) and (b) migrants’ integration trajectories, for example, the improvement in socio-economic outcomes over time since arrival.
In theory, researchers should be able to use population surveys to examine cohorts of migrants over time, either to evaluate changes in integration outcomes (e.g., Borjas, Reference Borjas1985; Frattini, Reference Frattini2017). The first 1–2 years after arrival is expected to be the period in which migrants make the greatest gains along dimensions, such as earnings or occupational status, as they improve their language proficiency and gain country-specific knowledge (Platt et al., Reference Platt, Luthra and Frere-Smith2015). However, this approach is undermined if the composition of the cohort is changing due to falling nonresponse as people spend longer in the country. This makes it difficult to use population surveys to identify how much upward mobility migrants experience over time, something that is in principle quite important for immigration policymakers, who must consider not just the immediate short-term characteristics of people admitted, but also how this will change over time. It also complicates attempts to study emigration by identifying what share of the cohort remains in the country [see the approach taken in Dustmann and Weiss, Reference Dustmann and Weiss2007].
Finally, survey data are weighted to produce representative estimates of the population, and weights will often also be calibrated to official estimates of the population. In the United Kingdom, for example, weights in the LFS are adjusted based on ONS estimates of the population by age, sex, and geographical location (region and local authority)—estimates that are based on Census, other surveys, and administrative records (see ONS, 2018b). Assessing the impact of this process on the representativeness of data on migrants is not straightforward, although it is possible that it could inadvertently amplify some of the problems identified in this section. For example, if administrative or Census data underrepresented people in a particular location or age group because those data sources also had incomplete coverage of migrants, this would also affect the weights assigned to migrant groups.
3.3 Cross-sectional snapshots of mobile populations
The fact that migrants are more mobile than the rest of the population creates some particular challenges for policy analysis using survey data. Survey data provide a snapshot of the population that is present in the country and captured by the data collection at a given point in time. It is less well adapted to the purpose of understanding populations of people who move in and of the country, sometimes repeatedly.
First, many visas issued for work and residence are short term, issued to people who will stay only a few months or years. This includes seasonal workers, short-term workers including intracompany transferees or freelancers in the creative industries, and many students or working holidaymakers. These people will often be excluded from the sampling frame because they do not live at private addresses (e.g., employer-provided group accommodation or hostels), or undercounted because they have recently arrived and are less likely to respond (as discussed above).
As noted earlier, visa data in the United Kingdom show substantially higher numbers of non-EU citizens holding valid visas during the first and second calendar years in which they were granted permission to enter the United Kingdom, compared with the number of non-EU-born people who said that they entered in the same year, according to the APS. At the end of 2012, an estimated 305,000 non-EU citizens entering on work, family or study visas in that year still had valid leave to remain in the United Kingdom, and by the end of 2013 this had declined to 253,000 (Figure 3, above). The APS estimate of resident non-EU-born migrants in 2013—the first year in which year of arrival for the 2012 cohort can be captured given that data collection is spread across the year—was only 172,000.Footnote 5
This initial sharp decline in the number of visa holders is driven by study and work visa holders, who are numerous but often come for short stays, while most family migrants still hold valid permission to remain 6 years later (Figure 4). The number of international students with valid leave to remain fell by over 80,000 by the end of the second year after arrival (i.e., 2014), and the number of work visa holders by over 50,000.

Figure 4. Non-EU citizens granted entry visas in 2012 still holding valid leave to remain, at the end of calendar year. Source: Migrant Journey dataset.
The facts that the largest numbers of entry visas are issued for study and work and that these are the groups that diminish fastest in the first 2 years suggest that they are particularly likely to be underrepresented in the APS. In the case of international students, this happens by design: the APS does not cover people living in communal establishments, and international students living in halls of residence will not be sampled unless they have a parent living at a private address in the United Kingdom.
This would have potentially important implications for policy-focused analysis, such as on the economic impacts of visa policies. For example, studies on fiscal impacts of migration in the United Kingdom have consistently found that recently arriving migrants are greater fiscal net contributors than longer-standing ones (Vargas-Silva, Reference Vargas-Silva2019), for various reasons including that they tend to put quite low demands on public services and are often ineligible for welfare benefits. They have also found that students impose low fiscal costs (Migration Advisory Committee, 2018), and that non-EU migrants who say they moved for work have characteristics associated with more positive fiscal impact, notably higher salaries and employment rates (Cooper et al., Reference Cooper, Campbell, Patel and Simmons2014). Analysis based on data that does not capture recent work and study migrants will thus miss some high fiscal contributors.
A second consequence of the fact that migrants are a mobile population is that their precise year of arrival may be difficult to define. Official surveys ask migrants when they arrived, using language such as “When did this person first come to live in the United States?” (American Community Survey) or “In which year did you first arrive in the United Kingdom?” (UK LFS and APS). This suits a model of one-stage, permanent migration but will be more difficult for respondents who have moved several times, perhaps before settling permanently. In these cases, it may not be clear to the individual at which point they were finally “coming to live” and interpretations may differ.Footnote 6 This is troublesome from a policy perspective, because the year of arrival is quite important for analyzing who was admitted under a particular policy or attempting to identify the impacts of policy changes.
Similarly, certain questions that can be easily asked of nonmobile populations are more complicated for people who have spent large periods of their life abroad. In particular, qualifications obtained abroad may be poorly measured in survey data if respondents are not sure how their qualifications are compared to the local equivalent.
Finally, attempts to use survey data to understand the numbers of people who hold or are eligible for a given legal status face the challenge that the target population may move in and out of the country. This makes it difficult to assess program participation (e.g., regularizations), because the applications the government receives will include people who are currently in the country but also those who have emigrated or are temporarily absent. This is discussed further in Section 4.
4 Case Study: The EU Settlement Scheme in the United Kingdom
One of the major policy questions facing immigration policymakers in the United Kingdom in the aftermath of the 2016 EU referendum has been the status of EU citizens already living in the country. Under the UK government’s plans to end free movement, EU citizens need to obtain a new legal status in order to maintain their right to live and work in the country. The stakes are high: those who do not apply and receive the new status under the “EU Settlement Scheme” (EUSS) are set to become irregular migrants (the government has said that there will be concessions for people who do not apply where there is a “good reason” but has not given further detail on how generous these provisions will be).
Because there is no population register or record of which EU citizens have settled in the United Kingdom, applicants must come forward of their own accord. The key source of information on how many people might be eligible is, therefore, the official population estimates by nationality, based on the APS.Footnote 7 The estimated number of EU citizens living in the United Kingdom according to this source is approximately 3.4 million (excluding Irish citizens who do not need to apply to EUSS), and this number has been cited by politicians as an approximate target for the number of people to be registered (House of Commons, 2018).
One of the most important statistical problems the government faces in this area is how inclusive take-up of EUSS has been—how many people are yet to apply, and whether certain groups of eligible people are more likely to have come forward than others. At first glance, this should simply require an estimate of the number of EU citizens eligible for the scheme and information about how many have applied. Both of these are available from survey and administrative data, respectively.
However, survey data that simply indicate a person’s citizenship, with no information about the type of status held, cannot provide a baseline against which to measure take-up of the scheme.
First, we cannot assume that the APS is fully representative of the EU citizen population, for the reasons discussed above.
Second, because survey data provide a snapshot of the population living in the country at a given point in time, they will not include eligible people who are temporarily or permanently outside the country, such as part-year residents and people who applied but subsequently emigrated.
In 2019, for example, an estimated 148,000 EU citizens emigrated from the United Kingdom having lived there for at least 12 months (ONS, 2020d). There were additional 393,000 short-term visits (of 1–12 months) from EU citizens in the year ending June 2018. Given that there is no minimum residence duration for applying to EUSS, any of these short-term or long-term migrants would in principle have been eligible to apply. If they did so, they will be included in administrative data but not in survey data.
The result is that we cannot compare administrative data on applications with survey data on the size or characteristics of the population. The hazards of doing this become clear when attempting to calculate “take-up” of the scheme by nationality from these two datasets. By the end of September 2020, the 4 million applications from EU citizens were already well above the total estimated population of 3.4 million EU citizens (in both cases excluding Irish citizens who do not have to apply) (Home Office, 2020). For some countries of origin, the number of applications has been even further above 100%, with a particularly high share (153%) among Bulgarians as of June 2020 (Figure 5).

Figure 5. EUSS applications as a share of officially estimated population
Source: Home Office EU Settlement Scheme Statistics to end June 2020 and ONS Population by Country of Birth and Nationality (year ending December 2019)
There are various possible reasons for the fact that applications outnumber the estimated EU citizen population, including the factors outlined in Table 1. Underestimates of the resident EU citizen population in survey data are likely to play at least some role, combined with the mobility of the EU citizen population in and out of the United Kingdom.
Table 1. Key differences that prevent comparison between UK administrative and survey data for EU citizens
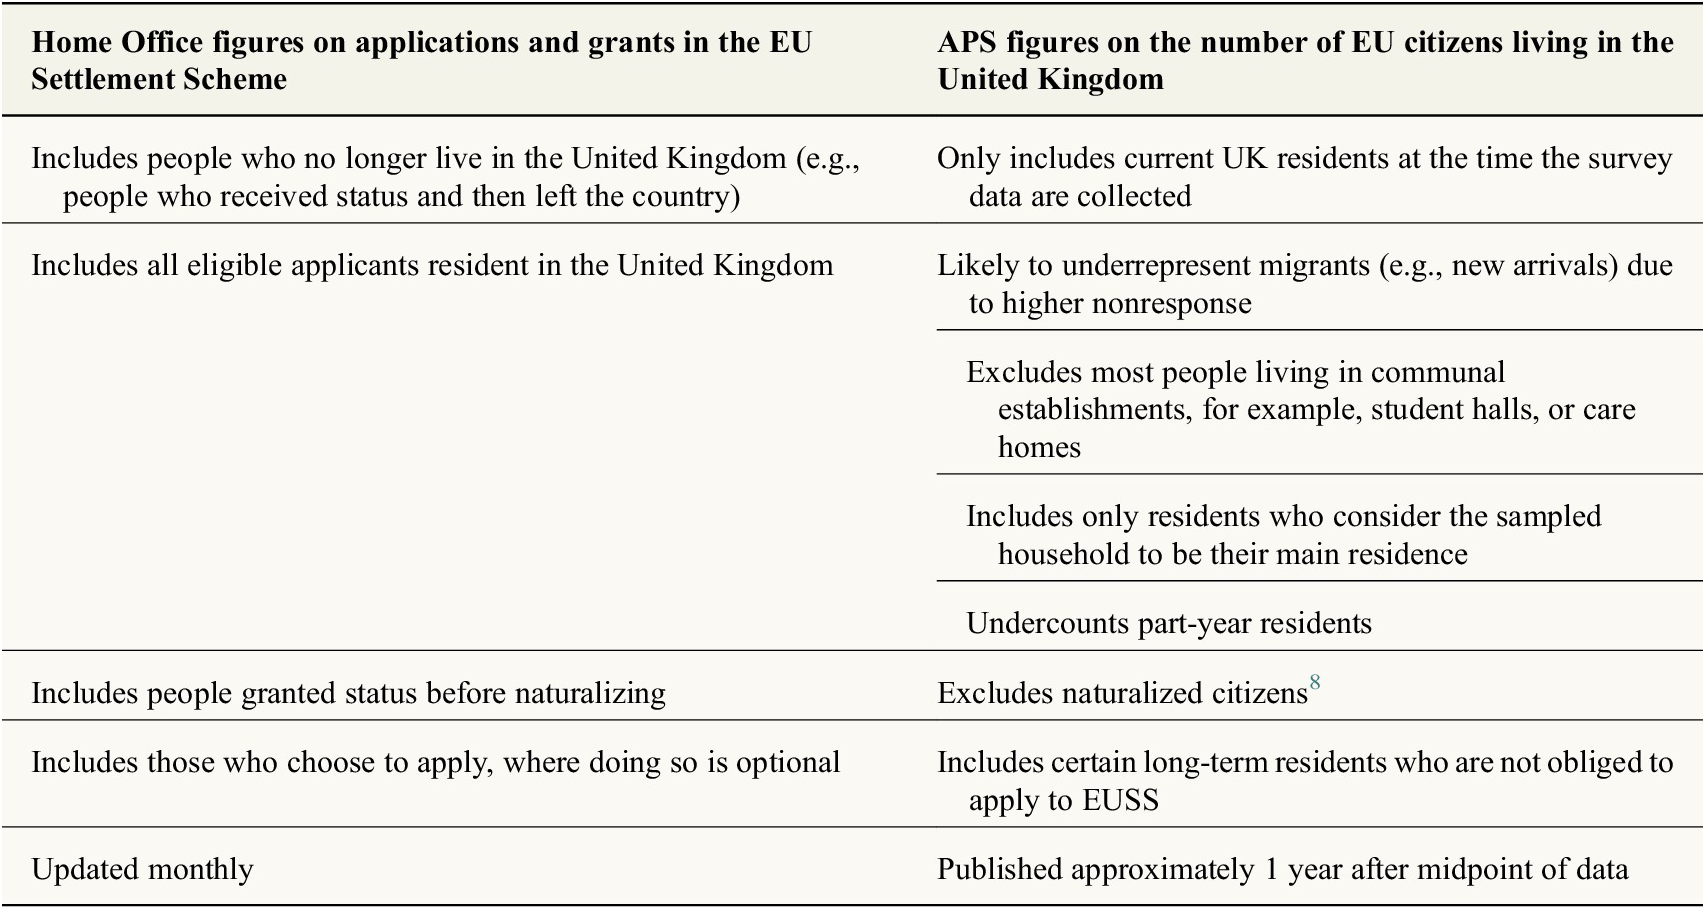
Source: Sumption (Reference Sumption2020).
The figures also raise the question whether it is even possible to draw comparisons of take-up rates across countries—that is, whether we can be sure that the take-up rate for Bulgarians is in fact higher than for Portuguese, for example. It is possible that short-term migrants from Bulgaria are more likely to have applied to EUSS before leaving the country, and/or that population figures underestimate the total number of Bulgarians (e.g., because they are more likely to have arrived in the United Kingdom recently or more likely to live at nonprivate addresses—recall from Section 3.2 that recently arrived EU citizens appear to be underrepresented in the survey data).
While in principle it would be valuable for policymakers to learn lessons from data on different take-up rates of the scheme (e.g., to identify whether there are specific groups that are not being reached through current communications channels, or lessons to be learned from groups that have been particularly likely to come forward), conclusions drawn from the comparison of data sources must be treated with great caution.
Similarly, there are several groups of EU citizens who might be considered vulnerable in some way, creating a particular rationale for understanding to what extent they have been able to take up the scheme (Sumption and Kone, Reference Sumption and Kone2018). The size of some of these groups can be estimated using survey data, subject to all the usual concerns about underrepresentation of vulnerable groups in the data—as shown in Table 2. However, without any indication of legal status in the data, it is not known to what extent concerns that they may fail to come forward or complete an EUSS application have been realized.
Table 2. LFS-based estimates of selected EU citizen subgroups, 2017
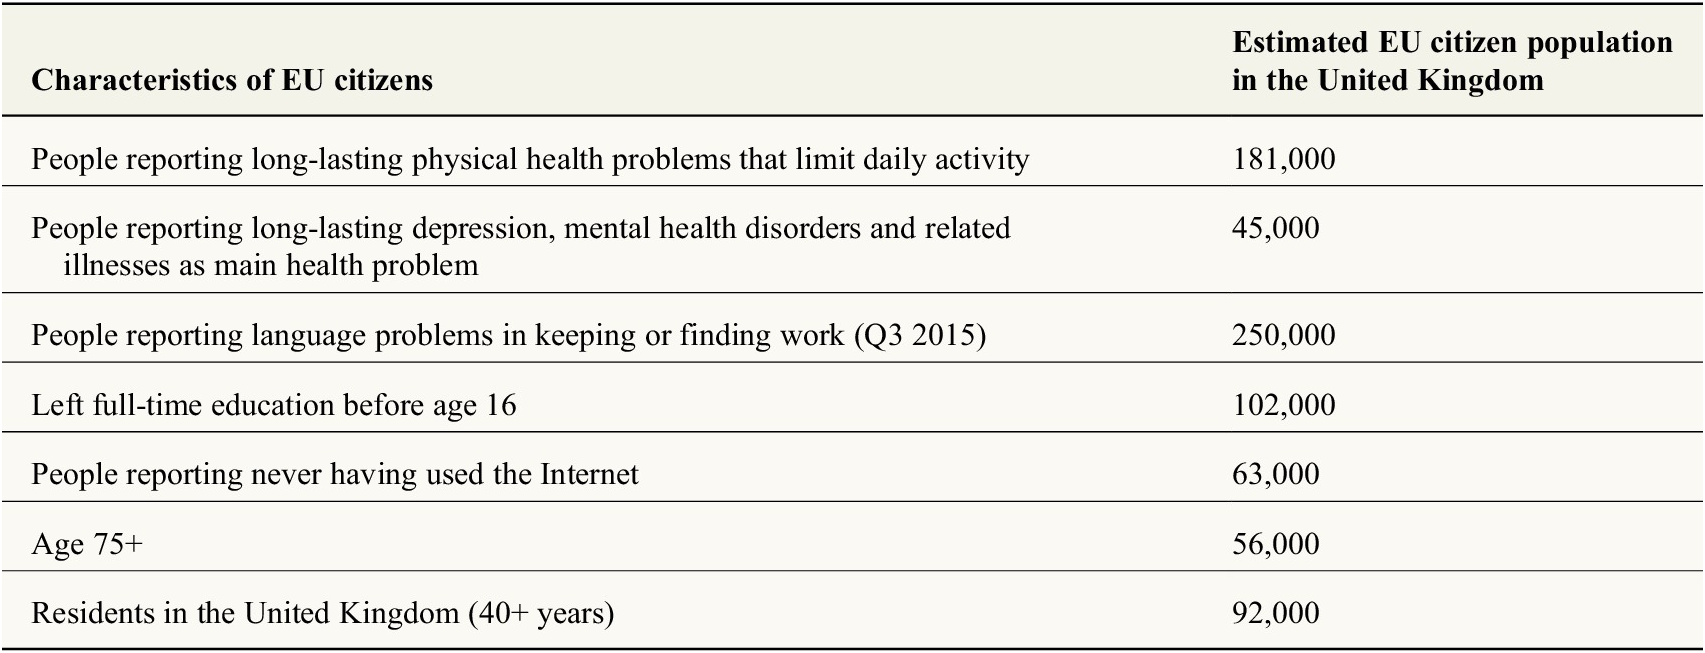
Source: Sumption and Kone (Reference Sumption and Kone2018).
Note: Weighted average of four quarters. Excludes Irish citizens.
In other words, the lack of any variable indicating the legal status of the individual significantly limits analysis that has the potential to inform policy. In order to understand the take-up or inclusiveness of the scheme, it would be necessary to directly measure the number of people who have not secured status, rather than just infer it from a comparison of application rates and survey-based population estimates.Footnote 9 This could be done either by using administrative data (e.g., linked immigration and other administrative records such as tax data) or by adding survey questions, as discussed below.
5 Conclusions
The combined problems of representativeness (including difficulty in surveying recent arrivals), mobile populations, and limited information on migrants’ legal status limit the usefulness of survey data for analyzing immigration policy.
What could be done to resolve this situation? In the short run, policymakers will need to be aware of the limitations of survey data, interpreting the findings cautiously. In particular, they should bear in mind that the characteristics of migrants coming for different reasons can vary dramatically, and so we cannot be sure that aggregate evidence about migrants or migration will be relevant to the specific routes on which they are taking decisions. Similarly, some groups are underrepresented in survey data, and this will create bias in estimates of economic impacts or integration outcomes. While policymakers will reasonably assume that vulnerable, low-income populations are among those most likely not to respond to surveys, they may be less aware that the issue is also likely to affect migrants with higher socio-economic status such as international students and short-term work visa holders.
In the medium run, it would in theory be possible to improve the understanding of legal status (but not address problems of representativeness or mobile populations), by adding survey questions on immigration status at arrival or current immigration status. Canada, for example, asks LFS respondents whether they have permanent residence rights, and Australia asks a series of detailed questions once every 3 years people’s visa history.Footnote 10 This relies on accurate recall, and it is possible that some people will not understand their own immigration status, especially if they hold an unusual status. For example, early testing of EUSS in the United Kingdom revealed that several thousand applicants to the scheme mistakenly believed they held a permanent residence card (Home Office, 2019). The risk of respondent error would need to be balanced against the benefits of having a more policy-relevant variable than alternatives such as subjective reason for migration.
Asking about immigration status also requires respondents to trust survey providers with this information. While official surveys often ask respondents about highly sensitive information, ranging from sexual orientation to experiences of domestic abuse, it is worth noting that collecting immigration-related data has in some instances been controversial.Footnote 11 It is thus possible that there might be additional nonresponse and related sample selection problems for specific questions about immigration status.
In the long run, greater reliance on administrative data sources may be required to address to the problems outlined in this article more fully, at least for migrants who are subject to immigration control. Specifically, this would involve linking immigration records to survey, Census, or other administrative data sources (such as tax records). Population register data with immigration information have been productively used to identify variation in migrant outcomes depending on the initial admission category, as in Sweden (Luik et al., Reference Luik, Emilsson and Bevelander2018). The Australian Census and Migrants Integrated Dataset links immigration records with Census data (produced every 5 years in Australia), allowing detailed analysis of migrants’ characteristics by initial entry visa category (see, e.g., Temple and McDonald, Reference Temple and McDonald2018). Canada’s Longitudinal Immigration Database, which provides detailed immigration and activity information for the tax-filing population, has been productively used to evaluate specific immigration routes; for example, a 2014 evaluation found surprisingly poor long-term economic outcomes among people admitted to Canada as investors (CIC, 2014), providing evidence to support changes to this program.
At least in theory, linking immigration records to other sources in this way has the potential to address problems associated with nonresponse, to understand more about migrants in the very early period after arrival (including for those who never stay long term), and to accurately represent legal status—including for small groups of people holding nonmainstream statuses, such as entrepreneur visas for which sample sizes would be quite small even if survey data provided information about legal status.
This approach also has risks (for an overview of the advantages and disadvantages of developing linked survey and administrative data, see Künn, Reference Künn2015). One important risk is that access to administrative data sources is often restricted (Künn, Reference Künn2015). Since most research is produced outside of government, if mainstream data sources on migration are in future to include administrative records, making sure that independent research can continue at the same scale as it has done in the past will be a challenge.
Acknowledgements
This article uses data from the Annual Population Survey produced by the Office for National Statistics and supplied by the UK Data Service.
Funding Statement
This article draws on work funded by Oxford University’s John Fell Fund.
Competing Interests
The author declares no competing interests exist.
Data Availability Statement
The data used in this article are freely available from the following sources:
-
- UK Data Service (Annual Population Survey): https://beta.ukdataservice.ac.uk/datacatalogue/series/series?id=200002#!/access-data
-
- Gov.uk website (Home Office Migrant Journey data): https://data.gov.uk/dataset/10b81faf-44e1-4dd0-bfa9-83c7e2ebd079/the-migrant-journey
Author Contributions
Conceptualization, M.S.; Methodology, M.S.; Writing-original draft, M.S.; Writing-review & editing, M.S.


 Open access
Comments
No Comments have been published for this article.