


Background
In cultures where alcohol use is well entrenched, it is the most commonly used mood-altering substance by older adults (Heather, Reference Heather, Heather, Peters and Sockwell2001; Moore et al., Reference Moore, Karno, Grella, Lin, Warda, Liao and Hu2009). Although more than 70 per cent of older persons naturally desist (without formal assistance) from alcohol use, either through reduced drinking or total abstinence (Schutte, Moos, & Brennan, Reference Schutte, Moos and Brennan2006), for some, alcohol-related problems may remain (Moos, Schutte, Brennan, & Moos, Reference Moos, Brennan, Schutte and Moos2010). Therefore, formal interventions are important to aid detection (Schutte et al., Reference Schutte, Moos and Brennan2006) and prevent the deleterious effects of alcohol from developing in later life. Some people are more likely than others to experience adverse consequences attributable to alcohol (Vaillant, Reference Vaillant1995), and this study examined what factors may contribute to such a tendency.
In accord with contemporary public health interest in detecting and mitigating unhealthy alcohol-related behaviour in older persons (Anderson, Scafato, & Galluzzo, Reference Anderson, Scafato and Galluzzo2012; Merrick et al., Reference Merrick, Horgan, Hodgkin, Garnick, Houghton, Panas and Blow2008), research has indicated a range of personal and environmental factors that may influence alcohol-related harm. Principal among these are (a) health and health behaviour; (b) psychoactive medication and alcohol; (c) psychosocial circumstances; and (d) quality of life (QoL). Recognising differences between women and men in drinking behaviour and outcomes in various cultures where alcohol is used (French, Sargent-Cox, Kim, & Anstey, Reference French, Sargent-Cox, Kim and Anstey2014; Homila & Raitasalo, Reference Homila and Raitasalo2005; Lemke, Schutte, Brennan, & Moss, Reference Lemke, Schutte, Brennan and Moss2008), we note that within each of these aforementioned categories it is important also to note research findings by gender.
Unless otherwise specified, the large majority of studies cited below, which were typically conducted on the general population in the retirement phase of life, share very common sample characteristics. These studies used longitudinal data collections, with reporting on follow-up periods of between 4 and 20 years. Studies were largely of populations of older people residing in the United States, with ages at intake ranging between 55 and 65 years. Sample sizes were typically moderate to large, ranging from 518 to 5,446 participants.
Health and Health Behaviour
In this category, studies of drinking trajectories found that deteriorating health, increases of depressive symptoms, and increased use of prescription psychoactive medication (among others) predicted a slight decline in alcohol use and a decline in the prevalence of drinking problems (Bobo, Greek, Klepninger, & Herting, Reference Bobo, Greek, Klepninger and Herting2013; Moos, Brennan, Schutte, & Moos, Reference Moos, Brennan, Schutte and Moos2010). On the other hand, increased alcohol consumption and drinking problems were identified among those who relied on alcohol to cope with poor health and/or relied on alcohol to relieve increased levels of pain, anxiety, and depression (Brennan & SooHoo, Reference Brennan and SooHoo2013; Moos, Brennan, et al., Reference Moos, Brennan, Schutte and Moos2010). Immonen, Valvanne, and Pitkälä (Reference Immonen, Valvanne and Pitkälä2011) reported similar findings based on cross-sectional data collected from a sample of 831 Finnish adults aged 65 years and older. With regard to gender, the two major general population-based cross-sectional findings based on Canadian (Graham et al., Reference Graham, Clarke, Bois, Carver, Dolinki, Smythe and Brett1996) and United States (Lemke et al., Reference Lemke, Schutte, Brennan and Moss2008) samples of 826 people aged 65 and older, and 831 adults aged 62–78 years respectively, found that women were more likely than men to rely on alcohol to self-medicate depression or related distress. In research by Brennan, Schutte, SooHoo, and Moos (Reference Brennan, Schutte, Moos and Moos2011), having painful medical conditions was positively associated with drinking problems in men but not in women.
Several long-term (Borok et al., Reference Borok, Galier, Dinolfo, Welgreen, Hoffing, Davis and Moore2013; Moos, Brennan, et al., Reference Moos, Brennan, Schutte and Moos2010) and qualitative studies (Edgar et al., Reference Edgar, Nicholson, Duffy, Seaman, Bell and Gilhooly2016; Haarni & Hautamäki, Reference Haarni and Hautamäki2010) investigated reasons for desistance from the use of alcohol in, respectively, United States and European (i.e., United Kingdom and Finland) samples of people aged 55 and older. The studies found that triggers prompting reduced drinking or abstinence, in addition to health problems, were decreased tolerance for alcohol, doctor recommendations, concerns of a spouse/close family members, cognitive problems, fewer social occasions to drink, and negative feelings. With regard to gender, Satre and Areán (Reference Satre and Areán2005) in a study of 211 medical patients aged 55 to 91 living in the United States, reported that women appeared to be more vulnerable to and more concerned about the negative effects of alcohol, perhaps partly reflected in the studies, which reported that desistance from drinking occurred more frequently in women than in men (Graham et al., Reference Graham, Clarke, Bois, Carver, Dolinki, Smythe and Brett1996; Schutte et al., Reference Schutte, Moos and Brennan2006). In contrast to women, men tended to reduce drinking in reaction to depression (Bobo et al., Reference Bobo, Greek, Klepninger and Herting2013; Schutte, Moos, & Brennan, Reference Schutte, Moos and Brennan1995).
In terms of drinking pattern only, heavy or unhealthy drinking (defined as ≥ 7 drinks per week or ≥ 3 drinks per day) was found by Immonen et al. (Reference Immonen, Valvanne and Pitkälä2011) and in a large cross-sectional U.S. population study (n = 12,413; age 65+) (Merrick et al., Reference Merrick, Horgan, Hodgkin, Garnick, Houghton, Panas and Blow2008) among those who reported good subjective health and functional status irrespective of gender. Notably, good health and reliance on alcohol to cope with all kinds of adversity, including medical pain relief, were factors observed to be associated with maintenance of poor drinking habits (Borok et al., Reference Borok, Galier, Dinolfo, Welgreen, Hoffing, Davis and Moore2013; Moos, Schutte, et al., Reference Moos, Schutte, Brennan and Moos2010).
Psychoactive Medication with Alcohol Use
Because of its chemical properties, alcohol may potentiate the effects of many prescription drugs and, in particular, psychoactive medication used more frequently by adults aged 65 and older than by any other age group (Center for Substance Abuse Treatment, 1998). For example, Aira, Hartikainen, and Sulkava (Reference Aira, Hartikainen and Sulkava2005) in a Finnish study (n =523) showed that almost 90 per cent of adults over age 75 who consumed alcohol also used psychoactive medication. Similar to results obtained from the U.S. sample (Moos, Schutte, Brennan, & Moos, Reference Moos, Schutte, Brennan and Moos2004), a Norwegian cross-sectional population survey (Bye & Rossow, Reference Bye and Rossow2017) of people aged 60–79 (n = 1,920) found that women were more likely than men to mix alcohol with both anti-depressant and sedative/hypnotic use.
Psychosocial Circumstances
Researchers have reported that living alone, social isolation, low satisfaction with relationships, and having few social resources have been variably associated with problematic drinking behaviour in older adults. The studies include an extensive review of European alcohol research (Anderson et al., Reference Anderson, Scafato and Galluzzo2012), a research review of risk factors for late-onset of alcohol problems (Emiliussen, Nielsen, & Andersen, Reference Emiliussen, Nielsen and Andersen2017), a prospective study on predictors of alcohol use and drinking problems (Brennan & Moss, Reference Brennan and Moss1996), and the U.S. population survey (Bryant & Kim, Reference Bryant and Kim2013) of persons aged 60 and older (n = 13,265). In Immonen et al. (Reference Immonen, Valvanne and Pitkälä2011), loneliness was one of the most potent factors reported to precipitate alcohol-related problems, and the loss of one’s spouse through death was positively associated with unhealthy drinking and the development of drinking problems for men but not women (Center for Substance Abuse Treatment, 1998; Merrick et al., Reference Merrick, Horgan, Hodgkin, Garnick, Houghton, Panas and Blow2008). According to Lemke et al. (Reference Lemke, Schutte, Brennan and Moss2008), women were more likely than men to use alcohol to cope with stressors and to use alcohol in response to marital problems.
Quality of Life (QoL)
Thus far, only one Norwegian study (Mathiesen, Nome, & Eisemann, Reference Mathiesen, Nome and Eisemann2012) using a mixed-age community sample (n = 4,000) has directly focused on the relationship between physical health; psychological, social, and environmental aspects of quality of life (QoL); and drinking behaviour. In that study, higher QoL was positively correlated with a score indicating light and moderate drinking. Compared to these two groups, those who consumed high levels of alcohol were more likely to obtain lower scores on each QoL dimension except for physical health. A noteworthy finding was that such domains as alcohol consumption pattern, dependency symptoms, and negative alcohol consequences explained only 1 to 3 per cent of variance in all QoL domains. Despite these interesting findings, the study by Mathiesen et al. (Reference Mathiesen, Nome and Eisemann2012) is silent on whether specific aspects of QoL are sensitive to drinking outcomes particularly within the context of gender, as has been seen in other, aforementioned research (e.g., Homila & Raitasalo, Reference Homila and Raitasalo2005).
Findings from the cited studies provide rich information on alcohol use–related issues in older populations when viewed in the context of factors related to drinking behaviour. However, without a priori defined types of interactions between predictor variables, commonly used multivariate statistical techniques have little capacity to detect and account for possible (e.g., non-linear) relations between variables (Ritschard, 2010). A clear need exists, therefore, to explore and identify constellations of simultaneously operating factors that profile and distinguish subgroups of individuals on the outcome variable of problem drinking. By using one decision tree procedure, the Chi-squared Automatic Interaction Detection (CHAID) segmentation technique (IBM, 2012), which was particularly suitable to our data in this regard, our study can contribute materially to current research on age-related alcohol use by advancing knowledge about the interactive nature of multiple factors associated with alcohol use in older populations. To our knowledge, no previous study of alcohol use among older adults drawn from a general population has employed a decision tree approach in its analysis, hence identifying the novelty of the work to be presented here.
Current Study
The objective of our study was to complement alcohol-related research by exploring the interactive effects of the personal and environmental factors, described in this review, on alcohol use outcomes measured by the Drinking Problem Index (DPI) (Finney, Moss, & Brennan, Reference Finney, Moss and Brennan1991). A related aim was to investigate the nature and patterns of heterogeneity between older alcohol consumers with and without drinking problems, regarding the variables of age, gender, education, living arrangements, loneliness, psychoactive prescription medication use, change of drinking patterns, and QoL measured by the World Health Organization Quality of Life-BREF (WHOQOL-BREF) scale (World Health Organization, 1998). By employing the CHAID segmentation technique (IBM, 2012), our study addressed the question of what constellations of personal and environmental factors distinguish older alcohol consumers with, and those without, drinking problems.
Methodology
Procedure and Participants
In this article we report cross-sectional data obtained from a comprehensive community survey investigating QoL and related factors regarding alcohol-related behaviours in a general population sample of older adults.
Following permission from the Norwegian Tax office, the community sample of 6,000 men and women aged 62 and older was randomly drawn by a commercial agency, from the target population of 57,972 inhabitants aged 62 and older residing in rural, semi-rural, and urban areas of one Norwegian county (Sør-Trøndelag [S-T]). In Norway, the formal statutory retirement age for men and women is 67, and the upper mandatory retirement age is 70. However, under the national pension system, an early retirement option is available to Norwegians at age 62, which many find attractive. Retirement can arbitrarily demarcate the transition from middle to older age, and we therefore set age 62 as the lowest boundary for eligibility to participate in this study. Although there was no exclusion criterion for the sample frame, the simple inclusion criterion was whether potential respondents were sufficiently fluent in Norwegian to be able to read and complete the survey. The sample frame of 6,000 participants represented approximately 10 per cent of the eligible target population.
Questionnaire Components
The 12-page questionnaire consisted of 150 questions and included three internationally validated instruments: the World Health Organization Quality of Life-BREF (WHOQOL-BREF) scale (World Health Organization, 1998); the Canadian Problem Gambling Index (CPGI) (Wynne, Reference Wynne2003); and the Drinking Problem Index (DPI) (Finney et al., Reference Finney, Moss and Brennan1991). Additional questions separately addressed drinking and gambling motivation, leisure, health-related and environmental factors, and a set of socio-demographics.
Data Collection
We collected data from May to September 2015. Questionnaires along with an invitation letter to participate in the study were mailed out to all potential participants in the sample frame. The invitation letter described the study and its purpose, clearly stating the inclusion of sensitive questions regarding alcohol use. A statement was provided that assured participants regarding strict anonymity of responses, and potential respondents were free to skip questions. To protect privacy, no reminder letter was sent to non-responders, neither could unreturned questionnaires be linked to any identifying information. Returned and completed questionnaires demonstrated consent to participate in the study. Out of the sample frame, 1,910 individuals (32% participation rate) responded to the survey with usable information (yielding an answer rate above 51 per cent) to questionnaire items. The detailed description of our study sample and of the eligible nonparticipants is presented in Figure 1.
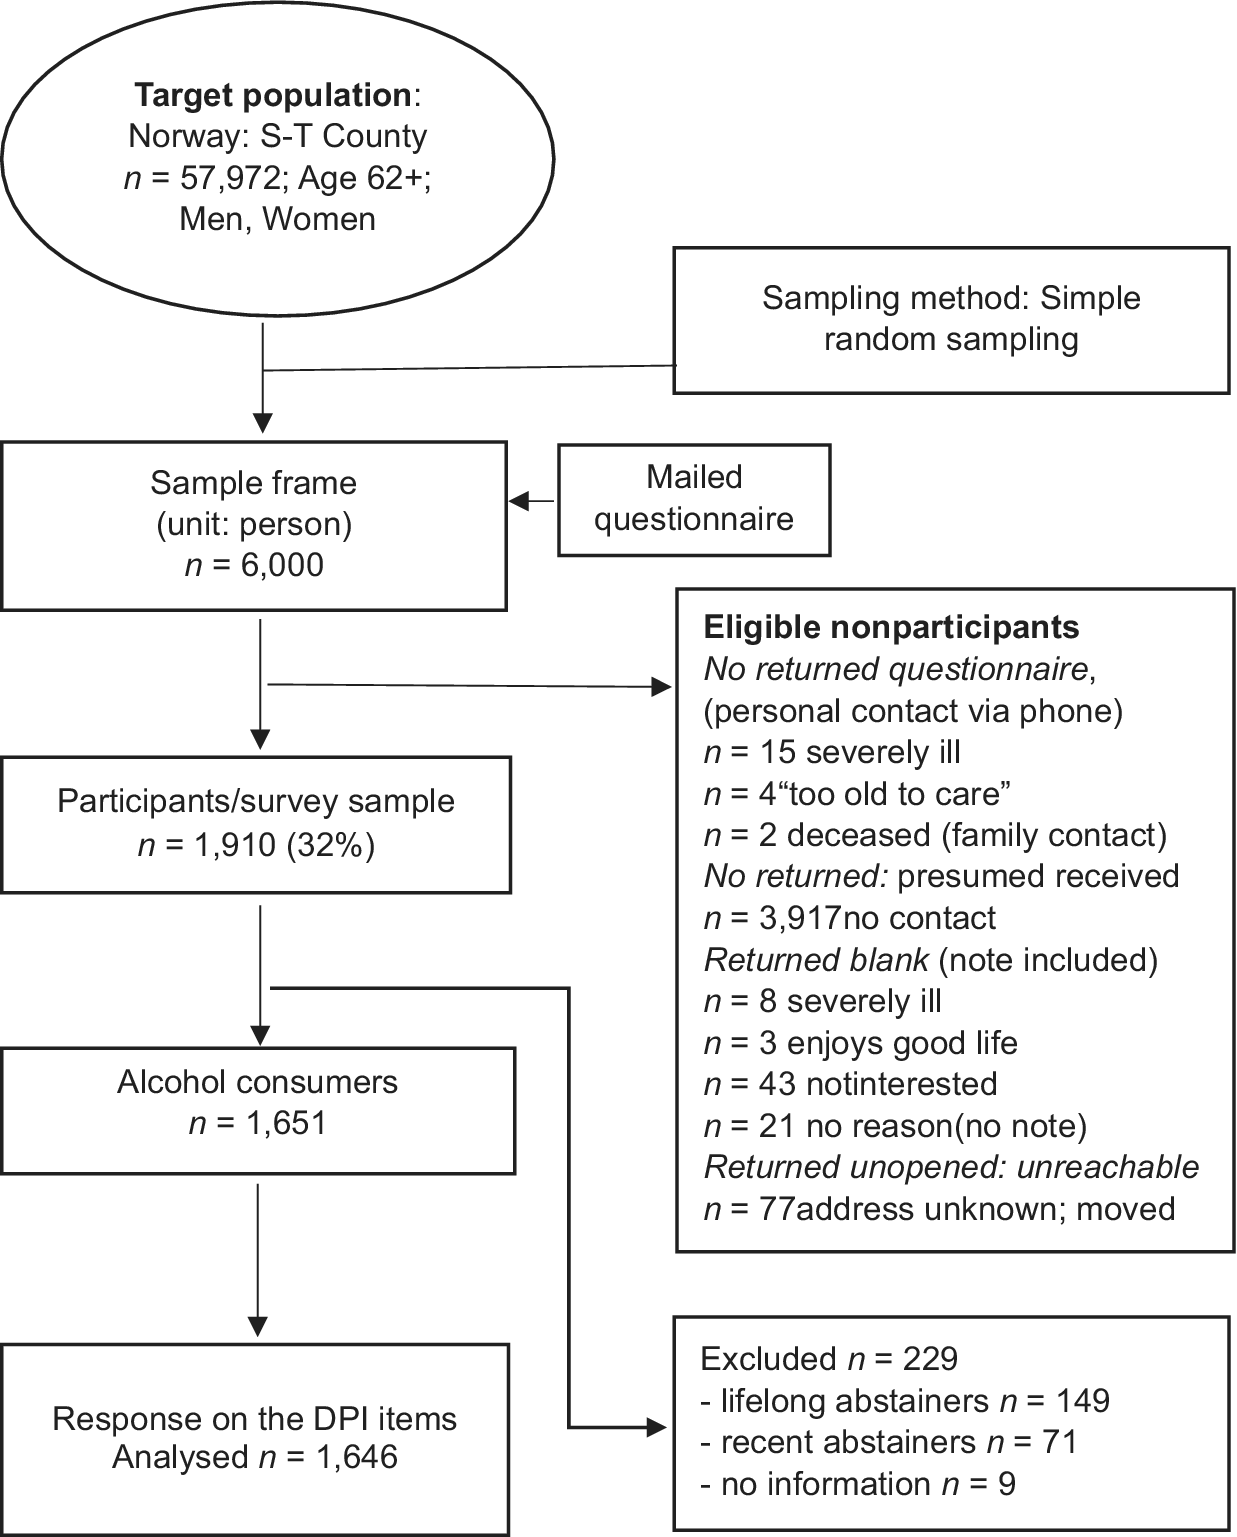
Figure 1: Flow chart of the sample selection process (S-T: Sør-Trøndelag)
Survey Sample and Target Population
Based on official population statistics for the census year 2015 (Statistics Norway, n.d.) for the target population, the gender distribution sample was 46 per cent men and 54 per cent women; in the survey response sample (n = 1,910), 52 per cent were men and 48 per cent were women. Age distribution of the target population and survey sample is shown in Table 1.
Table 1: Age distribution of target population versus survey participantsa

Note. a Missing information on age (n = 25).
Study Sample: Selection Process
Because the current study focused on alcohol drinking outcomes, participants who gave affirmative answers to “never drink alcohol” (n = 149; lifelong abstainers) and “did not drink alcohol during the last 12 months” (n = 71; “former” drinkers), and those who did not provide information on drinking status (n = 9) were excluded from the data analyses (n = 229).
The inclusion criterion (see Figure 1) required that participants who reported current alcohol consumption (n = 1,651) also provided information on the DPI. Based on this, the sample finally eligible for inclusion consisted of 1,646 respondents aged 62 to 95 years (M = 71.4; SD = 6.7). There were 892 men (54%) and 754 women (46%).
Measures
Data Considerations: Measurement Level
The only assumption in our CHAID analysis is that all variables are assigned an appropriate measurement level (e.g., ordinal). The CHAID operates on categorical, nominal, or ordinal scaled variables (including continuous variables which can be categorised) (Kass, Reference Kass1980), and generates a tree-like output based on splitting and merging steps in creating the tree branches and nodes (“leaves”). Prior to analysis, the properties of all variables in the current data set were determined to be categorical, and each variable included in our analysis had defined value labels. Failure to do so would have excluded all cases belonging to unlabeled categories.
Criterion Variable: Drinking Problem Index (DPI)
The DPI (Finney et al., Reference Finney, Moss and Brennan1991) was designed for use predominantly in research within community settings to identify the nature of adverse drinking experiences occurring in older adults. Translation of the DPI from English to Norwegian was conducted according to guidelines for international research (World Health Organization, 1998). The DPI 17-item scale (see Table 2) covers adverse personal (physiological/psychological, functional) and environmental/social consequences (isolation, family/friends’ concerns or frictions) due to drinking. Items were all rated on a 5-point frequency scale over the past year ranging from 0 (never) to 4 (often).
Table 2: DPI-15a item mean scores, standard deviations, and per cent of affirmative responses for the total sample, b men and women
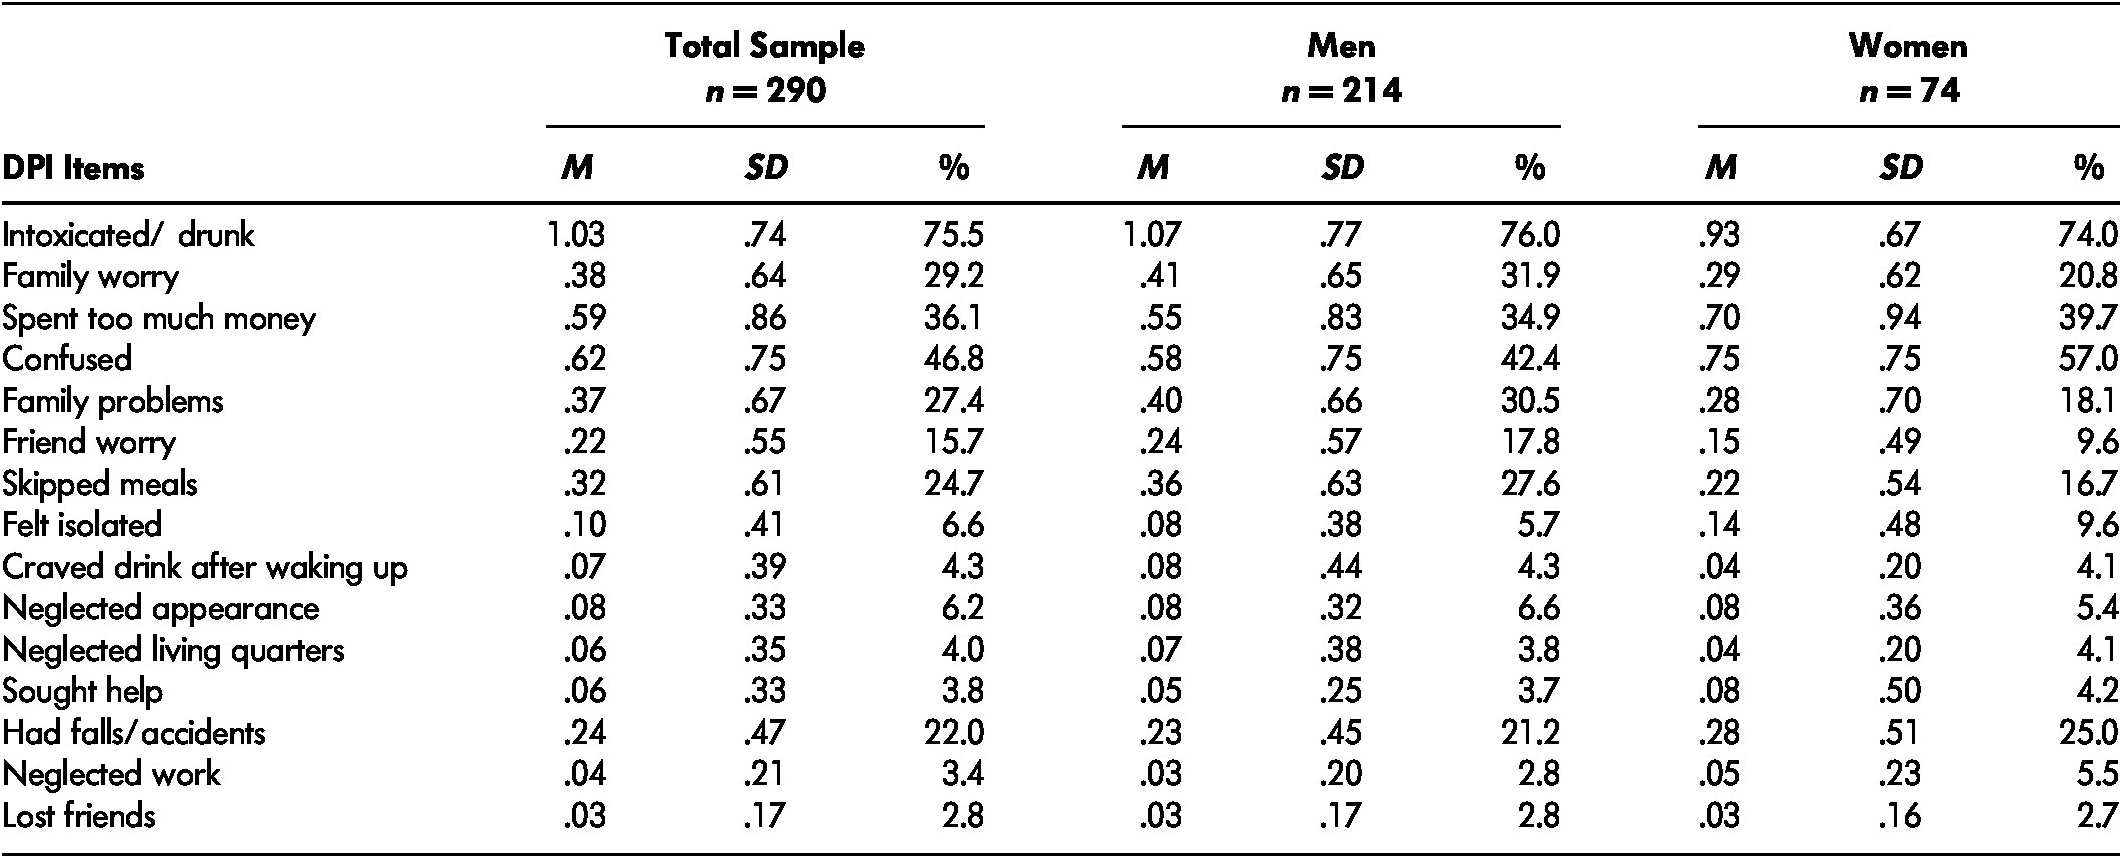
Note. a Omitted items from the DPI-17: “get high”, “drink to forget worries”. b Missing information on gender (n = 2).
M = Mean. SD = standard deviation. DPI = Drinking Problem Index.
The potential sum score range for the amended DPI 15-item scale was 0 to 60 (maximum score of 4 for each of 15 items). The criterion for definition of problem drinking (PD) was the cutoff score of ≥ 2 drinking problems based on affirmative answers to at least two DPI questions irrespective of the nature and frequency (i.e., from once or twice to often) of the problem with the possible score range of 2 (two endorsed questions with a value of 1 point each) to 60. In this study, the answers were dichotomised (yes/no) where nonproblem drinking (nPD) was coded 0 (DPI score 0 or 1), and the presence of PD (DPI score ≥ 2) was coded 1 representing a single value for any of the possible scores between 2 and 60. In our study, upon consultation with the DPI author, we used a slightly modified DPI consisting of 15 items. That is, based solely on judgmental (and not statistical) criteria, in this amended version the items “get high” and “drink to forget worries” were removed from the original scale for two reasons. First, according to Moos et al. (Reference Moos, Schutte, Brennan and Moos2004) and Finney et al. (Reference Finney, Moss and Brennan1991), these items do not perform optimally in the detection of PD. Described as “liberal”, they also tend to be endorsed by alcohol consumers who do not experience drinking problems. Second, the altered DPI covers the entirety of all the relevant aspects of drinking consequences measured in our study.
The DPI has been used in a large number of studies and performs well as a valid and reliable measure of drinking problems in older adults. The scale has high internal consistency ranging in studies from α =.80 to .94, good score performance (item-total score correlations = .71), and good construct and predictive validity (Bamberger, Sonnenstuhl, & Vashdi, Reference Bamberger, Sonnenstuhl and Vashdi2006; Finney et al., Reference Finney, Moss and Brennan1991; Gilson, Bryant, & Judd, Reference Gilson, Bryant and Judd2017; Kopera, Wiscott, & Sterans, Reference Kopera, Wiscott and Sterans1999). For the current sample, the internal consistency of the DPI 15-item scale was satisfactory (α = .85).
Socio-demographics: Age, Sex, and Education
We categorised the respondents’ age into the following five groups: 62–67, 68–74, 75–79, 80–84, 85+. The participant’s sex was coded 1 (women) and 2 (men). Education was recorded in the three following levels: “primary or part of it” coded 1; “any secondary” coded 2; and “tertiary” coded 3.
Living Arrangements
Living arrangements were defined in terms of five separate variables: living “alone”, “with spouse”, “with multigenerational family”, “with friends”, and “in residential care”. An affirmative answer to any option was coded 1.
Psychosocial: Loneliness
Loneliness was measured by a single question: “how often during the last 12 months have you felt lonely”. The original response categories ranged from 1 (never), 2 (very seldom), 3 (sometimes), 4 (often), 5 (very often). These were recoded into three categories set as follows: 1 (never), 2 (sometimes: merged 2–3), and 3 (often: merged 4–5).
Health Indicators: Psychoactive Medication Use for a Diagnosed Condition
Information on medication use during the past 12 months was obtained by affirmative answer (coded as 1) given to any of the following types of medication: pain killers, sleeping pills, anti-depressives, tranquilizers, none of listed. Each type of medication corresponds to a separate variable.
Alcohol Behaviour: Drinking Pattern Change
If current drinkers changed their alcohol consumption in the past 12 months, then this was measured by providing affirmative answers coded 1 to any of the following: “reduced the amount of alcohol”; “reduced the number of times you drink”; “switched to drink more low-alcoholic drinks”; “switched to drink higher-alcoholic drinks”; “tried to stop drinking alcohol completely”; and “have not changed drinking patterns”. Each option here represents a separate variable.
Quality of Life
Quality of life in the past two weeks was measured by the Norwegian version of WHOQOL-BREF 26-item questionnaire (WHO, 1998). The WHOQOL-BREF is a generic measure which groups QoL into the following facets: Physical Domain 1 (PHYS-7 items); Psychological Domain 2 (PSY-6 items); Social Domain 3 (SOC-3 items); and Environmental Domain 4 (ENVIR-8 items). In addition, using two general questions, the instrument addresses satisfaction with “overall quality of life” (1 item) and “general health” (1 item). A score is derived for each item on a scale between 1 and 5, with higher scores indicating a higher level of QoL. The mean scores were generated for each domain following the WHO scoring guidelines (WHO, 1998).
The WHOQOL-BREF has been extensively used in research worldwide (Skevington, Lofty, & O’Connell, Reference Skevington, Lofty and O’Connell2004) including community-dwelling older adults (Carrasco, Laidlaw, & Power, Reference Carrasco, Laidlaw and Power2011; Hawthorne, Herrman, & Murphy, Reference Hawthorne, Herrman and Murphy2006; Kalfoss, Low, & Molzahn, Reference Kalfoss, Low and Molzahn2008; Von Steinbuchel, Lischetzke, Gurny, & Eid, Reference Von Steinbuchel, Lischetzke, Gurny and Eid2006). These studies reported acceptable psychometric properties of the scale indicated by test-retest reliability; construct-, criterion-, discriminant-, and concurrent validity; and sensitivity to change. The Cronbach alphas for the four domains varied from marginal and low values of .55 and .66 (SOC domain) to satisfactory values up to .84 for the remaining dimensions. In the current study, Cronbach alphas for the four domains were .80 for PHYS, .81 for PSY, .65 for SOC domain, and .83 for ENVIR. The complete list of WHOQOL-BREF domains and items is presented in the online supplement, Table A1, Appendix A.
Respondents in the current study were initially classified into five groups based on quintiles of mean raw scores for each QoL domain. However, in order to highlight the extreme ends of the range (respondents with the lowest and the highest scores), the three central quintiles (2nd, 3rd, and 4th) were collapsed into one group. This operation resulted in three categories representing low (1st quintile), medium (2nd, 3rd, 4th quintile), and high (5th quintile) level of QoL.
The “overall quality of life” (1 item) was recoded from the original five into three categories as follows: coded 1 “(very) poor”, coded 2 for “neither poor nor good”, and coded 3 for “(very) good”. Following the same procedure, the satisfaction with “general health” (1 item) was set to 1 if respondents reported being “dissatisfied”, 2 if “neither satisfied nor dissatisfied”, and 3 if “(very) satisfied”.
Data Analysis
Our analysis of the frequency distribution and sample characteristics by DPI score was accompanied by comparisons of nPD and PD groups using chi-square tests for comparison of counts (p < .05). Additionally, we conducted descriptive analyses for the DPI items for the total sample and separately for men and women. To examine gender differences, we compared DPI mean scores for men and women by using independent sample t-tests (two-tailed) with the Bonferroni adjusted original p value .05 divided by the number of comparisons (k = 15) (α altered=.05/15; p < .003).
To explore the interactive effects of independent variables that optimally explain the dependent variable, we employed the CHAID algorithm classification method based on a series of chi-square tests. This method has the ability to identify significantly different, mutually exclusive homogenous subgroups of the population who share similar characteristics in terms of a distinctive multivariable pattern which influences a variable of interest (i.e., DPI score). The CHAID method generates a tree-like structure output starting with the “root” node consisting of the entire sample, which then, based on the most influential independent variables (with the lowest error probability/smallest p value), splits further in a recursive fashion into “branches” ending at a terminal “child” node. The number of terminal nodes indicates the number of homogenous subgroups defined by the set of most significant independent variables. The CHAID technique is nonparametric (e.g., no assumptions of normal distribution need to be met, and robust to “outliers”), and allows for data analysis with missing values which are included as a valid category, and “a floating predictor” which can be either merged with other most similar values or kept as a separate group (Kass, Reference Kass1980). Additionally, CHAID as a data mining method performs optimally with large samples of at least 1,000 cases (Antipov & Pokryshevskaya, Reference Antipov and Pokryshevskaya2010) due to its use of multiple splits. Details on how CHAID operates can be found in IBM SPSS Decision Trees 21 (IBM, 2012), or in work by Kass (Reference Kass1980), or by Ritschard (Reference Ritschard, McArdle and Ritschard2013).
We ran the exhaustive CHAID tree growing option algorithm, which allows examination of the independent variables at each tree node of analysis so that the inclusion of a variable on one branch of the tree does not exclude it from other branches (De Ville & Neville, Reference De Ville and Neville2013; IBM, 2012). The tree structure here was based on a customised minimum number of cases for parent nodes n = 20 and child nodes n = 10. Tree depth was set at five levels. This was done because decreasing the minimum values for nodes and increasing the depth of the tree would likely produce more informative results (larger number of end nodes, and hence profiles). The significance level for splitting and merging nodes was set using the default option to α merge, split, with adjusted p value ≤ .05 using the Bonferroni correction method for multiple comparisons. The quality of the model was assessed by using a 4-fold cross-validation method and misclassification risk table. All statistical analyses were performed with SPSS for Windows v.24.0.
Results
Sample Characteristics
Table 3 displays sample characteristics on 25 independent variables included in the CHAID analysis by the DPI score. Descriptive statistics revealed that in the overall sample most of the respondents had not experienced drinking problems, but there were several significant differences in proportions on several variables between nPD and PD groups. With regard to gender, we observed a higher rate of PD among men than women and among respondents in younger age groups compared to those aged older than 75 years. With regard to living arrangements, compared to nPD, the rate of PD was significantly lower among persons living alone. In those who reported experiencing loneliness at some level, there was a higher proportion of PD compared to nPD. In the overall sample, the majority of the respondents had not changed their drinking pattern, and the percentage of those individuals was significantly higher in the nPD category.
Table 3: Sample characteristics on 25 independent variables by the DPI score, n = 1,6461
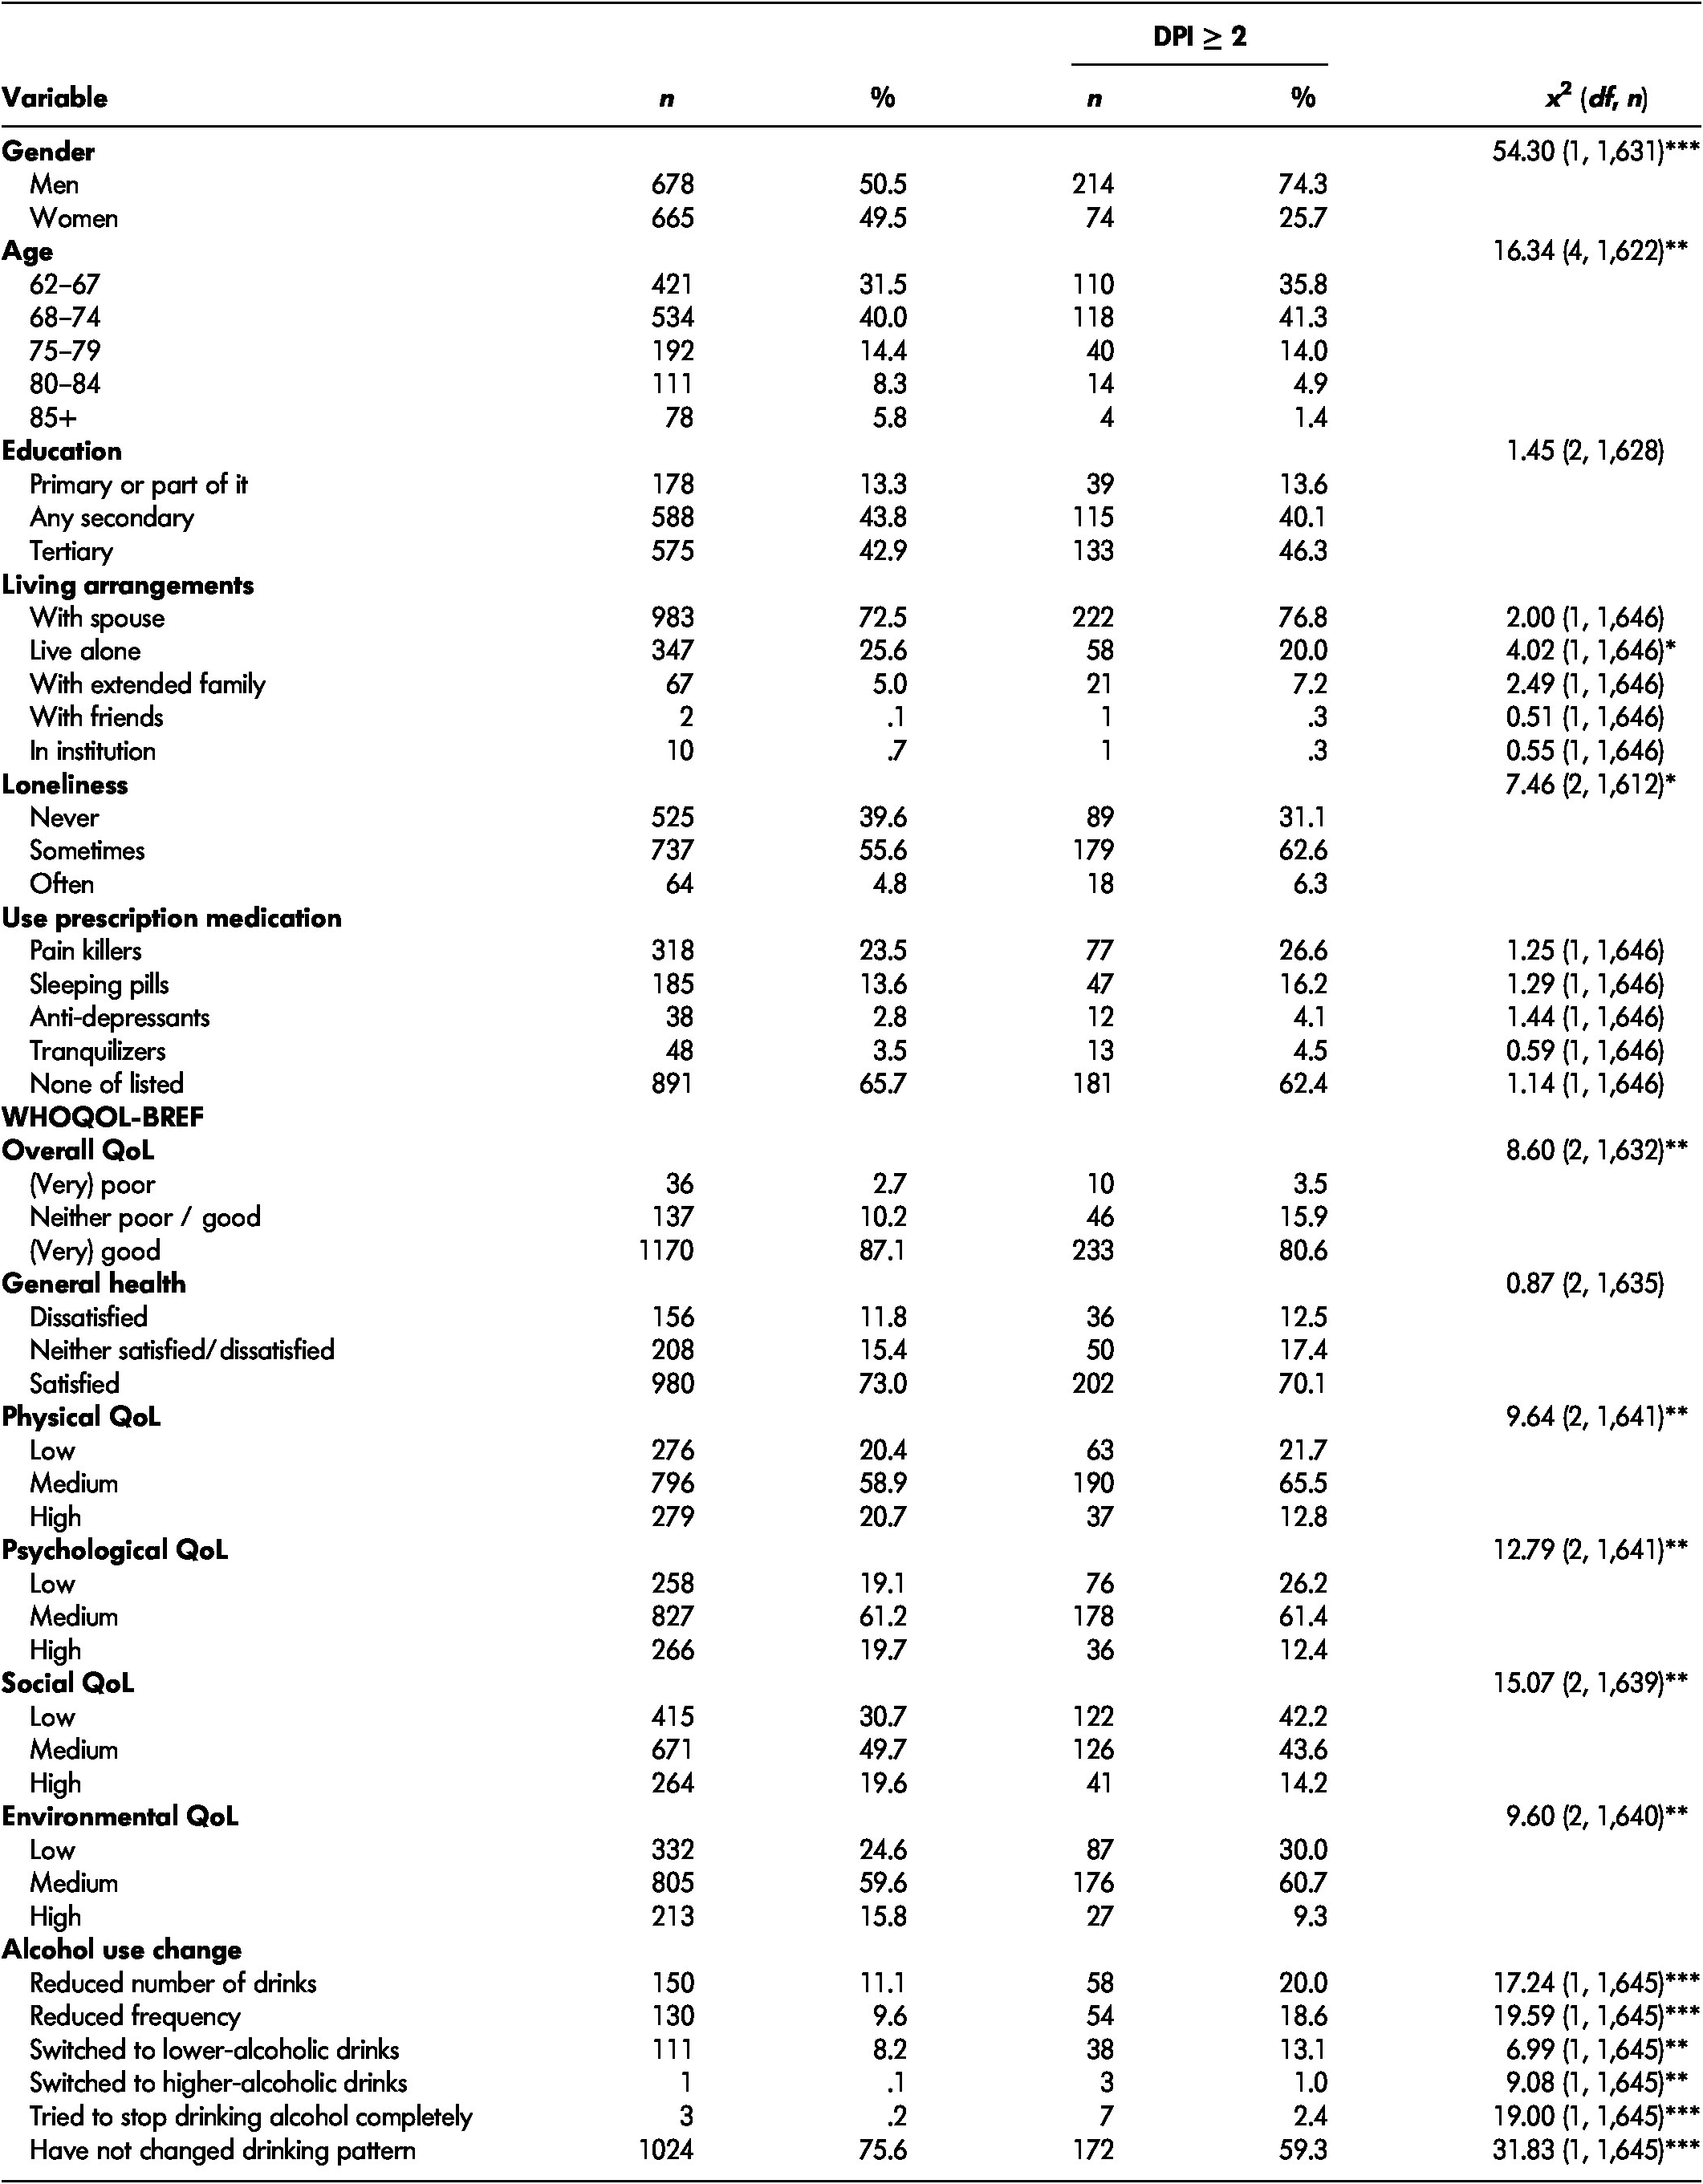
Note. a n varies due to missing data. x 2 = chi square. df = degrees of freedom. DPI = Drinking Problem Index. QoL = quality of life
* p < .05. ** p < .005. *** p < .0005.
In comparison to low and medium levels of satisfaction with QoL in general, the rate of PD was lower among individuals who reported higher satisfaction with overall quality of life. With regard to QoL domains, a significantly higher proportion of PD than nPD was observed among persons reporting “medium” satisfaction with physical health (PHYS domain). In contrast, those highly satisfied with their physical functioning more often reported nPD than PD. With regard to psychological functioning (PSY domain), a higher frequency of PD than nPD was observed in the group scoring low on this dimension. In the group with high scores, the percentage of PD was significantly lower than for nPD. The percentage of persons dissatisfied with their social relations (SOC domain) was higher in the PD than the nPD group. In contrast, those highly satisfied with social functioning were more frequently found in the nPD than the PD category. Lastly, low satisfaction with environmental circumstances (ENVIR domain) was more frequently reported by individuals in the PD than the nPD group.
DPI
Table 2 displays the means, standard deviations, and percentages of affirmative answers on individual DPI 15 items for the total sample, separately for men and women. There were no significant gender differences in relation to the reported nature of drinking problems. The actual PD scores in our sample ranged from 0 to 31 (results not shown).
CHAID: Group Profiles Based on DPI Score
The graphic output based on the results of the CHAID analysis is presented in Figure 2. The CHAID model resulted in a total of 26 nodes including 14 terminal (child) nodes. The overall percentage of correctly classified alcohol drinking outcomes for the total sample was high, at 82.4 per cent with a low misclassification risk of .176 (SE = .009). For four cross-validated samples, the misclassification risk was .177 (SE = .009), which indicates that the model is fairly stable and would perform well among random subsamples of the study population.
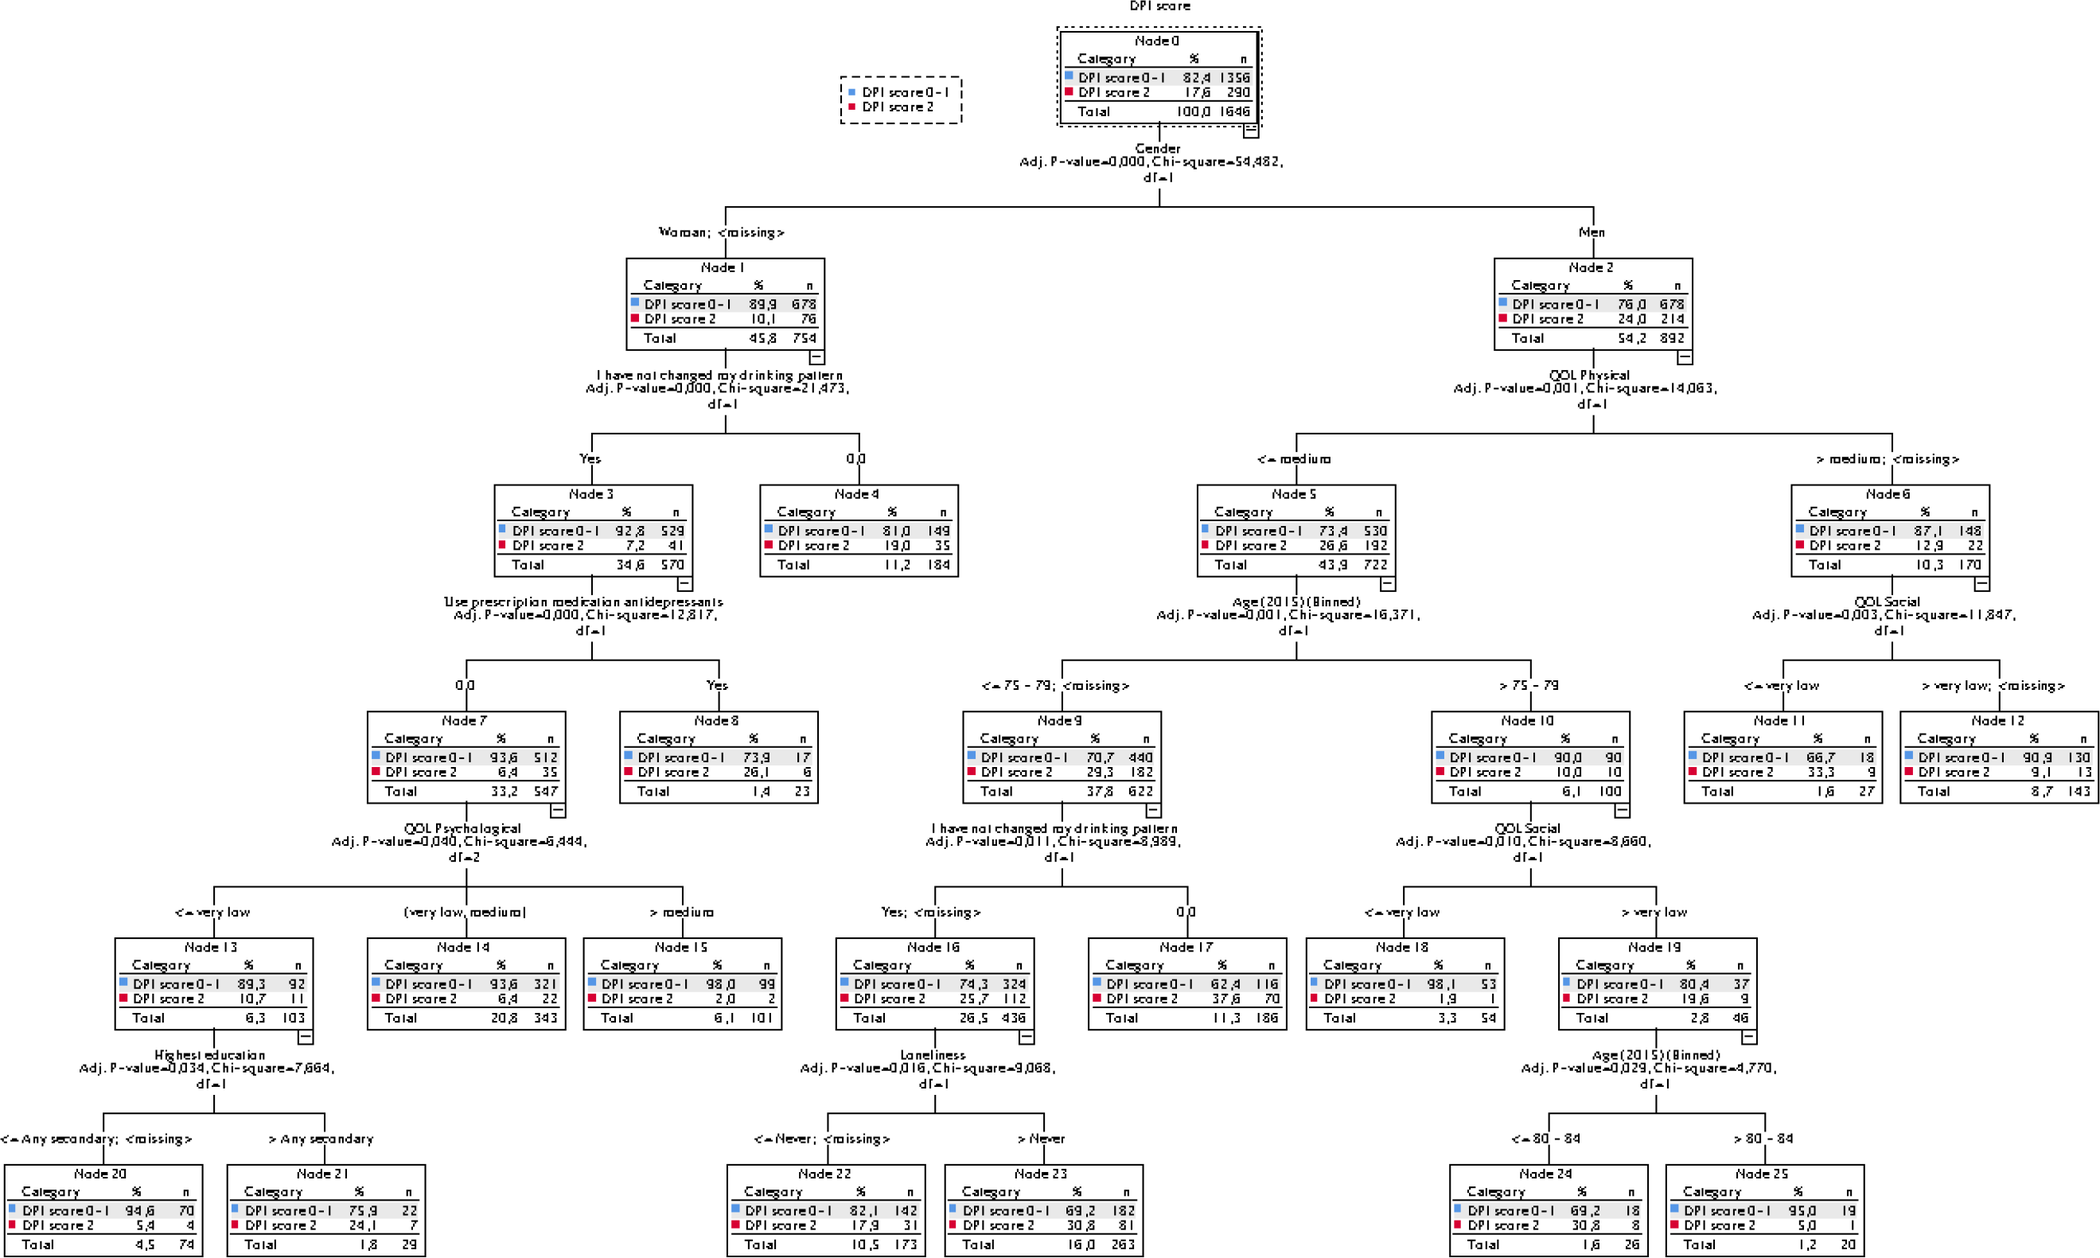
Figure 2: The dendrogram based on the results of the CHAID analysis with predictors of nonproblem and problem drinking
Within the nPD group (the DPI score 0–1; n = 1,356), there were 89.9 per cent of all women and 76 per cent of all men. Within the PD group (the DPI score ≥ 2; n = 290), there were 10.1 per cent of all women and 24 per cent of all men. According to the model, gender (forming two major clusters of independent variables) was most strongly associated with drinking behaviour outcomes. Subsequently, the group of women and men were further segmented into six and eight subgroups respectively.
In descending rank of influence on drinking behaviour, for women these were the following: “have not changed drinking patterns”, using “anti-depressants”, satisfaction with “psychological functioning” (QoL PSY domain), and “education”. For men, the influential variables (in descending order) included the following: satisfaction with “physical functioning” (QoL PHYS domain), “age” and satisfaction with “social relations” (QoL SOC domain), “have not changed drinking patterns”, and “loneliness”. In addition, maintenance of drinking habits, albeit differentially influential, was a common factor in constellations of variables related to PD and nPD among women and men. Depending on the type of clustered classification variables (e.g., characterising individuals with the highest PD), among women the prevalence of nPD ranged from 98 per cent to 73.9 per cent and of PD from 2 per cent to 26.1 per cent. Among men, the prevalence of nPD ranged from 98.1 per cent to 62.4 per cent and of PD from 1.9 per cent to 37.6 per cent.
Women
Group 1 (n = 99) at 98 per cent (end node 15) represented the highest proportion of respondents without drinking problems derived from the group of women who maintained their drinking habits, were not using antidepressant medication, and reported medium and above satisfaction with quality of life in terms of psychological functioning. This constellation characterised the lowest percentage (2%) of PD women.
Group 2 (n = 70) with a 94.6 per cent rate (end node 20) of nPD was derived from women who maintained their drinking habits, were not using antidepressant medication, reported very low psychological functioning, and had intermediate or lower education. The cumulative effect of this constellation of factors distinguished 5.6 per cent (n = 4) of PD women.
Group 3 (n = 321) at 93.6 per cent (end node 14) who reported nDP, although otherwise similar, differed from Group 1 in reporting medium to low psychological functioning. This pattern of factors distinguished 6.4 per cent (n = 22) of women in the sample with DP.
Group 4 (n = 149; 81%; end node 4) consisted of nPD women, who in contrast to all other groups had made some type of shift in their drinking behaviour (e.g., reduction of frequency). This constellation of factors corresponded to 19 per cent (n = 35) of PD women.
Group 5 (n = 22; 75.9%; end node 19) derived from nPD women, who maintained drinking habits, reported very low satisfaction with psychological functioning, and had intermediate and above education. This constellation corresponded to the next highest rate of PD reported by 24.1 per cent (n = 7) women.
Group 6 (n = 17) at 73.9 per cent (end node 8) represented the lowest proportion of nPD women who maintained their drinking habits and used antidepressant medication. This constellation of factors statistically contributed to the highest percentage of PD women (26.1%; n = 6).
Men
Group 1 (n = 52) at 98.1 per cent (end node 18) represented the highest proportion of nPD respondents derived from group of men who reported medium or lower satisfaction with physical health, aged 75 and older, and reported very low satisfaction with social relationships. This type of constellation characterised one man reporting PD (1.9%).
Group 2 (n = 19) at 95 per cent (end node 25) represented the second highest nPD group derived from men aged 75 and older, who in contrast to Group 1 reported some to high satisfaction with social relations. This profile corresponded in particular to men of more advanced age (> 80 years). The effect of these combined factors, as in the group above, was “atypical” for PD and related to one person.
Group 3 (n = 130) with a 90.9 per cent (end node 12) of nPD was derived from men who reported medium and above satisfaction with physical health, and satisfied at some level with their social relationships. This constellation of factors was present for 9.1 per cent (n = 13) of PD men.
Group 4 (n = 142) distinguished 82.1 per cent (end node 22) nPD men reporting medium or lower satisfaction with physical health, belonging to a younger age group (below 79 years) who have maintained their drinking habits, and did not report ever feeling lonely. This profile corresponded to 31 PD men (17.9%).
Group 5 (n = 182) at 69.2 per cent (end node 23) represented men having a similar profile to those in Group 4. However, here men did report experiencing loneliness at some level. This constellation of factors represented 30.8 per cent (n = 81) of persons with PD.
Group 6 (n = 18) including a 69.2 per cent (end node 24) nPD respondents was derived from men reporting medium or lower satisfaction with physical health, who were older than 75 years, and were not dissatisfied with their social relationships. This profile related in particular to men aged older than 80 years. In this segment, there were eight PD men (30.8%).
Group 7 (n = 18) consisted of 66.7 per cent (end node 11) nPD men who reported above medium satisfaction with physical health and very low satisfaction with social relations. This profile corresponded to the next highest proportion of PD (n = 9; 33.3%).
Group 8 (n = 116) at 62.4 per cent (end node 17) distinguished nPD men who reported medium or lower satisfaction with physical health, belonged to a younger age group (below age 79) and who, in contrast to all other groups, have made some sort of shift in their drinking behaviour (e.g., reduction in drinking frequency). Men in this segment reported the highest rate of PD (37.6%; n = 70).
Discussion
Consistent with the longitudinal study by Brennan, Schutte, Moos, and Moos (Reference Brennan, Schutte, Moos and Moos2011), results from the descriptive analysis showed that PD increased (albeit slightly) among individuals between 62 and 74 years, and then sharply declined after age 75. Various explanations have been offered to shed light on why alcohol consumption and drinking problems are frequently observed to decrease with increasing age. These include biology/health, social influence, natural desistance, under-detection, and premature death (Brennan, Schutte, & Moos, Reference Brennan, Schutte and Moos2010; Fillmore, Reference Fillmore1987; Haarni & Hautamäki, Reference Haarni and Hautamäki2010; Temple & Leino, Reference Temple and Leino1989; Vaillant, Reference Vaillant1995).
Apart from these findings, and in contrast to nPD groups, significant gender differences were detected with regard to PD, with men outnumbering women threefold. These observations accord with other investigations, which have shown a similar gendered pattern most pronounced in relation to PD (Gilson at el., Reference Gilson, Bryant and Judd2017; Hoeksema & Hilt, Reference Hoeksema and Hilt2006; Homila & Raitasalo, Reference Homila and Raitasalo2005; Mathiesen et al., Reference Mathiesen, Nome and Eisemann2012; Moos, Schutte, et al., Reference Moos, Schutte, Brennan and Moos2010; Wilsnak, Vogeltanz, Wilsnack, & Harris, Reference Wilsnak, Vogeltanz, Wilsnack and Harris2000). Our analysis, and likely also that of previous investigations, cannot rule out the influence of gender bias in reporting. However, since there is high consensus regarding male predominance in PD, one view is that this differential apparently ensues from universal biological differences between men and women in (inter alia) body weight and differing metabolic tolerance to the effects of alcohol (Vaillant, Reference Vaillant1995). Gender variations in drinking behaviour and its outcomes are not arbitrary, and it is likely that they depend on the social and cultural contexts. Homila and Raitasalo (Reference Homila and Raitasalo2005, p. 1763) concluded that “gender differences in drinking behavior are found everywhere to such an extent that they can be considered one of the few universal gender differences in human social behavior.”
In contrast to Finney et al. (Reference Finney, Moss and Brennan1991), there were no significant gender differences in relation to the reported nature of drinking problems. However, in comparison to women, the nature of PD in men appeared to revolve around social circumstances at a slightly higher rate. For women, PD related more often to negative psychological effects of alcohol and neglect of work.
Again, in the present study, the gender disparity in factors correlated with drinking outcomes was clearly reflected in CHAID results. Our findings indicated that specific variables in particular constellations are distinctively (albeit not perfectly) associated with the absence or presence of drinking problems between and within groups of women and men.
Women
In this study, the large majority of women (about 90%) who consumed alcohol did so without problems. According to the CHAID analysis, whether or not drinking alcohol has decreased emerged as the most influential factor determining women’s experiences of the effects of alcohol resulting in either nPD or PD. This factor interacted with specific circumstances such as the use of antidepressants, the level of satisfaction with psychological functioning (QoL PSY domain), and educational attainment.
Nonproblem Drinking
The CHAID analysis suggested that the likelihood of nPD increases alongside higher scores in the psychological domain of QoL. In particular, medium to high satisfaction with psychological functioning seemed to play an important role in constellations of factors predominantly related to the highest prevalence of nPD (98%). Similar to previous studies, this finding highlighted the positive association between similar constructs of mental “well-being” (e.g., absence of psychological/emotional distress) (Anderson et al., Reference Anderson, Scafato and Galluzzo2012; Holdsworth et al., Reference Holdsworth, Frisher, Mendonça, De Oliveira, Pikhard and Shelton2017; Lang, Wallace, Huppert, & Melzer, Reference Lang, Wallace, Huppert and Melzer2007; Peele & Brodsky, Reference Peele and Brodsky2000; Stranges, Samaraweera, Taggart, Kandala, & Brown, Reference Stranges, Samaraweera, Taggart, Kandala and Brown2014), or “best QoL” linked to low to moderate levels of alcohol consumption (Mathiesen et al., Reference Mathiesen, Nome and Eisemann2012), which was in turn associated with the absence of alcohol-related problems. However, in contrast to results based on a linear regression model, which predicted nPD for all individuals with higher scores on the QoL PSY domain (Mathiesen et al., Reference Mathiesen, Nome and Eisemann2012), the CHAID analysis more specifically identified for whom in particular this association seems to apply. In practice, for example, for the purpose of designing public health intervention, results based on a regression model would point towards targeting the average member of the population. In contrast, the results based on the CHAID model were more sensitive to heterogeneity of the population, and hence it would direct intervention efforts towards its potentially distinctive subgroups.
In a separate group, a still high (albeit a slightly lower) rate of nPD (94.6%) was associated with very low satisfaction with mental health, but solely among lesser-educated women (i.e., secondary school or below). This finding appeared to support at least two lines of further research. First, the fact that in this segment lower education increased the likelihood of nPD may generally reflect poorer integration of alcohol consumption into lower as opposed to more highly educated women’s lifestyles (Huerta & Borgonovi, Reference Huerta and Borgonovi2010). Second, the research, which takes into account the social gradient in health among older people, commonly showed that psychological distress tends to cluster with poor health, and showed more frequent medical health problems in those in a low socio-economic position relative to those placed higher on the socio-economic ladder (Huisman, Kunst, & Mackenback, Reference Huisman, Kunst and Mackenback2003; Ores, Bongers, Goor, & Garretsen, Reference Ores, Bongers, Goor and Garretsen1999; Stewart-Brown, Samaraweera, Taggart, Kandala, & Stranges, Reference Stewart-Brown, Samaraweera, Taggart, Kandala and Stranges2015). Interestingly, the CHAID analysis has ruled out the influence of general health (QoL global health) and physical health status (QoL PHYS) on nPD in this group of women. This does not necessarily indicate, however, that health was unrelated to nDP, but because the data is correlational, the CHAID analysis excluded correlated factors even if they were only slightly weaker in differentiating subgroups on the next level of the tree.
Problem Drinking
The interaction of unchanged drinking habits with the use of antidepressants resulted in the highest prevalence of PD women (26.1%). This finding increased confidence in the conclusions reached by previous studies regarding the notable role of depression (indicated here, by proxy, in the use of antidepressants) particularly in PD women (Lemke et al., Reference Lemke, Schutte, Brennan and Moss2008; Schutte, Hearst, & Moos, Reference Schutte, Hearst and Moos1997). However, in our study it is uncertain how depression within that group relates to PD. According to prior findings, depression may be a cause or a consequence of PD (Lemke et al., Reference Lemke, Schutte, Brennan and Moss2008; Schutte et al., Reference Schutte, Hearst and Moos1997; Vaillant, Reference Vaillant1995). Whatever the case, alcohol has the effect of exacerbating depression, making it more difficult to treat (Brennan, SooHoo, Lemke, & Schutte, Reference Brennan, SooHoo, Lemke and Schutte2016), and more difficult for most people to successfully desist from PD (Schutte et al., Reference Schutte, Hearst and Moos1997). The fact that any one type of desistance from alcohol has not entered the CHAID model for this group of women does not necessarily preclude attempts to change drinking behaviour (if perceived problematic) which may have been made at some point earlier than in the past year.
If that is the case, our finding could corroborate existing evidence that depression tends to act as an effective barrier in desisting from PD (Schutte et al., Reference Schutte, Hearst and Moos1997). Moreover, four factors suggest that the severity of consequences may be far greater due to a lack of immediate help when needed. The factors are as follows: (a) older women are more likely than men to use alcohol with psychoactive medications (Blow, Reference Blow2000; Bye & Rossow, Reference Bye and Rossow2017); (b) more private drinking (drinking alone) among women (Blow, Reference Blow2000; Bond et al., Reference Bond, Roberts, Greenfield, Korcha, Ye and Nayak2010; Epstein, Elber, & Al-Otaiba, Reference Epstein, Elber and Al-Otaiba2007); (c) generally, a higher likelihood of women than men living alone (the actual case in our study); and (d) the tendency of those living alone to use alcohol with medication (Bye & Rossow, Reference Bye and Rossow2017). It is worth noting that in our study, experiencing “confusion” and “falls/accidents” were reported at a slightly higher rate among PD women than PD men, although this difference was not statistically significant (see Table 2).
The decision tree further showed that experiencing very low psychological functioning and having higher education (secondary and higher) was a distinctive attribute for still another subgroup of PD women (24.1%). Some population studies investigating drinking patterns have shown that in contrast to lesser-educated women, those with more education tend to drink more and use alcohol at more hazardous, harmful, or unhealthy levels (Huerta & Borgonovi, Reference Huerta and Borgonovi2010; Kelfve, Agahi, Mattsson, & Lennartsson, Reference Kelfve, Agahi, Mattsson and Lennartsson2014). This type of drinking behaviour may ensue from more frequent environmental exposure to alcohol during the social interactions that encourage the concomitant use of alcohol and quite possibly also from having greater purchasing power (Holdsworth et al., Reference Holdsworth, Frisher, Mendonça, De Oliveira, Pikhard and Shelton2017; Moos, Schutte, et al., Reference Moos, Schutte, Brennan and Moos2010). It has been recently speculated that the more educated women are, the more likely they are to report having drinking problems (Huerta & Borgonovi, Reference Huerta and Borgonovi2010). This may well be the case here. However, the fact is that the CHAID analysis did not point to the single effect of education on PD but to its interaction with three other variables in combination (see Figure 2). It is intriguing that PD within the general population of more highly educated women in particular has received little attention in the alcohol literature. Research thus far has tended to link negative drinking outcomes rather more to the disadvantage of a lower social strata. Thus, our finding deserves consideration in investigating and thoroughly reporting PD (if any be found) in all socially defined socio-economic groups studied within community settings and otherwise.
The third group involved the 19 per cent of PD women who made some kind of alteration in their drinking behaviour (e.g., reduction of drinking). The size (n = 35) of this group is relatively high in comparison with the above two PD segments. However, the CHAID model did not provide other information on the attributes for this group of women. Although “drinking pattern change” was a more distinctive behavioural attribute of nPD individuals, it was a rather ambiguous profile descriptor. Considering that a reduction in drinking was the only common factor related to drinking outcomes for women and men, albeit with differing levels of influence on PD, we discuss this finding in the “Health Protective Behaviour: Desistance from PD” section.
Men
In comparison to women, CHAID results for men revealed (with one exception) not only dissimilar but also more complex constellations of factors related to drinking outcomes. In general, the level of satisfaction with physical health (QoL Physical domain) was the main factor explaining drinking outcomes for all men across different subgroups. The interacting factors significantly associated with nPD and PD were age, level of satisfaction with social relations (QoL Social domain), whether or not any shifts in drinking behaviour had occurred, and loneliness.
Nonproblem Drinking
The highest rate of nPD (98.1%) was found in one group of men aged 75 and older reporting only fair or poor physical health, and who were especially dissatisfied with their social relationships. Slightly different compared to men from that group was another segment of still older (more than 80 years) nPD men (95%) characterised by the same physical health status, but who, by contrast, were broadly satisfied with the quality of personal relationships. There are several implications of these two particular nPD profiles. The fact that more advanced age interacted with somewhat reduced health and quality of social interactions in general may indicate that it is not age per se that accounts for nPD. It may be, rather, that consumption of alcohol in a non-problematic (i.e., avoiding the unpleasant effects of alcohol) manner arises in response to biological changes (e.g., reduced functional status) and changes (e.g., in a negative or positive direction) in the social environment that are more likely to occur in late life (Center for Substance Abuse Treatment, 1998).
The evidence from our study also indicates that (very) low satisfaction with social relationships does not necessarily correspond to PD as reported in Mathiesen et al. (Reference Mathiesen, Nome and Eisemann2012). Moreover, for some men, high chronological age (i.e., 80 years and older) is not synonymous with deficits in their social sphere. On the contrary, such older men may in fact receive more family support and protection. For instance, a heightened surveillance of their health through safeguarding and care may involve norms promoting abstinence or tolerating occasional drinking at social gatherings which involve the consumption of alcohol at levels that do not pose hazards to health. Notably, the two profiles are highly atypical for men reporting PD.
The quality of physical health and social interactions recurred in another subset of men reporting nPD (90.9%). In contrast to the two groups already described, the CHAID analysis identified the effect of satisfactory physical health (medium and above) in combination with at least some level of satisfaction with social relations. This finding may indicate at least two possibilities. First, healthier individuals may have higher biological tolerance to any negative effects that alcohol can create irrespective of social environment, whether or not it is permissive of drinking. Second, nPD in this subgroup of men (as well as in those discussed above) may result from exposure to social environments with restricted availability of alcohol, or where its use (e.g., at social gatherings) occurs in a controlled manner characterised by “hedonistic enjoyment” (Haarni & Hautamäki, Reference Haarni and Hautamäki2010, p. 247). However, in comparison to the two aforementioned groups of men described earlier, this profile of nPD men is much less clear. That is to say, one in 10 men in “equal” circumstances report PD. Seemingly, there will always be exceptions to the rule.
Problem Drinking
The highest frequency of PD (37.6%) was found in men reporting fair to low satisfaction with physical health, who were 79 years old or younger, and who have reduced their alcohol use in the past year. Although we do not have any data on the reasons for this change in drinking behaviour, it is reasonable to assume that some kind of health burden might have driven these men to reduce their drinking. If this is the case, then the finding may offer support to the morbidity hypothesis, which suggests that a deterioration of health is associated with reduced drinking (Moos, Brennan, et al., Reference Moos, Brennan, Schutte and Moos2010). Nonetheless, one immediate and plausible explanation for the link between compromised health and a negative drinking outcome is that the person in poorer health is likely to experience intoxication more rapidly even at a very low intake of alcohol (Moos, Brennan, et al., Reference Moos, Brennan, Schutte and Moos2010).
In another population segment of our study, 33.3 per cent of PD consisted of men in acceptable or very good health but who were dissatisfied with their social relationships. This profile resembled characteristics of PD men described in previous studies. For example, Watt et al. (Reference Watt, Heilmann, Sabbah, Newton, Chandola, Aida and Tsakos2014) indicated that individuals with poor social relationships or who are socially alienated are more likely to engage in PD. Similarly, Hanson (Reference Hanson1994) reported that compared to younger adults, PD in an older population disproportionally involved more isolated persons. In another inquiry, when the level of exposure and drinking reactivity to various types of social stressors was investigated, PD men and women were found to encounter significantly more stressful social situations (e.g., conflicts), and coped with them through a higher consumption of alcohol compared to those with nPD (Lemke et al., Reference Lemke, Schutte, Brennan and Moss2008). Although it is tempting to explain PD in the group as a product of strained social relationships, the evidence does not allow us to do so. This is because the PD profile was shared with those who did not report PD.
An equal prevalence of PD (30.8%) was found in another two distinctive PD groups of men. We focus here on one group whose peculiarity resides in its large size of 81 men aged 79 years and younger. To begin with, the fact that loneliness entered the model for men runs counter to expectations based on empirical evidence, according to which in population studies older women tend to report loneliness at higher rates than men (38% vs. 12%) (Theeke, Reference Theeke2010). The most likely explanation for this unusual finding is that our study investigated personal circumstances and in the context of alcohol use. Accounting for the widely recognised link between physical health problems and loneliness (Theeke, Reference Theeke2010; Victor & Yang, Reference Victor and Yang2012), the constellation of factors in the profile of PD men seems highly meaningful. In general, this finding supported previous research (Immonen et al., Reference Immonen, Valvanne and Pitkälä2011; Wadd, Lapworth, Sullivan, Forrester, & Galvani, Reference Wadd, Lapworth, Sullivan, Forrester and Galvani2011), which implicated loneliness as one important precursor contributing to the inception of drinking problems. However, the profile of this group of men was incomplete, which suggests that there are other factors, yet to be identified, related to PD in the group.
Nonproblem versus Problem Drinking Profiles: Within Group Differences
Although the CHAID model correctly classified overall approximately 82 per cent of the PD and nPD individuals, the PD profiles were much less clear because they were shared with nPD at an approximate ratio of 1:3 for women and 1:2 for men. This imperfection of PD profiles in particular indicates at least two possibilities. First, additional factors not covered in our research would likely better discriminate between PD and nPD. Among other factors, this may include information on drinking history, severity of PD, severity of depression, coping strategies, and/or exposure to social influences specifically related to drinking behaviour (e.g., social learning) as indicated elsewhere (Akers, La, Cochran, & Sellers, Reference Akers, La, Cochran and Sellers1989; Brennan et al., Reference Brennan, Schutte and Moos2010; Moos, Brennan, Fondacaro, & Moos, Reference Moos, Brennan, Fondacaro and Moos1990). Second, partially echoing Vaillant (Reference Vaillant1995), interactive effects of the socio-cultural context (e.g., permissive towards drinking or valuing abstinence), individual characteristics (e.g., genetic endowment, health, or gender) will always determine where the line is drawn separating the absence from presence of alcohol-related harm. For example, men tend to deny or play down problems resulting from drinking (Homila & Raitasalo, Reference Homila and Raitasalo2005).
Health Protective Behaviour: Desistance from PD
The case of “drinking behaviour change” deserves closer attention for two reasons. First, it is the only common factor influencing drinking outcomes in both women and men. Second, in our study on the reduction of drinking, a clearly health-protective behaviour appeared ineffective in cessation of PD for some individuals. The answer may be found in longitudinal multi-wave research investigating drinking trajectories with a particular focus on remission from PD (Schutte et al., Reference Schutte, Moos and Brennan2006; Schutte, Byrne, Brennan, & Moos, Reference Schutte, Byrne, Brennan and Moos2001; Vaillant, Reference Vaillant1995). One issue of interest relates to relapse into PD, especially if a person continues to drink (a “nonabstinent remitter”) (Schutte, Brennan, & Moos, Reference Schutte, Brennan and Moos2009). According to Vaillant (Reference Vaillant1995), drawing upon an analogy of cancer remission, PD resolution may be considered successful after at least five years of abstinence or reduction. In our study, however, the resolution period of one year might not have been long enough for some individuals who may have relapsed into PD within that time frame. The fact that desistance through reduction of, but not outright abstinence from, alcohol does not necessarily lead to problem-free drinking has also been documented elsewhere (Schutte et al., Reference Schutte, Byrne, Brennan and Moos2001; Schutte et al., Reference Schutte, Moos and Brennan2006). For example, between 14 per cent and 50 per cent of naturally achieved abstinence (or nPD) is maintained for a minimum of six months (Walters, Reference Walters2000). Thus, our finding in its own right may clearly be an area of theoretical importance and warrant further research within general populations, whether or not that includes individuals with clinically diagnosed alcohol use disorder.
Strengths
This article is somewhat novel in demonstrating through the tree-building method that the sources of experiencing problem or non-problem drinking are highly variable and stem from a diverse set of intertwined conditions in the lives of alcohol consumers. Such detailed information would not be available simply by applying, for instance, a regression modeling method in which an independent variable is seen to uniformly influence outcome across whole populations, unless particular interactions with other variables were included. We believe that incorporating dimensions of QoL in exploring the type and relevance of various factors on alcohol outcomes in the general population further adds to the strength of this study. This is because, first of all, previous research has been dominated by investigating QoL in clinical settings as an outcome measure of efficacy of alcohol interventions. Second, when the association of QoL to alcohol use in the general population was studied, only one global question about QoL was used, hence any possible relations with its dimensions were obscured. Moreover, using the DPI scores as the criterion variable has the advantage over commonly used research measures of drinking pattern which can only serve as a crude approximation to drinking outcomes.
Limitations
Although the study sample was sufficiently large to allow detection of meaningful constellations of many variables related to drinking outcomes studied in combination, the relatively low participation rate (32%) challenges the study validity in terms of possible response bias. Because of ethical considerations, information on non-respondents (e.g., their health status) was not possible to access, nor was it possible to detect whether nonresponse was linked to the survey variables. For example, teetotalers (in our sample, more women than men) and heavy alcohol consumers tend to be reluctant to respond to a survey related to alcohol use (perhaps through lack of interest; embarrassment) (Groves & Peytcheva, Reference Groves and Peytcheva2008). However, although impossible for us to determine here, “most studies have found little evidence for substantial bias as a result of nonparticipation” (Galea & Tracy, Reference Galea and Tracy2007, p. 647).
Based on census data, our study sample does not fully reflect the ratio of men to women in the target population. Had we chosen a post hoc sample size manipulation approach (e.g., weighting) to pursue, for instance, the true distribution of gender groups of the Sør-Trøndelag county, the rate of problem drinking in our resulting sample would likely decrease, and this is not likely to undermine our findings. Notably, in our study the interactions between gender and type of independent variables were in line with previous alcohol research using samples of older adults. Moreover, it is not necessary to have “weighted” (adding women, removing men) samples to test interactions. In our methodological approach, rather, it is essential to have a sufficiently large sample to detect the interaction effects for the explorative goal of our study. We are therefore confident that our final sample allows for a valid exploration of the issues of PD in an older population.
Conclusions and Future Directions
The results of the present study clearly demonstrated gender-related differences in personal and contextual factors, which influenced the outcomes of drinking behaviour. For women, the most notable were factors related to the intrapsychic domain. For men, the influences of physical health status and interpersonal functioning were most prominent. However, these relationships were not clear-cut and occurred in a nonlinear fashion linking such domains as biology (sex, age, health), psychology (mental functioning operations), environment (social relations), and behavioural choice (drinking reduction), and suggesting that neither endogenous nor exogenous factors by themselves are exclusive determinants of outcomes related to the use of alcohol in older people. In addition, our findings indicated not only that the type of personal and environmental factors regarding drinking outcomes can vary between and within (sub)groups of (non)problem drinkers, but also that there are other important variables related to QoL circumstances specific to the concerns of certain individuals (e.g., psychosocial needs).
Whether or not drinking leads to negative consequences seems to depend on an interaction between the characteristics of the drinker, the specific nature of the person’s context, and the role of pharmacological effects of alcohol itself (National Collaborating Centre for Mental Health, 2011). This assertion is not new and may even seem trivial, but it is intriguing to consider how many well-conducted studies (outside the epidemiological arena) have arrived at similar conclusions yet do not seem to influence the public health model which asserts that preventive interventions of alcohol-related problems should target all drinkers using general measures (Lemmens, Reference Lemmens, Heather, Peters and Stockwell2001). In that view, individual differences in risk factors for PD would be neglected. The “one size fits all” approach would unlikely be effective for all drinkers. A more concerted and individually focused effort to mitigate alcohol-related harm may ultimately be preferable to the existing practice of “throwing everything imaginable at the target population in the hope that something will reduce the risk factors of concern” (Peterson & Stunkard, Reference Peterson and Stunkard1989, p. 824). Therefore, we underscore the importance of recognising the individual in his/her situation through attention to, and consideration by, human service providers of risk factors related to PD that can guide identification, and thereby provide comprehensive assistance to those who are vulnerable to experiencing PD. According to the CHAID model, interventions specific to the person’s life circumstances through ongoing quality-of-life assessments could be very important in this respect.
Finally, following the evidence from our own and previous studies, the gender-related differences in factors associated with problem and non-problem drinking appeared to be so strong that future empirical explorations of drinking outcomes should seriously consider including gender analysis in their scientific approaches. Adjusting for gender differences may also be helpful in designing and delivering effective human services to those who are troubled by the unwanted consequences that alcohol use can create. A fact deserving attention is that drinking “problem recognition usually occurs early in problem development, but seeking help is a late event” (Tucker & Simpson, Reference Tucker and Simpson2011, p. 375). For some, seeking help may be the only option enabling desistance from alcohol and the harm it may cause. However, stigma, embarrassment, or misunderstandings may further compound the problems related to drinking at the individual as well as societal level. In this vein, studies exploring barriers to help-seeking behaviour may be an important endeavour with implications for health policy initiatives and may be of practical use for service planners. Moreover, gender-specific responsivity to advice (when appropriate) on drinking behaviour, notwithstanding communication channels of information on alcohol use, may also be an interesting area meriting further study.
Supplementary Materials
To view supplementary material for this article, please visit http://dx.doi.org/10.1017/S0714980819000837.


 Open access