This discussion relates to the paper presented by Kelly Hurren and Andrew Kemp at the IFoA sessional event held on 24 January 2023.
The Moderator (Mrs K. S. Hurren, F.I.A.): I am Kelly Hurren, a member of the IFoA’s Pensions Research sub-committee. Alongside Andrew Kemp, I am the co-leader of research into public attitudes towards the Pensions Freedoms. I am also a Partner and Head of Member Options at Aon.
The panellists are:
Andrew Kemp – the chair of the IFoA’s Personal Financial Planning Working Party, and co-leader of research into public attitudes towards the Pensions Freedoms;
Sarah Luheshi – Deputy Director at the Pensions Policy Institute;
Joe Dabrowski – Deputy Director of Policy at the Pensions and Lifetime Savings Association (PLSA).
Mr A. M. Kemp, A.I.A.: In December 2020, our working party decided to revisit the research into public attitudes towards Pensions Freedoms that the IFoA undertook in 2016. We wanted to draw some comparisons between the two surveys. In particular, we were interested in whether anyone had any regrets relating to their decisions, whether people were getting advice or guidance, and whether people were aware of the changes. A wider objective was to consider how the pensions industry should address any key observations. Since completing our research, the UK and the rest of the world have experienced a number of challenges, including a significant rise in the cost-of-living. This has led to workers making some very important decisions about the affordability of continuing to save. Our research does not explore those particular aspects, but they will feature in our discussion.
In 2015, the Pensions Freedoms were introduced. A number of relatively subtle changes appeared in 2014, but from 2015 onwards DC savers were given unrestricted access to their savings. For example, they were granted the ability to take uncrystallised fund pension lump sums without needing to designate funds into drawdown. A DC pension pot is a form of discretionary trust, and from this point onwards it could continue in perpetuity. This is interesting as you could potentially have an infinitely lasting, tax-efficient legacy and pending future legislative changes.
Between 28 and 31 January 2022, YouGov conducted our survey with a sample of 185,000 residents in Great Britain, targeted at those aged over 55. Responses were received from 2,065 individuals (Figure 1).
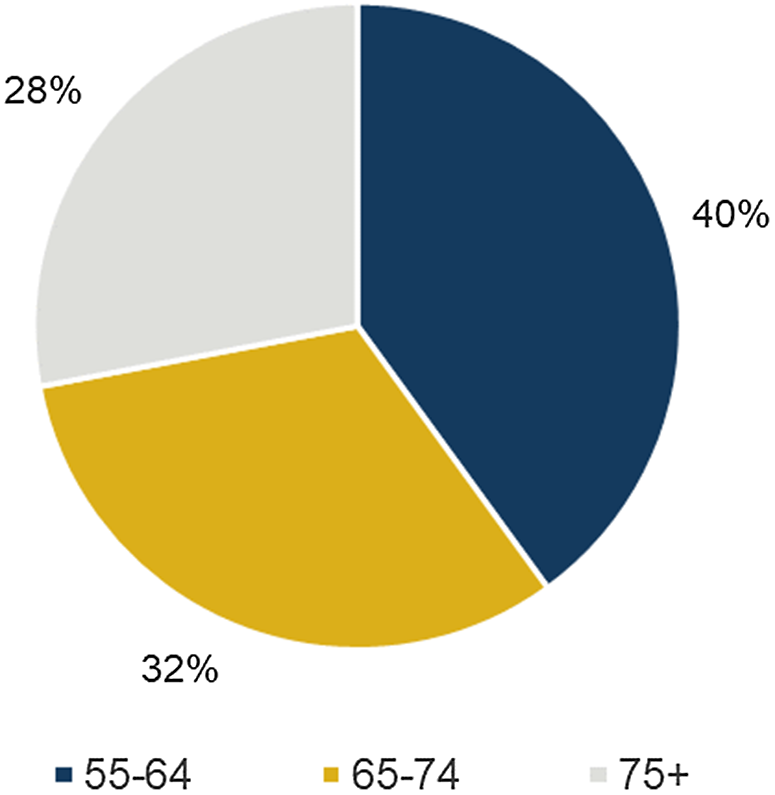
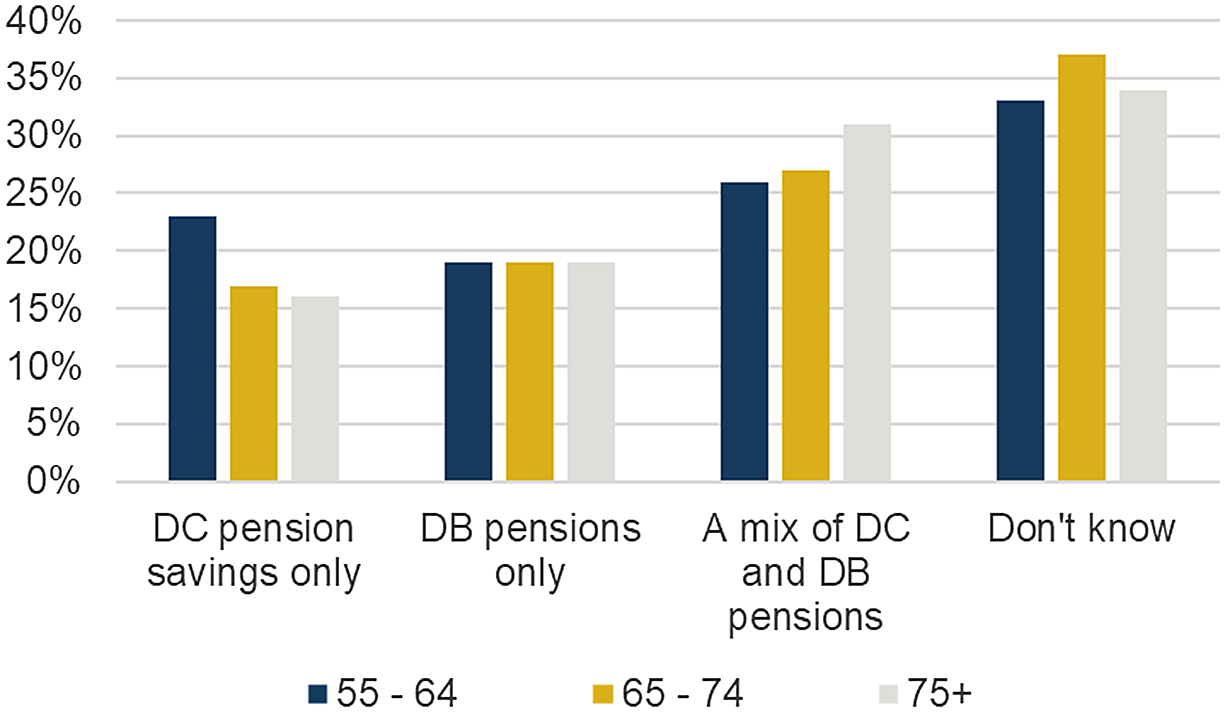
Figure 2 shows that we saw a fairly balanced mix across the different age ranges. It was helpful to see a higher weighting in the lower age brackets, as these people are more likely to have accessed their pensions since 2015. As well as age, gender and class, the respondents were split by a range of demographics including health, region of Great Britain, cohabitation status and recent voting preferences. The regional splits were, broadly speaking, 10% for London, 10% for Scotland, 35% for the rest of the South, 20% for the Midlands and Wales and 25% for the North. In terms of voting preferences, nearly two-thirds voted Conservative in the last general election and around 60% voted to remain in the EU referendum. The respondents had a reasonable spread across different types and combinations of pension benefits balanced across the different age brackets, as you can see in Figure 3.
Figure 1. Responses to the 2022 survey.
Figure 2. Responses to the 2022 survey split by age range.
Figure 3. Types of pension savings split by age.
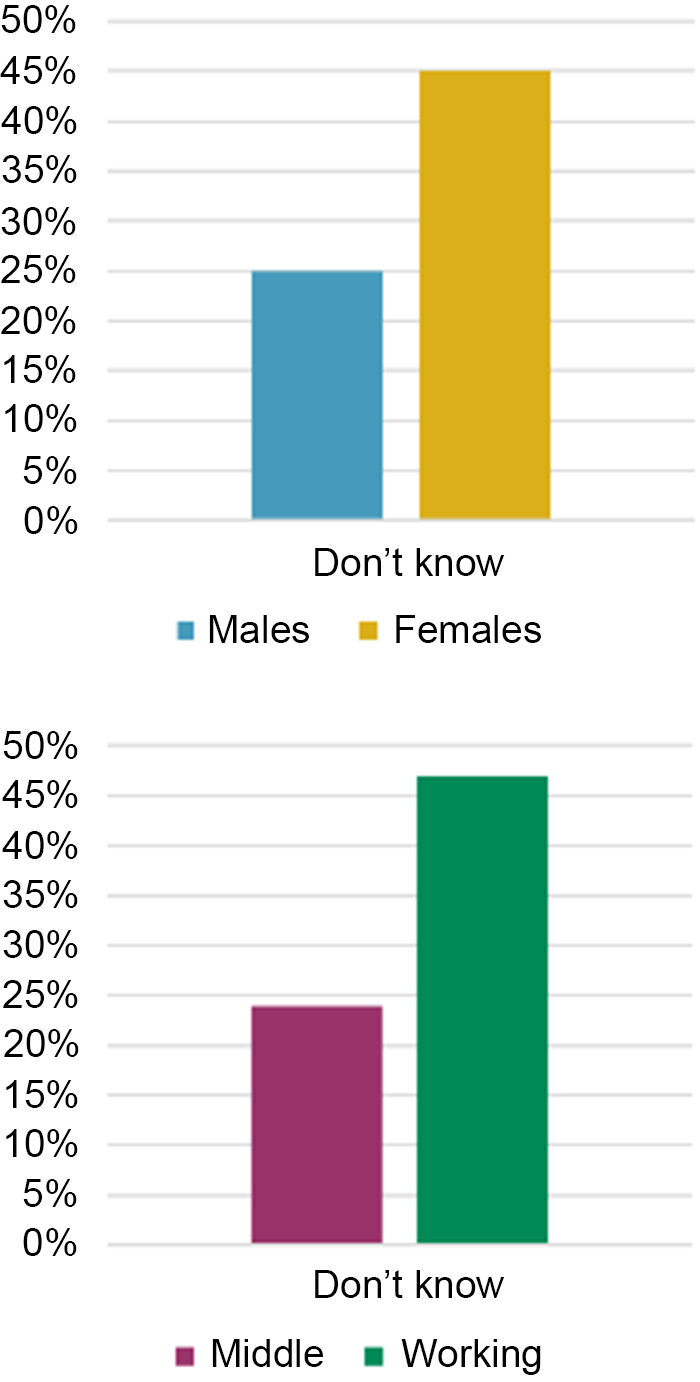
Around a fifth of respondents had accessed their pensions since 2015. The remaining respondents had either not accessed their pensions at all or did not have any pensions left to take. Around a third of all respondents didn’t know what type of pension they had, if any. Within the ‘don’t know’ category there are stark differences between the genders and classes (Figure 4).
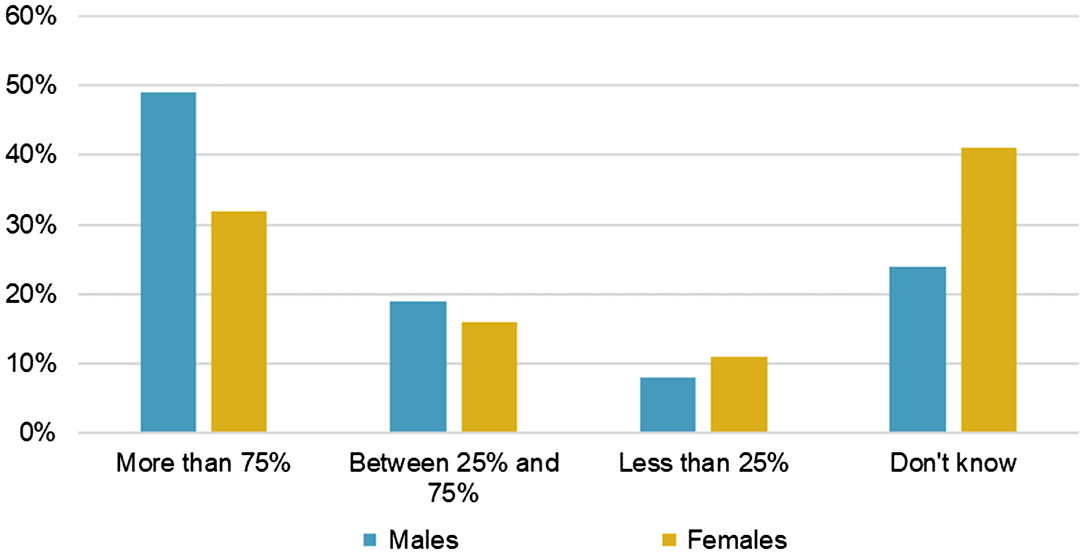
Figure 5 shows that around half of respondents were aware of the Pensions Freedoms that were introduced in 2015. Just under a sixth had vague awareness, and the rest (just over a third) had no idea.
Figure 4. Types of pension savings – ‘don’t know’ category.
Figure 5. Awareness of Pensions Freedoms from 2022 survey.
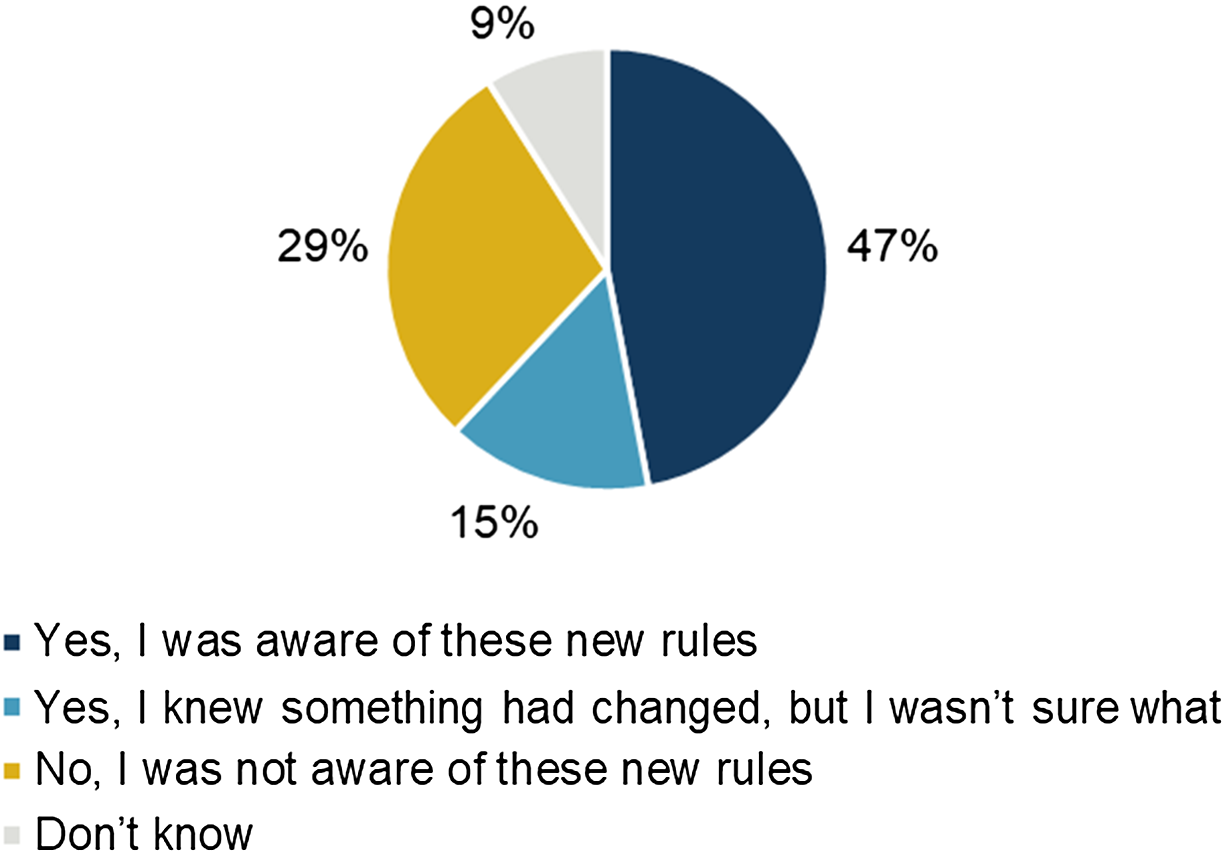
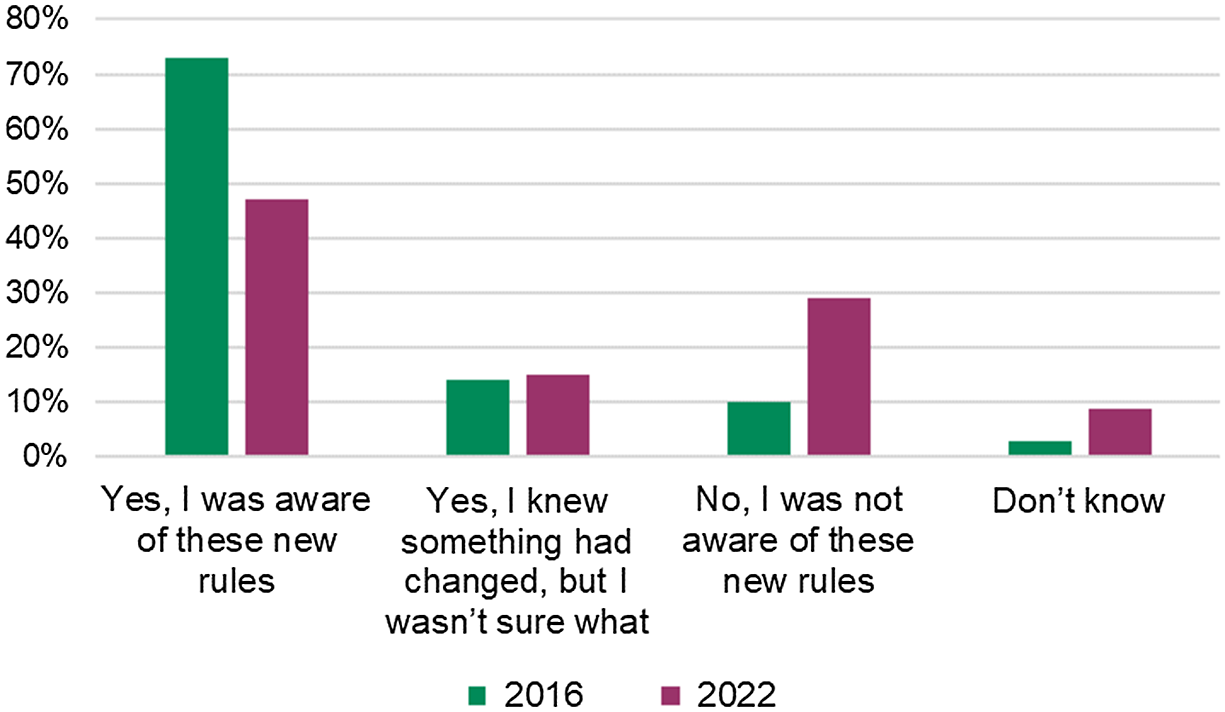
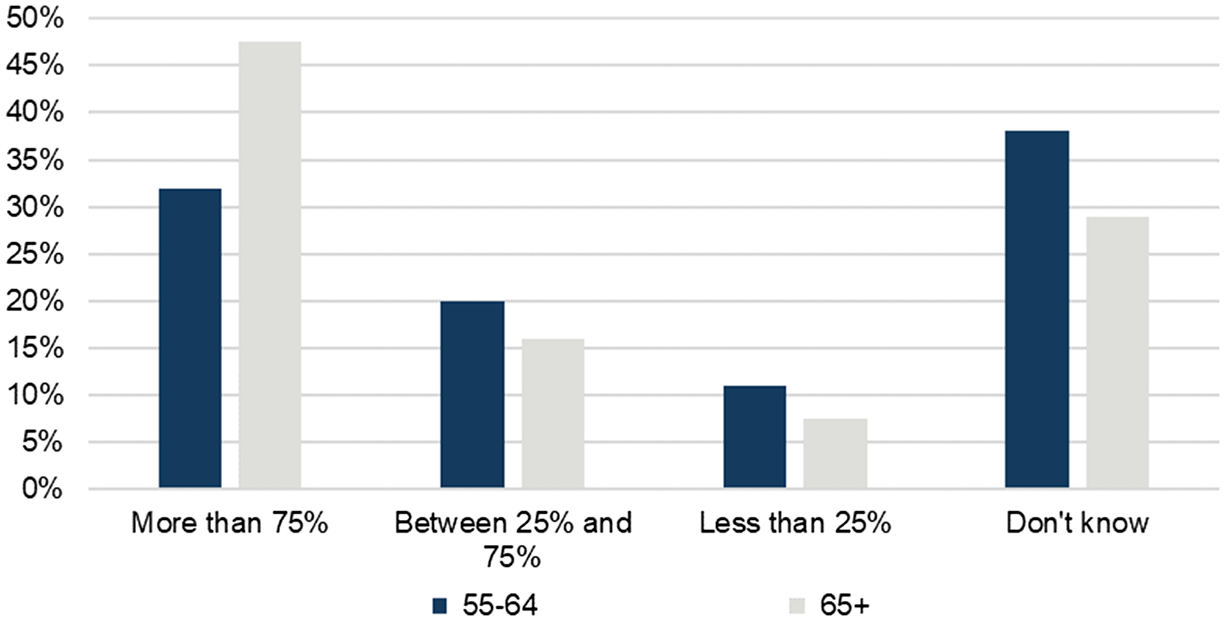
As you might expect, there were some very real differences when you compare the responses between the different age groups. The 55–64-year-olds were materially more aware compared to those in the over-75 group with a difference of about 20%. Perhaps the ‘wake-up’ packs are having some impact here. To be able to compare the results with the 2016 survey, we kept a number of the questions consistent. Figure 6 presents the results for one of these questions and the responses demonstrated a significant reduction in awareness since 2015.
Figure 6. Awareness of Pensions Freedoms from 2022 and 2016 surveys.
Those who were aware of the changes were also asked whether the reforms were a good thing or a bad thing. Just over half of the respondents saw the Freedoms as a good thing, and this was much higher than in the 2016 survey. There was an equivalent fall in those who felt it was a bad idea from around 30% to 15%. We did not see any standout differences between genders or classes. There was a large proportion who felt indifferent, potentially those with only defined benefits or state pensions, who were not impacted by the Freedoms.
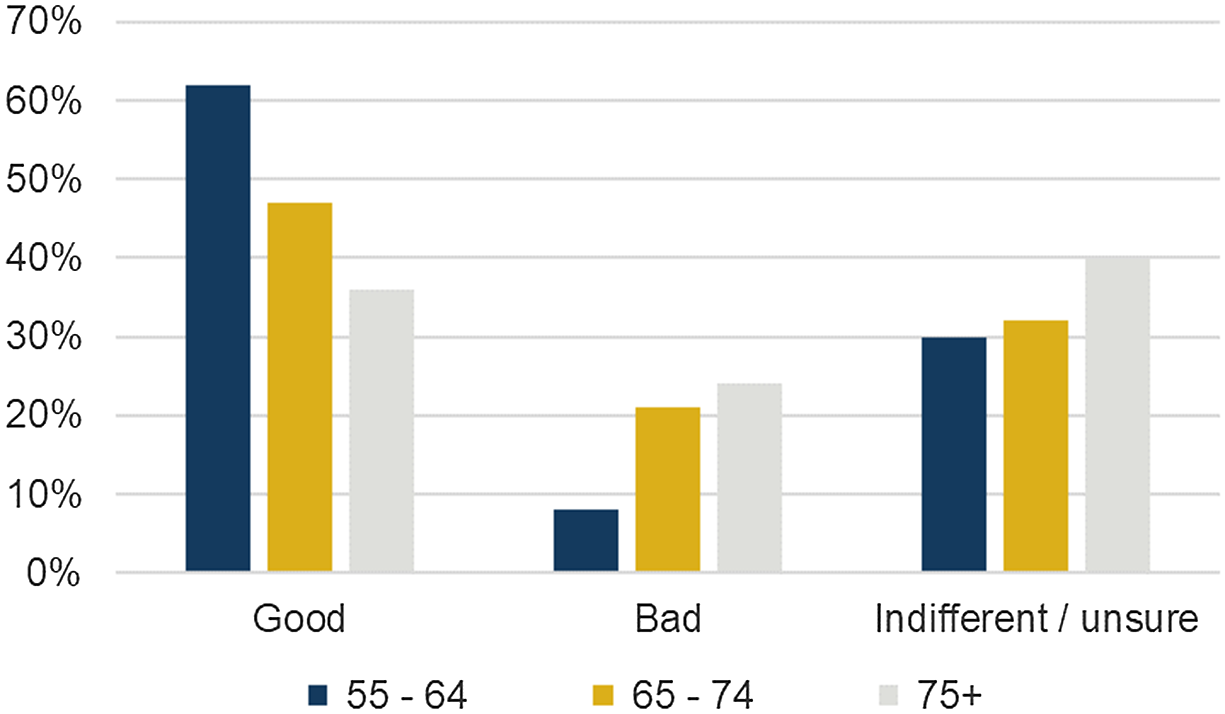
There was a noticeable difference in the age brackets, as you can see in Figure 7. The younger respondents were most likely to think the Freedoms were a good thing.
Figure 7. Perceptions of Pensions Freedoms from 2022 survey split by age.
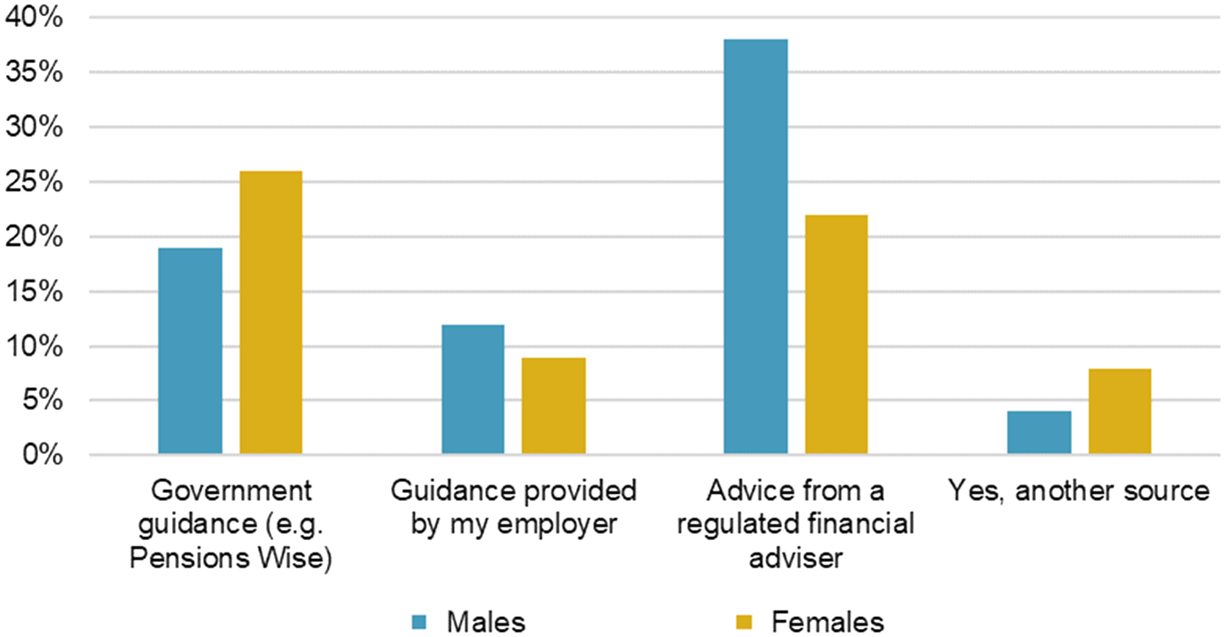
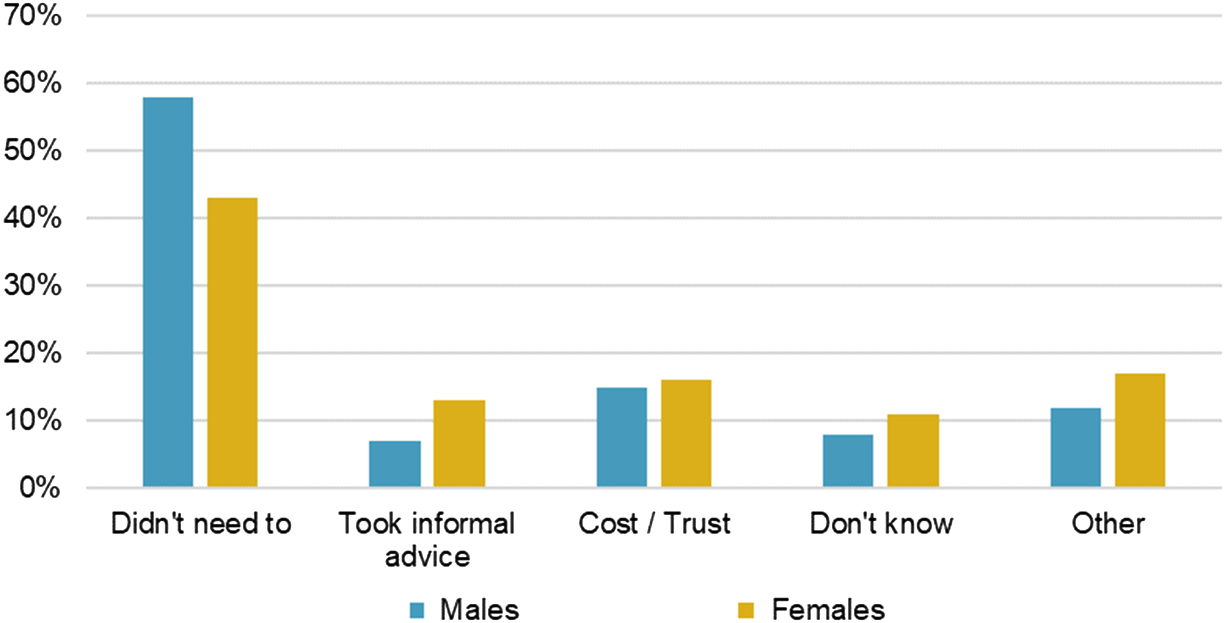
When it comes to reviewing pension savings, accessing DC or deciding whether to keep or transfer out of DB, we wanted to understand how many people were getting advice, noting that those with cash equivalent transfer values over £30,000 must take regulated advice. Figure 8 shows how respondents accessed help or advice, and Figure 9 shows the reasons why one-third did not.
Figure 8. Sources of guidance, split by gender.
Figure 9. Why respondents didn’t access advice or guidance split by gender.
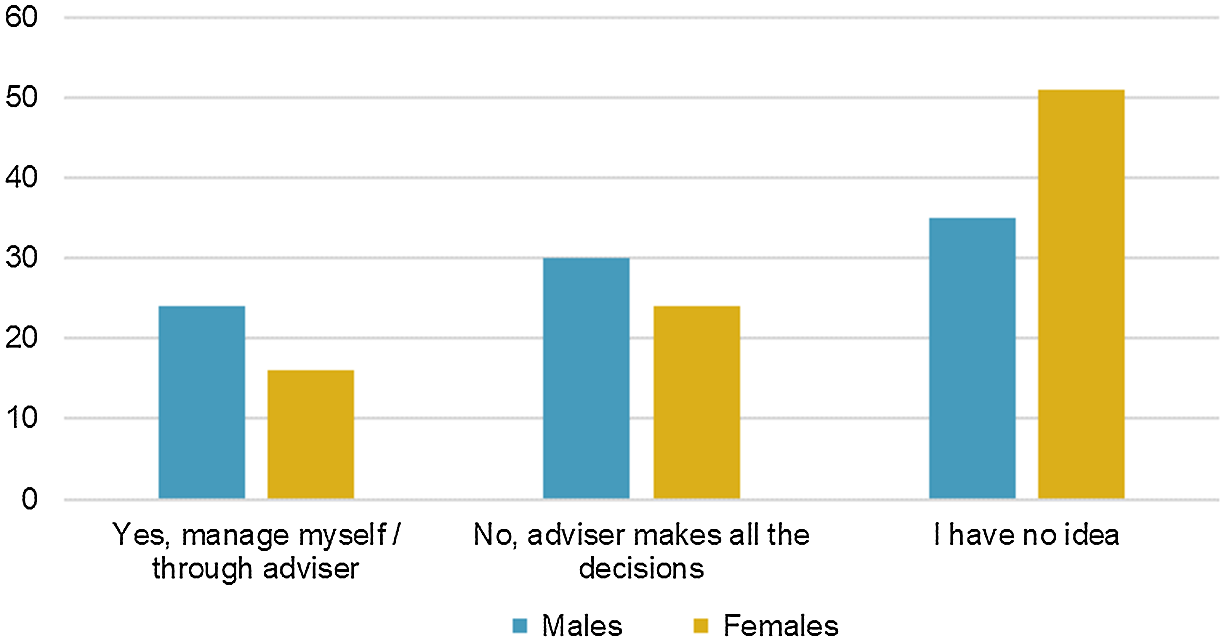
Men were much more likely to take regulated advice, but at the same time were also more likely to say that they did not need any advice or guidance. Women were more likely to access guidance from generic sources, such as Pension Wise. 40% of all respondents did not seek any kind of formal advice or guidance. We did not see any significant differences in the demographics of these respondents. As you might expect, the main barriers were cost and knowing how to find an advisor they felt they could trust. Some examples of what people said under ‘other’ are: company information was comprehensive alongside their own knowledge; they were an ex-financial advisor or worked in financial services; they were happy with their own judgement. There may be some themes of over-confidence. We felt that, in the current environment, it is more important than ever for people to access some form of support, and for the pension industry to help with this process.
When we were designing the questionnaire, we wanted to explore a number of different areas without any specific bias. We asked respondents how much of their future regular expenditure they expected to be met from their pension savings. We wanted to see how well people were planning. Around a third did not know. This is worrying because it indicates that either they had not planned how much they were going to spend, or they did not know what level of income their pension could provide. This is consistent with the proportion who did not know what type of pension they had. The split in results across different classes almost exactly mirrors the gender splits seen in Figure 10.
Figure 10. Regular expenditure expected to be met from pension savings, split by gender.
Figure 11 shows the differences between the age brackets. The results for those aged 65 to 74 were broadly consistent with those for the over-75 age bracket, so we grouped them together. In summary, those who have planned and are aware of what pension savings they have, predominantly females and younger respondents, expect their pension savings to cover a significantly lower proportion of their expenditure compared to males and older respondents. This implies that women and younger respondents were less likely to have planned or didn’t know what they had, compared to men and older respondents. Either way, it perhaps reflects the pensions gender gap and the shift from DB to DC workplace pensions.
Figure 11. Regular expenditure expected to be met from pension savings, split by age.
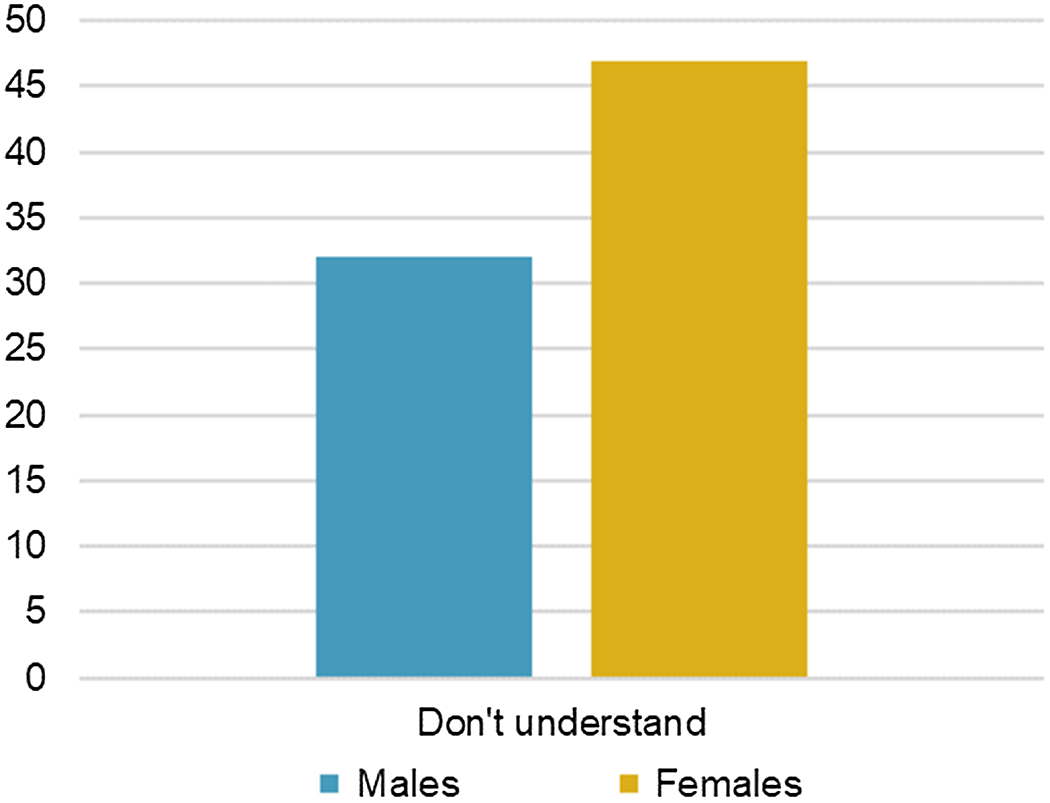
The last two questions of the survey looked at two specific aspects of DC pensions. When asked ‘To what extent do you feel you understand all the charges you are paying on DC pensions?’, just over 60% felt they had an understanding, but almost 40% did not understand. The split between males and females is significant, as shown in Figure 12.
Figure 12. To what extent do you feel you understand all the charges you are paying on DC pensions?
When asked if they know what their DC pensions are invested in, 10% said ‘Currently 100% in cash’. That was broadly consistent across the demographics. Worryingly, 70% of respondents did not know what they were invested in Figure 13.
Just under 30% said, ‘No, but I have an advisor’. In this case, I would question what the advisor is doing, if the individual does not know what they are invested in. Recently, we have seen that lifestyle arrangements, which have been switching investments to cash and gilts as a default, have not worked out so well; unless the individual has taken the traditional approach of maximum cash and an annuity, in which case they have been hedged correctly, assuming perfect timing.
We were also interested in finding out if there was any regret relating to the decisions that had been made. When asked ‘If you could go back to when you accessed your pensions, would you have done anything differently?’ it was very encouraging that 71% said ‘No’. Nearly 10% said they would have planned their retirement earlier to better understand their options. Intriguingly, this was more significant for those in the 65 to 74 age bracket.
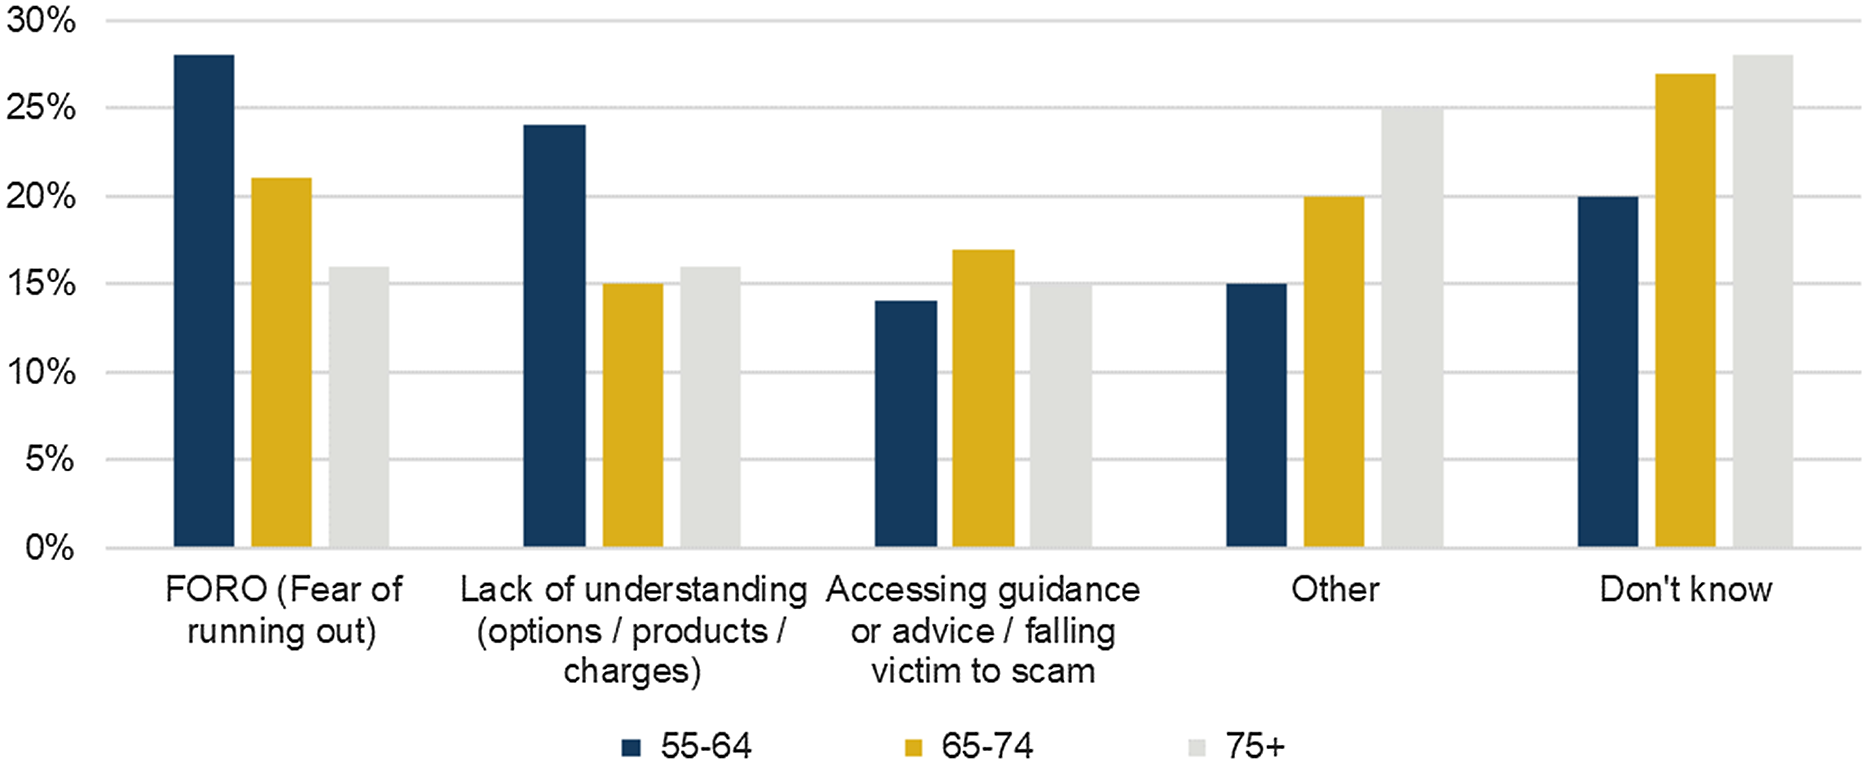
Finally, we asked respondents about their biggest worry or challenge when planning retirement. The responses are shown in Figure 14.
Figure 13. Regular expenditure expected to be met from pension savings, split by age.
Figure 14. Biggest challenges or worries when planning retirement.
Males and females answered reasonably consistently, but the age group responses perhaps contradict the responses to the earlier questions. The younger groups have a higher fear of running out and admit to a greater lack of understanding, while at the same time, they felt the Freedoms were a good thing.
Other responses to this question had themes around inflation, having enough to meet their living standards, poor annuity rates, lack of planning, dying before they get to enjoy it, the Government moving the goal posts with respect to State pension age, adviser costs and the Government changing taxes and pension rules.
Moderator: Around a third of respondents did not know about the Pensions Freedoms and 25% of those aged 55–64 say that their biggest worry with retirement is running out of money. How do you think we can improve that?
Mr J. Dabrowski: Sadly, it is not too surprising to me that a large proportion of people are not aware of their pension details, the Pensions Freedoms or some of the other choices that they might have. We know that people typically tend not to pay a great deal of attention to their pension until they come close to retirement, and that can leave some people in a difficult place if they have not been saving enough. It also means that people potentially make poor choices when they get to retirement. That is one of the reasons for the interventions around the Investment Pathways, for example, to discourage people from taking out all of their pension money, putting it in the bank and forgetting about it. We have to try to tackle this. It is quite a difficult issue, given the philosophical move that we have made in pension savings. We have moved towards inertia and a lot of the system is built around that. Encouraging people to be active at the right time is an interesting challenge, but one where we need to improve. There are a number of things that can be done. The Pensions Dashboard will help people to see all of their pensions in one place. How well they understand that information is a separate question. The PLSA’s Retirement Living Standards are intended to help people get an easy-to-grasp sense of what they need for their income in retirement. There are lots of other things, the pension attention campaign for example, which focused on trying to engage people. From the data we saw, the campaign worked fairly well in year one and we need to keep building on that for year two. Financial education through schools and employers is a silver bullet that we talk about, but whether this will truly make a difference is hard to say.
The free guidance available from MaPS is helpful. We know that people who use the service really like it, but not all those who are eligible choose to use it. We need to address some of the challenges around the financial advice and guidance boundary, which we know is tough for people to understand. People often want things to happen automatically. The jargon is difficult, complex and technical, so we should simplify the language as much as possible. We also need more product innovation and support for people with regard to decumulation.
It was interesting to see the ongoing gender bias in those surveys. For example, men won’t say that they do not know anything and are over-confident in what they do know. Maybe we need to tackle that too.
Moderator: Everything that you are talking about there, Joe (Dabrowski), is around engagement and improving engagement. Sarah (Luheshi), what do we really mean by engagement and how do we measure it?
Ms S. Luheshi: We want to ensure that people have a full understanding of their pension arrangements. I get frustrated when the solution to more engagement is just sending more communications. That is not addressing the underlying issue, which is a lack of willingness to engage, or a lack of financial capability to do so. It would be helpful if we had a definition of engagement and a way to measure it. The number of people who access the website and the time they spend doing so is a potential measure, but that might merely reflect the complexity of the website rather than representing effective engagement. We also need to consider why we are engaging people, and the outcome that we want. I agree that Dashboards will be a big step forward, but I am not confident we know what we want people to do with that information.
We want to see what can be learned from countries with more experience in DC pensions, such as Australia and Chile. We are also looking for examples of what doesn’t work in terms of trying to improve engagement. Sweden did a huge push to get people more engaged in their investment choices at the point in time just before the market collapsed. They did no follow-up communication or engagement to help people understand why the market collapse had happened and what they could do at that point. As Joe (Dabrowski) pointed out, we need to ensure that people can find the necessary information.
Moderator: You and Joe (Dabrowski) have raised lots of great points. In particular the comment about the number of clicks on a website not being a great measure of engagement. I do agree with your point about the Pensions Dashboard. I think that will be a great way for people to start to learn about the pensions they have, but it is important for people to understand the limitations of the Dashboard.
Andrew (Kemp), in your role as a paraplanner for a financial advice firm, you see the impact of some of this lack of understanding. In the current environment, where the cost-of-living is big factor in people’s minds, are you seeing any differences in the behaviour of people coming to you for advice?
Mr Kemp: I see varying levels of understanding. Pensions are a very broad subject and potentially very complex in terms of financial planning, so this is not a surprise. Generally speaking, our clients have a reasonable understanding of the basics and tend to come to us when there is a particularly technical issue or perhaps a lack of understanding about how death benefits work. In terms of behavioural changes, we tend to see people shifting towards drawing more from non-pension sources first.
In the current climate, there is a greater than usual-focus on investment performance in the short term. The answer there is to try to coach behaviours and shift focus from the past to the future, considering the things that are within the client’s control. For example, perhaps a client has planned a large or one-off capital withdrawal from their long-term savings, and we might see them delaying these or perhaps phasing them in.
Similarly, another client is looking at postponing their retirement until later in the year because of a concern about starting unsecured income withdrawals at a point when the market has dipped. Some other clients are looking at whether or not they should be paying back their mortgages sooner, rather than making pension contributions. In a low-interest-rate environment, where higher-rate income tax relief is available, making pension contributions is normally an obvious win, but now it is less obvious, particularly with the volatility and uncertainty in interest rates. It is important to bear in mind that the cohort being advised is generally a little bit insulated from the cost-of-living challenges. They are more concerned with how much they can put into pension savings.
One client asked us to review his current workplace arrangement, in terms of the level of contributions and the investment strategy. The default fund was a lifestyle arrangement targeting drawdown, but that particular arrangement did not offer drawdown. The investments were rated low to medium risk while still 20 years from retirement, so perhaps the trustees were being a little too cautious. Those are some examples of why people might be coming to us.
Moderator: While default funds are useful, it is important for people to ensure they are appropriate for their circumstances.
Now we move to the question-and-answer session.
Question: Does the PLSA have any statistics about the impact of the Pay Your Pension Some Attention campaign? Secondly, the DWP (Department for Work and Pensions) appears to be favouring the self-service Pensions Dashboard over the Pension Wise service, which involves discussing your situation with a guidance specialist. Do the panel members have any views on that?
Mr Dabrowski: In relation to the Pay Your Pension Some Attention campaign, we saw that people were prompted to have a conversation with their friends and their family, to check their pensions and perhaps to make enquiries with their scheme. Overall, it was very positive and we are hoping for further success in the next campaign.
19% of people recalled the campaign, so that’s 7.9 million adults. We inspired 2.65 million employees to pay their pensions some attention. In total, 91% of the 19% of people who fully recalled everything had taken some action on their pension. We had close to 13 million advertising impressions and over 150 wider pieces of media coverage, as well as a lot of support from parliamentarians and the industry as a whole.
Ms Luheshi: The Pensions Dashboard and Pension Wise both come under the remit of MaPS (Money and Pensions Service), but their aims differ. The Dashboard is in the news at the moment, but Pension Wise is getting a lot of promotion. I do not believe there is any bias from the Government between these two services.
Question: Dashboards might reveal how little some people have saved for retirement?
Ms Luheshi: The PLSA’s Retirement Living Standards aim to help people plan how much they need to save for retirement.
Question: The survey indicated that 40% of people do not seek any kind of guidance or advice with their retirement planning, and only one-third of the respondents took formal regulated advice. How can the industry make such guidance and advice more accessible?
Mr Dabrowski: People are often ill-informed and nervous about taking advice. They think ‘Where do I go to get this? Do I want to ask the question? How much is it going to cost me?’ Then, you have the concerns that were highlighted by the survey: ‘How do I find somebody that I can trust? It looks really expensive.’ Even if it represents a small percentage of the DC fund, paying several thousand pounds for advice can seem a lot, especially for those who think they could do it themselves, and who may be overconfident. We need to encourage people to anticipate the potential need for financial planning. We need free financial tools to be available, whether that’s through MaPS’s MoneyHelper service, or the support frequently provided by employers and schemes.
I expect an increased use of fintech advice for those with simpler products or needs. We also need to ensure that people get value for money. One of the surprises from the Retail Distribution Review (RDR) a few years ago was that even people with relatively large DC pots of over £100,000 were not taking advice and were put off by some of these issues. Also, the boundary between advice and guidance can be hard to understand, and I know that the Treasury and FCA are open to looking into this further.
Good product design can help, through the use of a default decumulation solution for those who want an easy option implemented for them.
Question: How do you see product innovation developing, such as in the use of collective DC schemes?
Mr Dabrowski: I think the Government is looking at the potential role of collective DC schemes in decumulation. There is currently a lot of innovation in the market to help facilitate the transition from accumulation to decumulation, such as from the bigger master trusts. One of the reasons for our guided retirement income choices was to have both governance and product design thresholds. If we can establish what ‘good’ looks like, probably on a statutory footing, we could avoid some of the problems that we have seen. For example, the Master Trust authorisation regime was introduced 5 years after the master trusts were operational.
Question: There is a conflict between the short-termism of HM Treasury and the long-term nature of pensions. How can this be resolved?
Ms Luheshi: It would be great if we had a long-term and cohesive plan. Short-term tinkering with tax rules erodes trust and knowledge, as revealed by the survey results, so some stability would be welcomed. Guy Opperman was in post longer than Sir Steve Webb. Let’s hope that Laura Trott remains in post for some time.
Question: Did the survey test what people actually knew rather than what they thought they knew?
Mr Kemp: No. We did consider following up with an interview but decided not to. We did establish that 21% of respondents (about 400 people) had accessed their pensions under the new regime, which implies a level of understanding.
Moderator: To summarise, I think what we have seen today is that freedom and choice are valued by people approaching retirement. However, there is a definite admission of a lack of understanding and awareness about how to get help. How does the pensions industry bridge that gap and help people to make the right decisions for their retirement? There are many current initiatives, but more can be done.


 This is an Open Access article, distributed under the terms of the Creative Commons Attribution licence (http://creativecommons.org/licenses/by/4.0/), which permits unrestricted re-use, distribution, and reproduction in any medium, provided the original work is properly cited.
 You have
Access
You have
Access
 Open access
This discussion relates to the paper presented by Kelly Hurren and Andrew Kemp at the IFoA sessional event held on 24 January 2023.
The Moderator (Mrs K. S. Hurren, F.I.A.): I am Kelly Hurren, a member of the IFoA’s Pensions Research sub-committee. Alongside Andrew Kemp, I am the co-leader of research into public attitudes towards the Pensions Freedoms. I am also a Partner and Head of Member Options at Aon.
The panellists are:
Andrew Kemp – the chair of the IFoA’s Personal Financial Planning Working Party, and co-leader of research into public attitudes towards the Pensions Freedoms;
Sarah Luheshi – Deputy Director at the Pensions Policy Institute;
Joe Dabrowski – Deputy Director of Policy at the Pensions and Lifetime Savings Association (PLSA).
Mr A. M. Kemp, A.I.A.: In December 2020, our working party decided to revisit the research into public attitudes towards Pensions Freedoms that the IFoA undertook in 2016. We wanted to draw some comparisons between the two surveys. In particular, we were interested in whether anyone had any regrets relating to their decisions, whether people were getting advice or guidance, and whether people were aware of the changes. A wider objective was to consider how the pensions industry should address any key observations. Since completing our research, the UK and the rest of the world have experienced a number of challenges, including a significant rise in the cost-of-living. This has led to workers making some very important decisions about the affordability of continuing to save. Our research does not explore those particular aspects, but they will feature in our discussion.
In 2015, the Pensions Freedoms were introduced. A number of relatively subtle changes appeared in 2014, but from 2015 onwards DC savers were given unrestricted access to their savings. For example, they were granted the ability to take uncrystallised fund pension lump sums without needing to designate funds into drawdown. A DC pension pot is a form of discretionary trust, and from this point onwards it could continue in perpetuity. This is interesting as you could potentially have an infinitely lasting, tax-efficient legacy and pending future legislative changes.
Between 28 and 31 January 2022, YouGov conducted our survey with a sample of 185,000 residents in Great Britain, targeted at those aged over 55. Responses were received from 2,065 individuals (Figure 1).
Figure 2 shows that we saw a fairly balanced mix across the different age ranges. It was helpful to see a higher weighting in the lower age brackets, as these people are more likely to have accessed their pensions since 2015. As well as age, gender and class, the respondents were split by a range of demographics including health, region of Great Britain, cohabitation status and recent voting preferences. The regional splits were, broadly speaking, 10% for London, 10% for Scotland, 35% for the rest of the South, 20% for the Midlands and Wales and 25% for the North. In terms of voting preferences, nearly two-thirds voted Conservative in the last general election and around 60% voted to remain in the EU referendum. The respondents had a reasonable spread across different types and combinations of pension benefits balanced across the different age brackets, as you can see in Figure 3.
Figure 1. Responses to the 2022 survey.
Figure 2. Responses to the 2022 survey split by age range.
Figure 3. Types of pension savings split by age.
Around a fifth of respondents had accessed their pensions since 2015. The remaining respondents had either not accessed their pensions at all or did not have any pensions left to take. Around a third of all respondents didn’t know what type of pension they had, if any. Within the ‘don’t know’ category there are stark differences between the genders and classes (Figure 4).
Figure 5 shows that around half of respondents were aware of the Pensions Freedoms that were introduced in 2015. Just under a sixth had vague awareness, and the rest (just over a third) had no idea.
Figure 4. Types of pension savings – ‘don’t know’ category.
Figure 5. Awareness of Pensions Freedoms from 2022 survey.
As you might expect, there were some very real differences when you compare the responses between the different age groups. The 55–64-year-olds were materially more aware compared to those in the over-75 group with a difference of about 20%. Perhaps the ‘wake-up’ packs are having some impact here. To be able to compare the results with the 2016 survey, we kept a number of the questions consistent. Figure 6 presents the results for one of these questions and the responses demonstrated a significant reduction in awareness since 2015.
Figure 6. Awareness of Pensions Freedoms from 2022 and 2016 surveys.
Those who were aware of the changes were also asked whether the reforms were a good thing or a bad thing. Just over half of the respondents saw the Freedoms as a good thing, and this was much higher than in the 2016 survey. There was an equivalent fall in those who felt it was a bad idea from around 30% to 15%. We did not see any standout differences between genders or classes. There was a large proportion who felt indifferent, potentially those with only defined benefits or state pensions, who were not impacted by the Freedoms.
There was a noticeable difference in the age brackets, as you can see in Figure 7. The younger respondents were most likely to think the Freedoms were a good thing.
Figure 7. Perceptions of Pensions Freedoms from 2022 survey split by age.
When it comes to reviewing pension savings, accessing DC or deciding whether to keep or transfer out of DB, we wanted to understand how many people were getting advice, noting that those with cash equivalent transfer values over £30,000 must take regulated advice. Figure 8 shows how respondents accessed help or advice, and Figure 9 shows the reasons why one-third did not.
Figure 8. Sources of guidance, split by gender.
Figure 9. Why respondents didn’t access advice or guidance split by gender.
Men were much more likely to take regulated advice, but at the same time were also more likely to say that they did not need any advice or guidance. Women were more likely to access guidance from generic sources, such as Pension Wise. 40% of all respondents did not seek any kind of formal advice or guidance. We did not see any significant differences in the demographics of these respondents. As you might expect, the main barriers were cost and knowing how to find an advisor they felt they could trust. Some examples of what people said under ‘other’ are: company information was comprehensive alongside their own knowledge; they were an ex-financial advisor or worked in financial services; they were happy with their own judgement. There may be some themes of over-confidence. We felt that, in the current environment, it is more important than ever for people to access some form of support, and for the pension industry to help with this process.
When we were designing the questionnaire, we wanted to explore a number of different areas without any specific bias. We asked respondents how much of their future regular expenditure they expected to be met from their pension savings. We wanted to see how well people were planning. Around a third did not know. This is worrying because it indicates that either they had not planned how much they were going to spend, or they did not know what level of income their pension could provide. This is consistent with the proportion who did not know what type of pension they had. The split in results across different classes almost exactly mirrors the gender splits seen in Figure 10.
Figure 10. Regular expenditure expected to be met from pension savings, split by gender.
Figure 11 shows the differences between the age brackets. The results for those aged 65 to 74 were broadly consistent with those for the over-75 age bracket, so we grouped them together. In summary, those who have planned and are aware of what pension savings they have, predominantly females and younger respondents, expect their pension savings to cover a significantly lower proportion of their expenditure compared to males and older respondents. This implies that women and younger respondents were less likely to have planned or didn’t know what they had, compared to men and older respondents. Either way, it perhaps reflects the pensions gender gap and the shift from DB to DC workplace pensions.
Figure 11. Regular expenditure expected to be met from pension savings, split by age.
The last two questions of the survey looked at two specific aspects of DC pensions. When asked ‘To what extent do you feel you understand all the charges you are paying on DC pensions?’, just over 60% felt they had an understanding, but almost 40% did not understand. The split between males and females is significant, as shown in Figure 12.
Figure 12. To what extent do you feel you understand all the charges you are paying on DC pensions?
When asked if they know what their DC pensions are invested in, 10% said ‘Currently 100% in cash’. That was broadly consistent across the demographics. Worryingly, 70% of respondents did not know what they were invested in Figure 13.
Just under 30% said, ‘No, but I have an advisor’. In this case, I would question what the advisor is doing, if the individual does not know what they are invested in. Recently, we have seen that lifestyle arrangements, which have been switching investments to cash and gilts as a default, have not worked out so well; unless the individual has taken the traditional approach of maximum cash and an annuity, in which case they have been hedged correctly, assuming perfect timing.
We were also interested in finding out if there was any regret relating to the decisions that had been made. When asked ‘If you could go back to when you accessed your pensions, would you have done anything differently?’ it was very encouraging that 71% said ‘No’. Nearly 10% said they would have planned their retirement earlier to better understand their options. Intriguingly, this was more significant for those in the 65 to 74 age bracket.
Finally, we asked respondents about their biggest worry or challenge when planning retirement. The responses are shown in Figure 14.
Figure 13. Regular expenditure expected to be met from pension savings, split by age.
Figure 14. Biggest challenges or worries when planning retirement.
Males and females answered reasonably consistently, but the age group responses perhaps contradict the responses to the earlier questions. The younger groups have a higher fear of running out and admit to a greater lack of understanding, while at the same time, they felt the Freedoms were a good thing.
Other responses to this question had themes around inflation, having enough to meet their living standards, poor annuity rates, lack of planning, dying before they get to enjoy it, the Government moving the goal posts with respect to State pension age, adviser costs and the Government changing taxes and pension rules.
Moderator: Around a third of respondents did not know about the Pensions Freedoms and 25% of those aged 55–64 say that their biggest worry with retirement is running out of money. How do you think we can improve that?
Mr J. Dabrowski: Sadly, it is not too surprising to me that a large proportion of people are not aware of their pension details, the Pensions Freedoms or some of the other choices that they might have. We know that people typically tend not to pay a great deal of attention to their pension until they come close to retirement, and that can leave some people in a difficult place if they have not been saving enough. It also means that people potentially make poor choices when they get to retirement. That is one of the reasons for the interventions around the Investment Pathways, for example, to discourage people from taking out all of their pension money, putting it in the bank and forgetting about it. We have to try to tackle this. It is quite a difficult issue, given the philosophical move that we have made in pension savings. We have moved towards inertia and a lot of the system is built around that. Encouraging people to be active at the right time is an interesting challenge, but one where we need to improve. There are a number of things that can be done. The Pensions Dashboard will help people to see all of their pensions in one place. How well they understand that information is a separate question. The PLSA’s Retirement Living Standards are intended to help people get an easy-to-grasp sense of what they need for their income in retirement. There are lots of other things, the pension attention campaign for example, which focused on trying to engage people. From the data we saw, the campaign worked fairly well in year one and we need to keep building on that for year two. Financial education through schools and employers is a silver bullet that we talk about, but whether this will truly make a difference is hard to say.
The free guidance available from MaPS is helpful. We know that people who use the service really like it, but not all those who are eligible choose to use it. We need to address some of the challenges around the financial advice and guidance boundary, which we know is tough for people to understand. People often want things to happen automatically. The jargon is difficult, complex and technical, so we should simplify the language as much as possible. We also need more product innovation and support for people with regard to decumulation.
It was interesting to see the ongoing gender bias in those surveys. For example, men won’t say that they do not know anything and are over-confident in what they do know. Maybe we need to tackle that too.
Moderator: Everything that you are talking about there, Joe (Dabrowski), is around engagement and improving engagement. Sarah (Luheshi), what do we really mean by engagement and how do we measure it?
Ms S. Luheshi: We want to ensure that people have a full understanding of their pension arrangements. I get frustrated when the solution to more engagement is just sending more communications. That is not addressing the underlying issue, which is a lack of willingness to engage, or a lack of financial capability to do so. It would be helpful if we had a definition of engagement and a way to measure it. The number of people who access the website and the time they spend doing so is a potential measure, but that might merely reflect the complexity of the website rather than representing effective engagement. We also need to consider why we are engaging people, and the outcome that we want. I agree that Dashboards will be a big step forward, but I am not confident we know what we want people to do with that information.
We want to see what can be learned from countries with more experience in DC pensions, such as Australia and Chile. We are also looking for examples of what doesn’t work in terms of trying to improve engagement. Sweden did a huge push to get people more engaged in their investment choices at the point in time just before the market collapsed. They did no follow-up communication or engagement to help people understand why the market collapse had happened and what they could do at that point. As Joe (Dabrowski) pointed out, we need to ensure that people can find the necessary information.
Moderator: You and Joe (Dabrowski) have raised lots of great points. In particular the comment about the number of clicks on a website not being a great measure of engagement. I do agree with your point about the Pensions Dashboard. I think that will be a great way for people to start to learn about the pensions they have, but it is important for people to understand the limitations of the Dashboard.
Andrew (Kemp), in your role as a paraplanner for a financial advice firm, you see the impact of some of this lack of understanding. In the current environment, where the cost-of-living is big factor in people’s minds, are you seeing any differences in the behaviour of people coming to you for advice?
Mr Kemp: I see varying levels of understanding. Pensions are a very broad subject and potentially very complex in terms of financial planning, so this is not a surprise. Generally speaking, our clients have a reasonable understanding of the basics and tend to come to us when there is a particularly technical issue or perhaps a lack of understanding about how death benefits work. In terms of behavioural changes, we tend to see people shifting towards drawing more from non-pension sources first.
In the current climate, there is a greater than usual-focus on investment performance in the short term. The answer there is to try to coach behaviours and shift focus from the past to the future, considering the things that are within the client’s control. For example, perhaps a client has planned a large or one-off capital withdrawal from their long-term savings, and we might see them delaying these or perhaps phasing them in.
Similarly, another client is looking at postponing their retirement until later in the year because of a concern about starting unsecured income withdrawals at a point when the market has dipped. Some other clients are looking at whether or not they should be paying back their mortgages sooner, rather than making pension contributions. In a low-interest-rate environment, where higher-rate income tax relief is available, making pension contributions is normally an obvious win, but now it is less obvious, particularly with the volatility and uncertainty in interest rates. It is important to bear in mind that the cohort being advised is generally a little bit insulated from the cost-of-living challenges. They are more concerned with how much they can put into pension savings.
One client asked us to review his current workplace arrangement, in terms of the level of contributions and the investment strategy. The default fund was a lifestyle arrangement targeting drawdown, but that particular arrangement did not offer drawdown. The investments were rated low to medium risk while still 20 years from retirement, so perhaps the trustees were being a little too cautious. Those are some examples of why people might be coming to us.
Moderator: While default funds are useful, it is important for people to ensure they are appropriate for their circumstances.
Now we move to the question-and-answer session.
Question: Does the PLSA have any statistics about the impact of the Pay Your Pension Some Attention campaign? Secondly, the DWP (Department for Work and Pensions) appears to be favouring the self-service Pensions Dashboard over the Pension Wise service, which involves discussing your situation with a guidance specialist. Do the panel members have any views on that?
Mr Dabrowski: In relation to the Pay Your Pension Some Attention campaign, we saw that people were prompted to have a conversation with their friends and their family, to check their pensions and perhaps to make enquiries with their scheme. Overall, it was very positive and we are hoping for further success in the next campaign.
19% of people recalled the campaign, so that’s 7.9 million adults. We inspired 2.65 million employees to pay their pensions some attention. In total, 91% of the 19% of people who fully recalled everything had taken some action on their pension. We had close to 13 million advertising impressions and over 150 wider pieces of media coverage, as well as a lot of support from parliamentarians and the industry as a whole.
Ms Luheshi: The Pensions Dashboard and Pension Wise both come under the remit of MaPS (Money and Pensions Service), but their aims differ. The Dashboard is in the news at the moment, but Pension Wise is getting a lot of promotion. I do not believe there is any bias from the Government between these two services.
Question: Dashboards might reveal how little some people have saved for retirement?
Ms Luheshi: The PLSA’s Retirement Living Standards aim to help people plan how much they need to save for retirement.
Question: The survey indicated that 40% of people do not seek any kind of guidance or advice with their retirement planning, and only one-third of the respondents took formal regulated advice. How can the industry make such guidance and advice more accessible?
Mr Dabrowski: People are often ill-informed and nervous about taking advice. They think ‘Where do I go to get this? Do I want to ask the question? How much is it going to cost me?’ Then, you have the concerns that were highlighted by the survey: ‘How do I find somebody that I can trust? It looks really expensive.’ Even if it represents a small percentage of the DC fund, paying several thousand pounds for advice can seem a lot, especially for those who think they could do it themselves, and who may be overconfident. We need to encourage people to anticipate the potential need for financial planning. We need free financial tools to be available, whether that’s through MaPS’s MoneyHelper service, or the support frequently provided by employers and schemes.
I expect an increased use of fintech advice for those with simpler products or needs. We also need to ensure that people get value for money. One of the surprises from the Retail Distribution Review (RDR) a few years ago was that even people with relatively large DC pots of over £100,000 were not taking advice and were put off by some of these issues. Also, the boundary between advice and guidance can be hard to understand, and I know that the Treasury and FCA are open to looking into this further.
Good product design can help, through the use of a default decumulation solution for those who want an easy option implemented for them.
Question: How do you see product innovation developing, such as in the use of collective DC schemes?
Mr Dabrowski: I think the Government is looking at the potential role of collective DC schemes in decumulation. There is currently a lot of innovation in the market to help facilitate the transition from accumulation to decumulation, such as from the bigger master trusts. One of the reasons for our guided retirement income choices was to have both governance and product design thresholds. If we can establish what ‘good’ looks like, probably on a statutory footing, we could avoid some of the problems that we have seen. For example, the Master Trust authorisation regime was introduced 5 years after the master trusts were operational.
Question: There is a conflict between the short-termism of HM Treasury and the long-term nature of pensions. How can this be resolved?
Ms Luheshi: It would be great if we had a long-term and cohesive plan. Short-term tinkering with tax rules erodes trust and knowledge, as revealed by the survey results, so some stability would be welcomed. Guy Opperman was in post longer than Sir Steve Webb. Let’s hope that Laura Trott remains in post for some time.
Question: Did the survey test what people actually knew rather than what they thought they knew?
Mr Kemp: No. We did consider following up with an interview but decided not to. We did establish that 21% of respondents (about 400 people) had accessed their pensions under the new regime, which implies a level of understanding.
Moderator: To summarise, I think what we have seen today is that freedom and choice are valued by people approaching retirement. However, there is a definite admission of a lack of understanding and awareness about how to get help. How does the pensions industry bridge that gap and help people to make the right decisions for their retirement? There are many current initiatives, but more can be done.